Air Quality 2019 Preliminary Evaluation - Umweltbundesamt
←
→
Page content transcription
If your browser does not render page correctly, please read the page content below

background // january 2020
Air Quality 2019
Preliminary Evaluation

German Environment Agency
Imprint
Publisher:
Umweltbundesamt [German Environment Agency]
Section II 4.2
PO Box 14 06
D-06813 Dessau-Roßlau
Tel: +49 340-2103-0
buergerservice@uba.de
Internet: www.umweltbundesamt.de
/umweltbundesamt.de
/umweltbundesamt
/umweltbundesamt
/umweltbundesamt
Authors:
Andrea Minkos, Ute Dauert, Stefan Feigenspan,
Susan Kessinger, Andrea Mues
Direct contact to the authors: II4.2@uba.de
Editors:
Section II 4.2 “Air Quality Assessment”
Design:
le-tex publishing services GmbH
Publications as a pdf:
www.umweltbundesamt.de/publikationen/air-quality-2019
Photo credits:
Cover photo: Shutterstock/connel
Photo passive collector, p. 13: Thorsten Zang, State Office
for Nature, Environment and Consumer Affairs
of North-Rhine Westphalia
Photo of air quality monitoring station Neuglobsow, p. 19:
Susanne Kambor
As at: January 2020
ISSN 2363-829X
The information presented in this brochure reflects the
level of research at the time of publication. The definitive
data is presented on the UBA website from the middle of
the year onwards.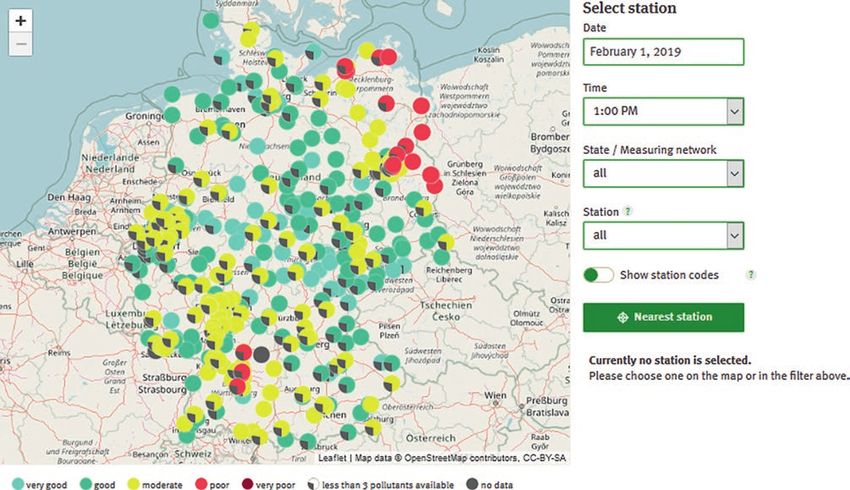
background // january 2020
Air Quality 2019
Preliminary Evaluation
List of figures/tables
List of figures/tables
Figure 1: Overview of the monitoring stations in Germany. . . . . . . . . . . . . . . . . . . . . . . . . . . . . . . . . . . . . . . 6
Figure 2: Diagrammatic presentation of the pollution regimes for particulate matter and nitrogen
dioxide. . . . . . . . . . . . . . . . . . . . . . . . . . . . . . . . . . . . . . . . . . . . . . . . . . . . . . . . . . . . . . . . . . . . . . . . . 7
Figure 3: Percentage share of air monitoring stations exceeding the PM10 limit value. . . . . . . . . . . . . . . . . 8
Figure 4: Average number of days on which the PM10 limit was exceeded (24-hour values > 50 μg/m³) . . . 9
Figure 5: Development of the annual mean PM10 values. . . . . . . . . . . . . . . . . . . . . . . . . . . . . . . . . . . . . . . . 10
Figure 6: Development of the annual mean PM2.5 values and of the Average Exposure Indicator (AEI). . . 11
Figure 7: Percentage share of air monitoring stations exceeding the NO2 limit value for the annual mean. 12
Figure 8: Development of the annual mean NO2 values. . . . . . . . . . . . . . . . . . . . . . . . . . . . . . . . . . . . . . . . . 13
Figure 9: NO2 monthly mean values 2019 and its percentage deviation from the average of the
p
eriod 2015–2018 . . . . . . . . . . . . . . . . . . . . . . . . . . . . . . . . . . . . . . . . . . . . . . . . . . . . . . . . . . . . . . 14
Figure 10: NO2 annual mean values 2019. . . . . . . . . . . . . . . . . . . . . . . . . . . . . . . . . . . . . . . . . . . . . . . . . . . . . 15
Figure 11: Hours during which the information threshold (180 μg/m³) for ozone was exceeded . . . . . . . . 16
Figure 12: Spatial distribution of the number of days on which the long-term objective for the protection
of human health was exceeded (number of days with 8-hour average values > 120 μg/m³) . . . . . 17
Figure 13: Percentage share of air monitoring stations recording an exceedance of the target value . . . . 18
Figure 14: PM10 daily average concentrations at all German monitoring stations at May 2, 2019. . . . . . . . 21
Figure 15: upper panel: development of pollutant concentrations (PM10, ozone and nitrogen dioxide)
at UBA’s monitoring station Waldhof
lower panel: ozone measurements at Waldhof compared to ozone measurements at other
monitoring stations . . . . . . . . . . . . . . . . . . . . . . . . . . . . . . . . . . . . . . . . . . . . . . . . . . . . . . . . . . . . . 22
Figure 16: PM10 maps from January 31 until February 3, 2019: in the beginning of the period high
concentrations only in northeast Germany, then across all of northern Germany, finally a
decrease of the concentrations. . . . . . . . . . . . . . . . . . . . . . . . . . . . . . . . . . . . . . . . . . . . . . . . . . . . 23
Figure 17: AQI throughout Germany at February 1, 2019 13:00. . . . . . . . . . . . . . . . . . . . . . . . . . . . . . . . . . . 24
Figure 18: Line graphs of the three AQI pollutants PM10, ozone and nitrogen dioxide at the station
Hasenholz from J anuary 25 to February 1, 2019 . . . . . . . . . . . . . . . . . . . . . . . . . . . . . . . . . . . . . . 24
Figure 19: left: overview on the monitoring stations in Berlin, middle: good air quality index at the
station Berlin Neukölln, right: free-text search for Berlin . . . . . . . . . . . . . . . . . . . . . . . . . . . . . . 25
Figure 20: left: detail view for Berlin Neukölln, middle: development of the AQI at the station Berlin
Neukölln, right: health advices according to the current AQI. . . . . . . . . . . . . . . . . . . . . . . . . . . . 26
Figure 21: left: favorite list, middle: daily status information and warning alerts for Berlin Frankfurter
Allee, right: options for the map and legend for the AQI. . . . . . . . . . . . . . . . . . . . . . . . . . . . . . . . 26
Figure 22: Morning status information on the AQI at the station Berlin Frankfurter Allee. . . . . . . . . . . . . . 27
Table 1: AQI classes for the three air pollutants . . . . . . . . . . . . . . . . . . . . . . . . . . . . . . . . . . . . . . . . . . . . . 23
4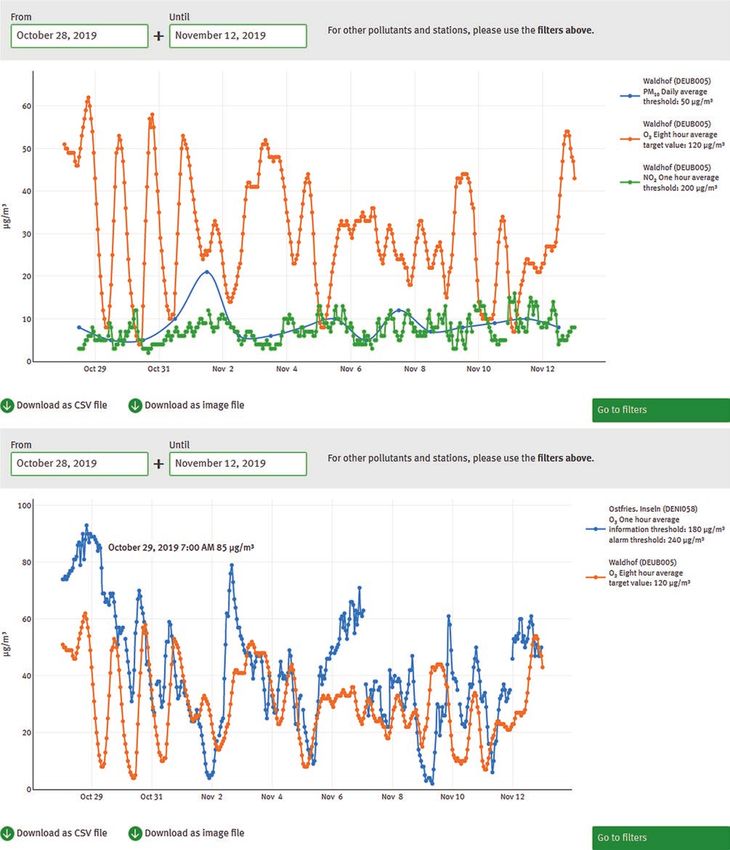
Table of contents
Table of contents
I Air Quality in 2019: Data basis and evaluation methodology������������������������������������������� 6
1 Air quality and air pollutants�������������������������������������������������������������������������������������������� 6
2 Provisional nature of the information��������������������������������������������������������������������������������� 7
3 Causes of air pollution��������������������������������������������������������������������������������������������������� 7
4 Influence of environmental conditions�������������������������������������������������������������������������������� 7
II Particulate matter: For the first time no limit value exceedances in Germany�������������������� 8
1 PM10 – 24-hour values��������������������������������������������������������������������������������������������������� 8
2 PM10 – Annual mean values��������������������������������������������������������������������������������������������� 9
3 PM2.5 – Air pollution���������������������������������������������������������������������������������������������������� 10
III Nitrogen dioxide: Further reduction of pollution���������������������������������������������������������� 12
1 NO2 – Annual mean values�������������������������������������������������������������������������������������������� 12
2 NO2 – One hour values������������������������������������������������������������������������������������������������� 15
IV Ground-level ozone: Overall pollution remains average but shows high peak
c oncentrations �������������������������������������������������������������������������������������������������������� 16
1 O3 – Information and alert threshold�������������������������������������������������������������������������������� 16
2 O3 – Target value for the protection of human health������������������������������������������������������������� 17
3 O3 – Protection of the vegetation������������������������������������������������������������������������������������� 18
V Current air quality conditions throughout Germany – comprehensive information on the
Internet or compact information via app���������������������������������������������������������������������� 20
1 How good is the air quality in my neighbourhood?���������������������������������������������������������������� 20
2 Air data portal����������������������������������������������������������������������������������������������������������� 20
3 Air quality to go: The air quality app��������������������������������������������������������������������������������� 25
Further information on the topic������������������������������������������������������������������������������������� 28
5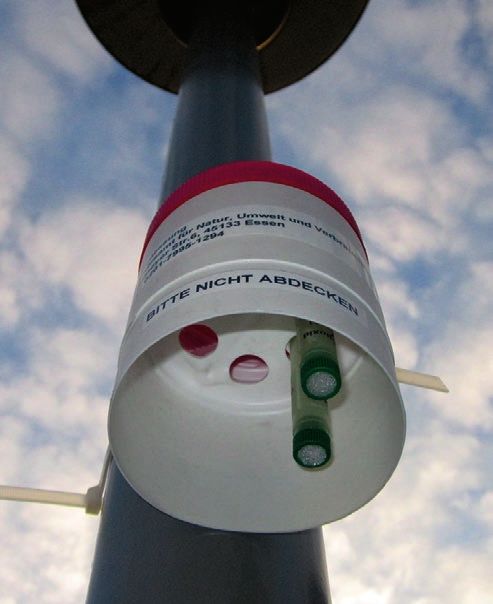
I Air Quality in 2019: Data basis and evaluation methodology

I Air Quality in 2019: Data basis and evaluation methodology
1 Air quality and air pollutants
Air quality is monitored throughout Germany by the                           Particulate matter (PM10, PM2.5)
individual federal states and the UBA (German Envi-                          is defined as particles which pass through the
ronment Agency/Umweltbundesamt). In this respect,                            size-selective air inlet of a monitoring device, which
air quality is determined on the basis of the amount                         demonstrates a 50 percent efficiency cut-off for an
of air pollutants it contains, which means substances                        aerodynamic diameter of 10 (PM10) and 2.5 (PM2.5)
which have a harmful impact on human health                                  micrometres (µm) respectively. Above all, particu-
and/or the environment. These include, primarily,                            late matter is propagated by combustion processes
particulate matter, nitrogen dioxide and ozone.                              in motor vehicles, power stations and small-scale
                                                                             furnaces and during the production of metals and
The pollutant concentrations in the air are measured                         steel. It is also propagated by soil erosion and
several times a day at over 600 air monitoring                               precursors such as sulphur dioxide, nitrogen oxides
stations throughout Germany (Figure 1). It is the                            and ammonia. Particulate matter has been proven
task of the individual federal states to monitor the                         to have a negative impact on human health.
air quality, therefore most of the data come from
their monitoring networks. For the Germany-wide                              Nitrogen dioxide (NO2)
assessment of the air quality, the data gathered by the                      is a reactive nitrogen compound which occurs in the
federal states is collected and evaluated at the UBA.                        form of a by-product during combustion processes,
                                                                             particularly in motor vehicles, and can have several
The evaluation and assessment of the air quality                             negative effects on the environment and health.
takes place in terms of the limit and target values as                       Nitrogen dioxide affects the respiratory mucous
defined by the Directive on Ambient Air Quality and                          membrane, influences the respiratory function and
                                                                             can lead to a Bronchoconstriction, which may be
Figure 1                                                                     worsened by the impact of allergens.

Overview of the monitoring stations in Germany
                                                                             Ozone (O3)
                                                                             is a colourless and toxic gas which forms a natural
                                                                             layer in the upper atmosphere (stratosphere) and
                                                                             protects the earth from the harmful ultraviolet radi-
                                                                             ation from the sun (the ozone layer). During intense
                                                                             sunlight, however, it also arises at ground-level
                                                                             due to complex photochemical processes between
                                                                             ozone precursors – primarily nitrogen oxides and
                                                                             volatile organic compounds. High concentrations of
                                                                             ozone can cause people to suffer coughs, head-
                                                                             aches and respiratory tract irritations.

                                                                         Cleaner Air for Europe1. The results are also compared
                                                                         with the considerably stricter recommendations of the
                                                                         World Health Organization (WHO).

                          Source: German Environment Agency (UBA) 2020

                                                                         1   EU Directive 2008/50/EC, which became German law with the 39th Ordinance
                                                                             Implementing the Federal Immission Control Act (Ordinance on Air Quality
                                                                             Standards and Emission Ceilings – 39. BImSchV).

6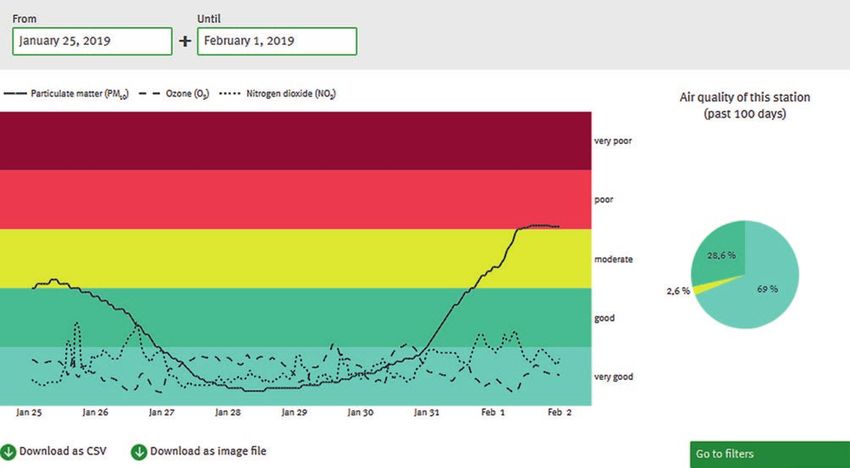
I Air Quality in 2019: Data basis and evaluation methodology
2 Provisional nature of the information 4 Influence of environmental conditions
This evaluation of air quality in Germany in the year In the following sections, the concentration values
2019 is based on preliminary data which has not yet recorded at the individual air monitoring stations
been conclusively audited from the air monitoring are summarised in the form of what are referred to
networks of the federal states and the UBA, valid on as “pollution regimes”. Pollution regimes group air
20th January 2020. Due to the comprehensive quality monitoring stations together with similar environ-
assurance within the monitoring networks, the final mental conditions. The “rural background” regime
data will only be available in mid-2020. relates to areas in which the air quality is largely
uninfluenced by local emissions. The air monitoring
The currently available data allows for a general stations in this regime therefore represent the
assessment of the past year. The following pollutants regional pollution level, which is also referred to as
were subject to consideration: particulate matter the regional background. The “urban background”
(PM10 and PM2.5), nitrogen dioxide (NO2) and ozone regime is characterised by areas in which the meas-
(O3), since, the measured concentrations are either ured pollutant concentrations can be seen as being
slightly higher or lower than the limit and target typical for the air quality in the city. In this respect,
values for the protection of human health for such the pollution results from emissions in the city itself
pollutants. (road traffic, heating systems, industry, etc.) and
that in the regional background. The air monitoring
3 Causes of air pollution stations in the “urban traffic” regime are typically
The primary sources of the air pollutants are road located on busy roads. As a result of this, the urban
traffic and combustion processes in industry, the background pollution is joined by a contribution
energy sector and households. Agriculture also which arises due to the direct road traffic emissions.
contributes to particulate matter emissions due to the Figure 2 provides a diagrammatic representation
formation of what are known as “secondary parti- of the contributions by the individual pollution
cles”, which are particles that arise from complex regimes, although it only provides the approximate
chemical reactions between gaseous substances. The proportions. Another pollution regime relates to
degree of the pollution level is also influenced by measurements in the vicinity of industrial areas,
the weather conditions. In cold weather, emissions which are used to assess the contribution of indus-
(quantity of a pollutant released to the ambient air) trial emissions to the air quality in nearby residential
often increase because for example heating systems areas.
go into increased use. High-pressure weather during
the winter, which is often characterised by low wind
Figure 2
speeds and a limited vertical exchange of air, means
that air pollutants become concentrated in the lower Diagrammatic presentation of the pollution regimes
atmospheric strata. High-pressure weather in the for particulate matter and nitrogen dioxide
summer, with intense sunlight and high tempera- Modified according to Lenschow*
tures, acts to boost the formation of ground-level
ozone.
At high wind speeds and under positive mixing
conditions, the levels of pollution fall, however.
Inter-year variations in the levels of air pollution are
primarily caused by different weather conditions of
this kind. They therefore affect the influence of the
more long-term development of the emissions. rural background urban background urban traffic
* Lenschow et al., Some ideas about the sources of PM10,
Atmospheric Environment 35 (2001) p. 23–33
7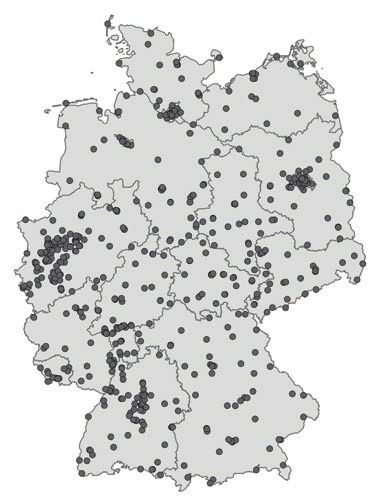
II Particulate matter: For the first time no limit value exceedances in Germany
II Particulate matter: For the first time no limit value
exceedances in Germany
1 PM10 – 24-hour values years continues. In the previous year the limit value
The limit value for the 24-hour PM10 value, which was only exceeded at one industrial station. Since
needs to be complied with since 2005, was for the 2012 measurements at all background stations are
first time not exceeded at any German monitoring below the limit value, as shown in Figure 3 (yellow
station, i. e. none of the about 380 stations measured bars).
PM10 24-hour values over 50 μg/m³ at more than 35
days in 2019. Thus, the positive trend of the past The recommendations of the World Health Organiza-
tion (WHO2) were not complied with at 36 percent of
all air monitoring stations.
EU limit value Figure 4 shows how many days were recorded on
The 24-hour PM10 value must not exceed 50 µg/m³ which the limits were exceeded, on average, per
more than 35 times per year. month. In this case, 2019 is compared with 2011,
WHO recommendation
The 24-hour PM10 value should not exceed 50 µg/m³ 2 WHO Air quality guidelines for particulate matter, ozone, nitrogen dioxide and
sulfur dioxide, Global update 2005: http://www.euro.who.int/en/health-topics/
more than 3 times per year. environment-and-health/Housing-and-health/publications/pre-2009/air-qualit-
yguidelines.-global-update-2005.-particulate-matter,-ozone,-nitrogen-dioxide-
and-sulfur-dioxide
Figure 3
Percentage share of air monitoring stations exceeding the PM10 limit value
for the 24-hour values in the corresponding pollution regime, time frame 2005–2019
70 %
60 %
50 %
40 %
30 %
20 %
10 %
0%
2005 2006 2007 2008 2009 2010 2011 2012 2013 2014 2015 2016 2017 2018 2019
rural background urban background urban traffic
Source: German Environment Agency (UBA) 2020
8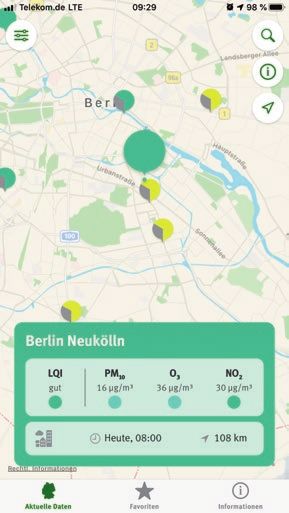
II Particulate matter: For the first time no limit value e
xceedances in Germany
Figure 4
Average number of days on which the PM10 limit was exceeded (24-hour values > 50 μg/m³)
per month in the corresponding pollution regime, shown for the years 2019, 2018, 2011 and the period 2005–2018
2019
2018 rural background
2011
2005–2018
2019
2018
2011 urban background
2005–2018
2019
2018 urban traffic
2011
2005–2018
0 5 10 15 20 25 30 35 40
Jan Feb Mar Apr May June July Aug Sept Oct Nov Dec
Source: German Environment Agency (UBA) 2020
in which the levels of pollution were high due to the 2 PM10 – Annual mean values
frequent occurrence of cold, stable high-pressure The exceptionally long, ten-month dry period in
weather conditions, with the previous year (2018) 2018, resulted in increased annual mean PM10 values.
and an extended reference period (2005–2018). It can However, in 2019 the decreasing trend of the mean
be seen that in 2019 there were only very few days PM10 pollution continued. 2019 was the year with the
on which the limits were exceeded, most of them lowest level of pollution compared to the considered
occurred in the first months of the year. This goes period since 2000 (Figure 5). Accompanied by the
along with a very dry February and April; the Febru- regional falls in the PM10 emissions, the annual mean
ary is even classified as the sunniest since the begin- PM10 values also show a clear fall in all pollution
ning of the systematic weather observation3. The regimes throughout the entire period of observation.
summer was too dry and exceptionally warm, but in The progression is also characterised by strong
September precipitation events stopped the drought. inter-year variations, however, particularly due to
As a result of the mild temperatures in November and the different weather conditions. The PM10 limit of
December no episodes with high particulate matter 40 µg/m³ as the annual mean value was complied
concentrations were observed, which are normally with throughout Germany. 13 percent of the air
characteristic for winter months. monitoring stations recorded values that infringed
the air quality guidelines proposed by the WHO,
however. The vast majority of these air monitoring
stations were in urban traffic locations.
3 Press release of the German weather service DWD, 2019: https://www.dwd.de/
DE/presse/pressemitteilungen/DE/2019/20191230_deutschlandwetter_
jahr2019_news.html?nn=16210
9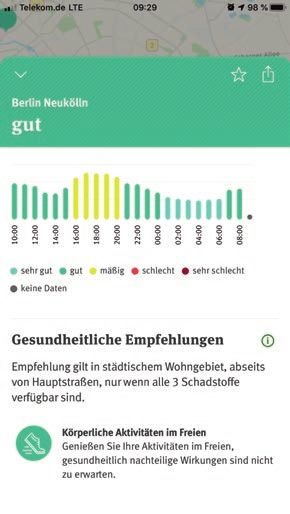
II Particulate matter: For the first time no limit value exceedances in Germany
Figure 5
Development of the annual mean PM10 values
via selected air monitoring stations in the corresponding pollution regime, time frame 2000–2019
40
35
30
25
µg/m³
20
15
10
5
0
2000 2001 2002 2003 2004 2005 2006 2007 2008 2009 2010 2011 2012 2013 2014 2015 2016 2017 2018 2019
rural background urban background urban traffic
Source: German Environment Agency (UBA) 2020
3 PM2.5 – Air pollution
From 1st January 2015, for the smaller fraction of EU limit value
particulate matter which only contains particles with The annual mean PM10 value must not exceed
a maximum diameter of 2.5 micrometres (µm), an 40 µg/m³.
annual mean limit of 25 µg/m³ applies throughout
Europe. In Germany, since 2015 and also in 2019, WHO recommendation
this value was not exceeded at any air monitoring The annual mean PM10 value should not exceed
station. The annual mean PM2.5 values decrease 20 µg/m³.
during the entire period and for all pollution regimes
(Figure 6). The stricter recommendations of the
WHO (10 µg/m³ as the annual mean value) were not
complied with at more than half of the almost 200
measuring stations (57 %). Furthermore, the WHO EU limit value
recommendation is that the 24-hour PM2.5 value the annual mean PM2.5 value must not exceed
should not exceed 25 µg/m³ more than 3 times a 25 µg/m³.
year. This recommendation was not complied with at
almost all air monitoring stations (98 %). The EU Air WHO recommendation
Quality Directive also requires the average exposure The annual mean PM2.5 value should not exceed
of the population to PM2.5 to be reduced until the 10 µg/m³. The 24-hour PM2.5 value must not exceed
year 2020. For this purpose, the Average Exposure 25 µg/m³ more than 3 times per year.
Indicator (AEI) was developed. As the initial value for
10II Particulate matter: For the first time no limit value e
xceedances in Germany
Figure 6
Development of the annual mean PM2.5 values and of the Average Exposure Indicator (AEI)
via selected monitoring stations in the corresponding pollution regime, time frame 2010–2019
20
17,0
16,4
16,2
15,3
15
14,6
14,1
13,4
12,6 12,6
12,1
µg/m³
10
5
0
2010 2011 2012 2013 2014 2015 2016 2017 2018 2019
rural background urban background urban traffic AEI (3-year averaging period)
Source: German Environment Agency (UBA) 2020
Germany for 2010, an AEI of 16.4 µg/m³ was calcu-
lated as the average value of the years 2008 to 2010. Exposure
According to the requirements of the EU Directive, The contact of an organism with chemical, biologi-
this results in a national reduction goal of 15 percent cal or physical influences is known as “exposure”.
until 2020. Accordingly, the AEI calculated for 2020 A person is “exposed” to particulate matter, for
(average value of the years 2018, 2019 and 2020) example.
may not exceed the value of 13.9 µg/m³. In 2019
(average value of the years 2017, 2018 and 2019), How is the Average Exposure Indicator (AEI)
the AEI is totalled 12 µg/m³ (estimation, because not calculated?
for all measuring stations data are already available) The average exposure indicator is determined as
and therefore was complied with for the fourth an average value over a period of 3 years from the
time, together with the 2016’s, 2017’s and 2018’s individual annual mean PM2.5 values of selected air
AEI. Therefore, it can be assumed that the national monitoring stations with an urban background. This
reduction goal of 15 percent can be reached for 2020. results in a value which is expressed in µg/m³ for
each 3-year period.
In addition, from 1 January 2015 onwards, the AEI
st
is not permitted to exceed a value of 20 µg/m³. This
value has not been exceeded in Germany since the
start of the measurements in 2008.
11III Nitrogen dioxide: Further reduction of pollution
III Nitrogen dioxide: Further reduction of pollution
1 NO2 – Annual mean values
Nitrogen dioxide is measured at about 400 automatic EU limit values
monitoring stations across Germany. In addition, The annual mean NO2 value must not exceed
about 130 passive collectors measure nitrogen 40 µg/m³.
dioxide (see photo). Most of the data of the passive
collectors is not yet available and thus not included in WHO recommendation
this preliminary evaluation. Taking into account all The WHO recommendation is equivalent to the EU
measurement data, available for UBA at 20th January limit value.
2020, 24 percent of the air monitoring stations in
urban traffic locations exceeded the limit. On the
basis of a projection derived from the previous years’
the development of the average NO2 values only air
data, we estimate the proportion of all air monitoring
monitoring stations were selected for this figure that
stations in urban traffic locations that exceeded the
conducted measurements over an extended period.
limit and thus the identical WHO recommendation in
The levels of pollution are primarily determined by
2019 to be approx. 21 percent (Figure 7, red bars).
local emission sources – particularly the traffic in
urban conurbations – and only show limited inter-
The nitrogen dioxide pollution shows a clear decrease
year variations due to weather.
in the last decade (Figure 8). In order to minimize
the influence of the closure or opening of stations on
Figure 7
Percentage share of air monitoring stations exceeding the NO2 limit value for the annual mean
in the corresponding pollution regime, time frame 2010–2019
80 %
70 %
60 %
50 %
40 %
30 %
20 %
10 %
0%
2010 2011 2012 2013 2014 2015 2016 2017 2018 2019
rural background urban background urban traffic projection urban traffic
Source: German Environment Agency (UBA) 2020
12III Nitrogen dioxide: Further reduction of pollution
Figure 8
Development of the annual mean NO2 values
via selected air monitoring stations in the corresponding pollution regime, time frame 2000–2019
60
50
40
µg/m³
30
20
10
0
2000 2001 2002 2003 2004 2005 2006 2007 2008 2009 2010 2011 2012 2013 2014 2015 2016 2017 2018 2019
rural background urban background urban traffic
Source: German Environment Agency (UBA) 2020
In rural areas, which are typically a long way from
the major sources of NO2, from 2000–2019, the
average annual concentration for all the air monitor-
ing stations amounted to 10 µg/m³ (Figure 8, green
curve). At the air monitoring stations with an urban
background, the values were well below the limit of
40 µg/m³ (Figure 8, yellow curve). In 2019, like in
the previous year, the average NO2 concentration at
urban traffic air monitoring stations was well below
40 µg/m³. Thus, the trend in reduction over the last
ten years continues.
In 2019 the average NO2 concentration decreased like
in the previous year. This reduction is mainly due to
11 months in which the concentration in all pollution
regimes was below the average. Figure 9 shows the
NO2 monthly mean values 2019 and its percentage
deviation from the average of the four previous years.
It can be seen that the average NO2 concentrations
were in all month, except February, below the
average of the four years period.
Passive collector: A passive collector is a small monitoring device
Even though the concentrations at urban traffic which operates without electrical power and in which several
detection tubes absorb the pollutants from the air. The detection
stations are generally decreasing, annual mean tubes are regularly removed and their contents evaluated in the
values of over 40 µg/m³ were still measured at many laboratory.
13III Nitrogen dioxide: Further reduction of pollution
Figure 9
NO2 monthly mean values 2019 and its percentage deviation from the average of the period 2015–2018
50
45
40
35
30
in µg/m³
25
20
15
10
5
0
r
r
r
be
ry
be
be
r
y
st
be
ch
ar
ua
ril
ne
em
ay
ly
m
m
gu
ar
to
nu
Ap
Ju
br
ve
ce
M
Ju
pt
Au
M
Oc
Ja
Fe
No
De
Se
45 %
30 %
15 %
0%
–15 %
–30 %
–45 %
rural background urban background urban traffic
Source: German Environment Agency (UBA) 2020
14III Nitrogen dioxide: Further reduction of pollution
Figure 10
NO2 annual mean values 2019
of all urban traffic monitoring stations
80
70
60
50
limit value = 40 μg/m3
µg/m³
40
30
20
10
0
Source: German Environment Agency (UBA) 2020
air monitoring stations and cases in which the limits 2 NO2 – One hour values
were exceeded were therefore recorded. Figure 10 Since 2010, one hour NO2 values exceeding 200 µg/m³
shows the NO2 annual mean values of all air monitor- are only permitted a maximum of 18 times per year.
ing stations in urban traffic locations in descending In 2019, like in the previous years, this value was
order. not exceeded. The last time that few exceedances at
urban traffic station were recorded was in 2016.
The gaps result from the missing data of the passive
collectors, which are only available in the course One percent of all air monitoring stations in urban
of 2020. Their position in the descending order traffic locations failed to comply with the WHO
is deduced from the data of the previous year. It recommendation in 2019.
becomes clear that there are big differences between
the monitoring stations: Some stations exceed
the limit value of 40 µg/m³ slightly, whereas other EU limit value
stations exceed the limit value clearly. The one hour NO2 values must not exceed
200 µg/m³ more than 18 times per year.
WHO recommendation
The one hour NO2 values should never exceed
200 µg/m³.
15IV Ground-level ozone: Overall pollution remains average but shows high peak concentrations
IV Ground-level ozone: Overall pollution remains average but
shows high peak concentrations
1 O3 – Information and alert threshold Figure 11 shows that the exceedances of the infor-
Ozone is measured at about 260 monitoring stations mation threshold vary in a wide range between the
throughout Germany. In 2019, the highest 1-hour years, the record-breaking summer of 2003 sticks out
average value amounted to 314 µg/m³. This value is clearly. But also the year 2015, with exceptional hot
therefore considerably higher than the previous year and dry periods in July and August, was character-
value (258 µg/m³) and also higher than the maximum ised by a higher ozone pollution than 2019.
values of the previous years. In 2019 the alert thresh-
old of 240 µg/m³ was exceeded at 11 stations during The reason for the variation of the peak concentration
in total 22 hours at three days. In the previous year between the years is the high dependency on the
the alert threshold was exceeded at one single station weather conditions. In contrast to particulate matter
one time. The information threshold of 180 µg/m³ and nitrogen dioxide, ozone is not emitted directly
was exceeded on 19 days. 2019 was an average year but formed from specific precursors (nitrogen oxides
with regards to exceedances of the threshold values, and volatile organic compounds) and with intensive
compared to the last 20 years. solar radiation. When there are several days of
Figure 11
Hours during which the information threshold (180 μg/m³) for ozone was exceeded
Average over selected monitoring stations
50
45
40
35
30
number of hours
25
20
15
10
5
0
2000 2001 2002 2003 2004 2005 2006 2007 2008 2009 2010 2011 2012 2013 2014 2015 2016 2017 2018 2019
rural background urban background
Source: German Environment Agency (UBA) 2020
16IV Ground-level ozone: Overall pollution remains average but shows high peak concentrations
summery high-pressure weather conditions, ozone ised by higher ozone pollution as a result of sustained
can be accumulated in the lower atmospheric layers high-pressure weather conditions, 37 exceedance
which leads to high concentrations. These kind of days were recorded as an average over all air monitor-
periods with long-lasting summer weather were not ing stations.
observed in the summer 2019, but it was character-
ised by exceptional high temperatures. Most exceed- Figure 12 shows the spatial distribution of the
ances of the alert threshold were recorded around number of exceedance days in 2019 in comparison
25th July. Exceptional high temperatures of 40 °C and to the last four years. This figure highlights the
above were measured at these days according to the differences between the years. In 2019, compared to
German Weather Service4. Such temperatures are the previous year, less exceedances were recorded
often related to high ozone formation. but still considerably more than in the years 2016
and 2017. Ozone concentration is generally lower in
2 O3 – Target value for the protection of Northern Germany, particularly so in 2015.
human health
In 2019, like in the previous year, the long-term The WHO recommendation that the 8-hour average
objective for the protection of human health (8-hour values should not exceed 100 µg/m³ was missed
average values of over 120 µg/m³) were measured at again.
all monitoring stations (= 100 %), that is the long-term
objective is not complied with. A 3-year period is monitored for the target value
for the protection of human health: on average,
In 2019, an ozone value of 120 µg/m³, as the highest an 8-hour average value of 120 µg/m³ may only be
daily 8-hour average value, was exceeded on an exceeded on 25 days. In the most recent averaging
average of 24 days per station. Compared to the period of 2017 to 2019, however, 41 percent of the
time period since 2000, this value is slightly above air monitoring stations exceeded this value on more
average. In the previous year, which was character- than 25 days. That are 13 percent more, compared to
the previous averaging period. Figure 13 shows that
most cases in which the target values were exceeded
occurred in rural areas – in contrast to pollutants
4 www.dwd.de/DE/presse/pressemitteilungen/DE/2019/20190730_
deutschlandwetter_juli such as particulate matter and nitrogen dioxide,
Figure 12
Spatial distribution of the number of days on which the long-term objective for the protection of human
health was exceeded (number of days with 8-hour average values > 120 μg/m³)
time frame 2015–2019, based on station measurements and a geostatistical interpolation method
2015 2016 2017 2018 2019
0–5 > 10 > 20 > 30 > 40 > 75
>5 > 15 > 25 > 35 > 50
Source: German Environment Agency (UBA) 2020
17IV Ground-level ozone: Overall pollution remains average but shows high peak concentrations
Figure 13
Percentage share of air monitoring stations recording an exceedance of the target value
for the protection of human health, time frame 2010–2019 (in each case, 1-year moving average over 3 years)
70%
60%
50%
40%
30%
20%
10%
0%
2008–2010 2009–2011 2010–2012 2011–2013 2012–2014 2013–2015 2014–2016 2015–2017 2016–2018 2017–2019
3-years-average
rural background urban background
Source: German Environment Agency (UBA) 2020
which have the highest concentrations in the vicinity In 2019, the long-term objective for the protection
of roads, the ozone values in the vicinity of roads are of the vegetation (6,000 µg/m³ h) was complied with
a lot lower. Therefore, ozone is rarely measured at air at only one monitoring station. In the previous year,
monitoring stations in urban traffic locations. the target value was exceeded at every station. In
comparison with the last 10 years the ATO40-values
3 O3 – Protection of the vegetation at rural background stations were slightly higher in
According to the EU Air Quality Directive, to 2019.
determine the target values for the protection of the
vegetation (AOT40), only the data from the around New methods of the impact evaluation of ozone have
160 air monitoring stations in non-urban locations been developed meanwhile. They are recommended
is considered. For the target value (which has been for monitoring air pollution impacts according to
mandatory since 2010), an averaging over a five-year annex V in the NEC-directive (Directive 2016/2284
period is required. The target value (18,000 µg/m³ h on the reduction of national emissions of certain
obtained from May to July) for the most recent averag- atmospheric pollutants). In this respect, it isn’t just
ing period of 2015 to 2019 was exceeded at 49 out of the concentration of ozone, but the meteorological
160 air monitoring stations (= 31 %, previous year: 40 conditions, the opening characteristics of the stomata
air monitoring stations = 25 %). of the plants and therefore the ozone flux into the
plants, which are taken into account.
18IV Ground-level ozone: Overall pollution remains average but shows high peak concentrations
Information threshold WHO recommendation
With ozone values of over 180 µg/m³ (1-hour average The 8-hour average values should never exceed
value), the general public is notified by the media of 100 µg/m³.
the presence of a health risk for particularly sensitive
sections of the population. Target values for the protection of vegetation (AOT40)
The term AOT40 (Accumulated Ozone exposure over a
Alert threshold Threshold of 40 parts per billion) designates the total
With ozone values of over 240 µg/m³ (1-hour average sum of the differences between the 1-hour average
value), the general public is warned by the media of the values exceeding 80 µg/m³ (= 40 ppb) and the value
presence of a general risk to human health. 80 µg/m³ between 8 am and 8 pm in the months of May
to July. Since 2010, as 5-year average, the AOT40 target
Target values for the protection of human health value should not exceed a value of 18,000 µg/m³ h –
Ozone values of over 120 µg/m³ (highest daily 8-hour i. e. 9,000 ppb h and/or 9 ppm h. Over the long term,
average value) are only permitted to occur on a the value should not exceed a maximum value of
maximum of 25 days per calendar year, averaged over 6,000 µg/m³ h in one year – i. e. 3,000 ppb h and/or
3 years. Over the long term, the 8-hour average values 3 ppm h.
should never exceed 120 µg/m³ (long-term objective).
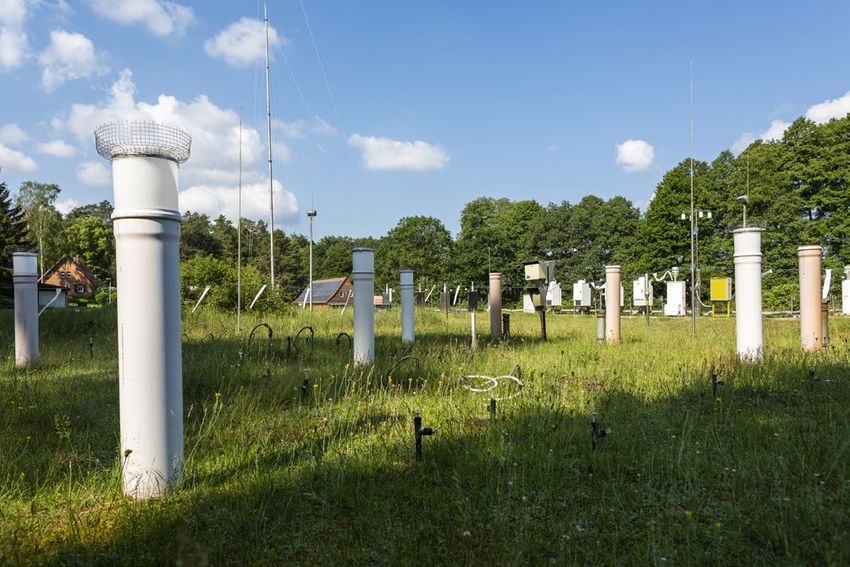
UBA air quality monitoring station Neuglobsow
19V Current air quality conditions throughout Germany
V Current air quality conditions throughout Germany –
comprehensive information on the Internet or compact
information via app
1 How good is the air quality in my neigh- dioxide, ozone, sulfur dioxide, carbon monoxide) in
bourhood? specific regions and on specific days, and in some
Air quality in Germany is monitored every hour. cases, times of day. There is also an ozone forecast for
About 99 % of the data are delivered by federal states the current day and a two-day outlook. The measured
monitoring stations (e. g. State Environmental Agen- concentrations at all stations for all five pollutants are
cies). The monitoring stations are operated by the up-to-date but historical data is also available. Tables
federal states to monitor air quality for the protection of exceedances can be generated for the current year
of human health. The up-to-date measured data of of short-term limit and target values for particulate
about 400 monitoring stations are collected by the matter (PM10), nitrogen dioxide and ozone. An annual
German Environment Agency (UBA). One hour after tabulation option enables users to compare annual
the data is recorded, the data are available via the air mean values from earlier years for each pollutant,
data web portal and an app. Thereby it is possible to going back to 2000.
obtain current air quality information at a selected
station or across Germany. The choice of the available pollutants and the averag-
ing period is consistent with EU Directive 2008/50/
The free and ad-free app “Luftqualität” (which EC5 specifications for near-time information of the
means air quality) for Android and iPhone devices population:
by the German Environment Agency was launched
in August 2019. The app posts hourly updated data ▸▸ Particulate Matter – PM10 (daily average)
on harmful pollutants such as particulate matter ▸▸ Nitrogen dioxide – NO2 (one hour average)
(PM10), nitrogen dioxide and ozone. Furthermore, ▸▸ Ozone – O3 (one hour average, eight hour average)
an air quality index (AQI) provides an instant view ▸▸ Carbon monoxide – CO (eight hour average)
of the air quality at every station. Depending on the ▸▸ Sulfur dioxide – SO2 (one hour average, daily
AQI, the app issues health advice about doing outdoor average)
activities. Users can choose to receive warning alerts
when air quality is poor. Monitoring stations: visualization and download
of data
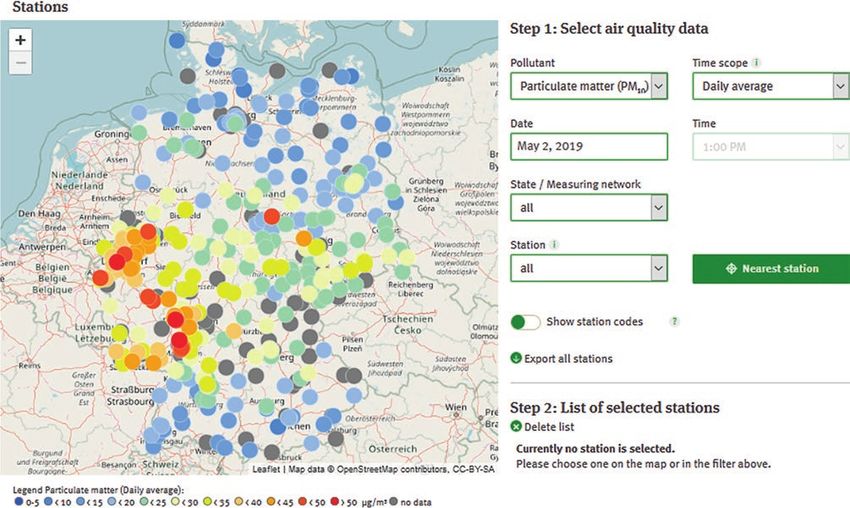
UBA’s upgraded, newly designed air data web portal The stations page provides measured concentrations
allows users to retrieve more detailed information of a freely selectable air pollutant at a given time
on air quality and do searches on current and throughout Germany (Figure 14). The colours in the
past conditions: https://www.umweltbundes- legend provide information on the concentration
amt.de/en/data/air/air-data. A new feature is the air level, red indicates concentrations harmful for health
quality index which, just as the app does, provides (exceedance of limit or target values).
a quick overview of current conditions. It also offers
diagrams of AQI trends from past to present. Line graphs can be displayed in a diagram to reflect
the development of pollution concentrations at
2 Air data portal individual stations. The pollutant, the station and
The data portal offers the option to visualize the data the time period are freely selectable. This enables the
of all available monitoring stations in Germany or of user to not only visualize the development of pollut-
a specific selection of stations. Furthermore, it has ant concentrations at one station, but to also compare
maps of Germany which show the concentrations of values of different stations (Figure 15). The data and
five air pollutants (particulate matter (PM10), nitrogen the diagram can be downloaded.
5 and its implementation into German law (39. BImSchV)
20V Current air quality conditions throughout Germany
Figure 14
PM10 daily average concentrations at all German monitoring stations at May 2, 2019
Maps: area maps and forecast How good is the air at each monitoring station? –
The majority of the monitoring stations measure air The air quality index
pollutants in the rural and urban background. These The air quality index provides an instant view of the
measurements are therefore representative for not air quality at every station. It is calculated using
only the direct surrounding, but also for a larger area the measured concentrations of the three pollutants
around the station. These measurements are therefore nitrogen dioxide, particulate matter (PM10) and ozone,
valid for a spatial interpolation, which provides maps with the concentration with the poorest individual
for all of Germany. Such maps are helpful to illustrate result determining the total result of the AQI. The
large scale air pollution events (Figure 16). Measure- AQI is divided in five classes, from “very good” to
ments which are only representative directly at the “very poor” (Table 1). For every AQI class, there is
location of the monitoring station itself are shown as an assessment about whether or not air pollution is
a coloured dot in the map. This holds especially for harmful to health or if outdoor activities should be
traffic and industrial stations. avoided (more information).
Beyond the maps for the present and past, the air The current and past index values can be displayed in
data portal also offers maps with forecasts for ozone. a map across Germany (Figure 17). If a pollutant at a
These forecast maps are based on model calculations station is missing, which is relevant for the index, an
and actual measurement data. This enables users and incomplete circle symbol is noted for the station. This
particularly very sensitive persons to gather informa- information is relevant as the accuracy of the AQI
tion on current maximum ozone concentrations and a depends on the completeness of the data.
two-day forecast.
Users interested in the air quality development over
the last days and weeks at a certain station can use the
option to display the AQI in line diagrams (Figure 18).
21V Current air quality conditions throughout Germany Figure 15 upper panel: development of pollutant concentrations (PM10, ozone and nitrogen dioxide) at UBA’s monitoring station Waldhof lower panel: ozone measurements at Waldhof compared to ozone measurements at other monitoring stations 22
V Current air quality conditions throughout Germany

Figure 16

PM10 maps from January 31 until February 3, 2019: in the beginning of the period high concentrations only in
northeast Germany, then across all of northern Germany, finally a decrease of the concentrations

                                          concentrations in microgram per cubic meter air

                                    0 µg/m3    10 µg/m3      20 µg/m3   30 µg/m3     40 µg/m3   >50 µg/m3

            31st Jan 2019                     1st Feb 2019                          2nd Feb 2019                 3rd Feb 2019

Table 1

AQI classes for the three air pollutants

                            hourly average of NO2 in              hourly moving daily average               hourly average of O3
 AQI
                                     µg/m³                              of PM10 in µg/m³                         in µg/m³

 very poor                           > 200                                     > 100                               > 240

 poor                              101–200                                    51–100                             181–240

 moderate                           41–100                                     36–50                             121–180

 good                               21–40                                      21–35                              61–120

 very good                           0–20                                      0–20                                0–60

This provides a quick overview of the AQI class the                      Thus, by means of maps and diagrams it is possible
three pollutants are allocated to during the chosen                      to find out about the past, present and future air
time period. Furthermore, it shows, for example,                         quality situation in Germany. In context of EU-wide
which of the pollutants is responsible for the                           reporting, air quality is only assessed at every
degradation of air quality at the selected station. The                  station after the end of the year. Exceedances of the
appropriate data and figure can be downloaded.                           limit value entail extensive measures to improve air
                                                                         quality. Station lists show current and past situations
                                                                         of exceedances.

                                                                                                                                   23
V Current air quality conditions throughout Germany Figure 17 AQI throughout Germany at February 1, 2019 13:00 Figure 18 Line graphs of the three AQI pollutants PM10, ozone and nitrogen dioxide at the station Hasenholz from January 25 to February 1, 2019 24
V Current air quality conditions throughout Germany

Exceedances: situation in the current year                3 Air quality to go: The air quality app
The “exceedances” page provides tables listing the        Shortly after the data is recorded, the results of the
individual stations and the number of exceedances of      three pollutants particulate matter (PM10), nitrogen
the short-term limit6 and target values7 of the current   dioxide and ozone are available on UBA’s app
year and per month. The tables can be sorted and          Luftqualität. There are three different options to
downloaded.                                               visualize the air quality index and the measurements
                                                          of a certain monitoring station (Figure 19):
Annual tabulation: analysis of past years’ station
data in relation to limit and target values               ▸▸ Localization: display of the nearest monitoring
After the end of a year and when all measurement             station
data are finally quality checked, every station is        ▸▸ By touching the screen: selection of any monitor-
analysed on its compliance with the limit and target         ing station on a map of Germany
values for the protection of human health. The results    ▸▸ Free-text search function: search for certain
of these analyses can be displayed as a station list         locations/station names
for the past years. The station list can be sorted and
downloaded.                                               The classification of the monitoring station (urban,
                                                          rural, urban traffic, industrial) provides information
                                                          on the character of the surrounding area and on
                                                          the main emission sources close to the monitoring
                                                          station. Moreover, it allows conclusions about the
                                                          spatial representativeness of the monitoring station.
                                                          The background colour of the display, when choosing
                                                          a certain station, corresponds to the current AQI and
6   24-hour PM10 limit value, 8-hour ozone target value
7   one hour nitrogen dioxide limit value                 allows therefore a quick overview of the current air

Figure 19

left: overview on the monitoring stations in Berlin, middle: good air quality index at the station Berlin
Neukölln, right: free-text search for Berlin

                                                                                                                25
V Current air quality conditions throughout Germany Figure 20 left: detail view for Berlin Neukölln, middle: development of the AQI at the station Berlin Neukölln, right: health advices according to the current AQI Figure 21 left: favorite list, middle: daily status information and warning alerts for Berlin Frankfurter Allee, right: options for the map and legend for the AQI 26
V Current air quality conditions throughout Germany

Figure 22                                                  when air quality is poor at the stations in the
Morning status information on the AQI at the station       favourite list. Sensitive persons can choose to receive
Berlin Frankfurter Allee                                   warning alerts already when the AQI is moderate.

                                                           Future developments
                                                           In order to take user feedback into account and to
                                                           include new features the air quality app is continu-
                                                           ously being developed.

                                                           Next to a multitude of smaller adaptions, the new
                                                           version of the app will provide, next to the current
quality situation. The detail view (Figure 20) shows       and past air quality data, also ozone forecasts. If the
the course of the AQI and the measurements of the          forecasted concentrations are exceeding threshold
last 24 hours or any arbitrary day.                        values, warning alerts are sent.

Health-related advices can help to adapt outdoor           Furthermore, the app will be available for tablets.
activities according to an air quality situation. Please
note, that the advices and their area of application
depend on the station type and the measurements of
all three pollutants.

Favourite list and warning alerts
Any stations of interest can be added to a favourite
list (Figure 21). Users can choose to receive status
information (Figure 22) and hourly warning alerts

                                                                                                                  27
Further information on the topic Further information on the topic Current air quality data: https://www.umweltbundesamt.de/en/data/current-concentrations-of-air-pollutants-in-germany Air and air pollution control website: https://www.umweltbundesamt.de/en/topics/air UBA map service on air pollutants: http://gis.uba.de/Website/luft/index.html UBA map service on low emission zones and air quality plans: http://gis.uba.de/website/umweltzonen/index.html Development of air quality in Germany: http://www.umweltbundesamt.de/luft/entwicklung.htm Information on the air pollutant PM10: https://www.umweltbundesamt.de/en/topics/air/particulate-matter-pm10 Information on the air pollutant NO2: https://www.umweltbundesamt.de/en/topics/air/nitrogen-dioxide Information on the air pollutant ozone: https://www.umweltbundesamt.de/en/topics/air/ozone 39th Ordinance for the Implementation of the German Federal Imission Control Act (39th BImSchV): https://www.gesetze-im-internet.de/bimschv_39/ 28
background // january 2020
Air Quality 2019
Preliminary Evaluation                                     www.facebook.com/umweltbundesamt.de
                                                           www.twitter.com/umweltbundesamt
                             ▸O
                               ur brochures to download   www.youtube.com/user/umweltbundesamt
German Environment Agency

                              Short link: bit.ly/2dowYYI   www.instagram.com/umweltbundesamt/
You can also read