Company Report | Guinness Nigeria Plc - What the heck is wrong with GUINNESS?
←
→
Page content transcription
If your browser does not render page correctly, please read the page content below
Company Report | Guinness Nigeria Plc.
          …What the heck is wrong with GUINNESS?
Breweries I Company Report I November 2014
Target Price: N139.66 Revenue slid 6.1% again... what’s the hype about ‘Orijin’?
Rating: SELL Guinness Nig. Plc (GUINNESS) posted yet another disappointing quarterly result (2015:Q1),
as revenue shrank once again by 6.07% (NGN21.05bn vs.NGN22.41bn in the corresponding
period last year). Although we anticipated that the beer maker’s recent drive into the value
Relative Metrics segment (given the launch and subsequent market acceptance of the ‘Orijin’ brand) should
Current price 160.00 support performance going forward, the company’s recently released 3 months result
P/E 25.90
indicated otherwise. The disappointing performance scorecard is coming just after the beer
P/B 5.18
maker announced that Mr. John O'Keeffe will be taking over the headship of the company
Forward P/E 26.73x
52-Wk av. Vol (mn) 0.475
from Mr. Seni Adetu in November 2014.
Cost of sales declined 12.15% to NGN10.50bn (vs. 11.95bn in 2014Q1) thereby trimming
Fundamental Metrics down cost to sales margin to 49.89% from 53.33% in prior period. OPEX fell slightly by 1.34%
EPS (N) 6.19 while operating profit improved by 7.84% (NGN2.71bn vs. NGN2.51bn) in the quarter.
BVPS(N) 30.91 Finance charges, which rose 31.59% (NGN1.18bn vs. NGN2.51bn), remained a drag to
Net Margin 7.05% earnings.
ROAE 20.34%
ROAA 7.00% Although, Profit before tax (PBT) improved reasonably by 5.06%, profit after tax (PAT)
Leverage 2.88
contracted by 14.81%, due to higher tax expenses, slimming down to NGN1.49bn compared
Mkt. Cap (N’bn) 240.94
to NGN1.74bn in prior period.
Our analysis of Beer market trends in Nigeria linked this sustained performance drags to
Key Price Metrics extreme rivalry in the sector, likely market cannibalism, slowing premium brands growth
Today Return -0.01% and sustained soft discretionary spending.
WtD Return -0.37%
MtD Return -0.93% Updating our model in the realities of the above and adopting a blend of absolute and
QtD Return -25.57% relative valuation models, we downgrade our 12months target price for GUINNESS to
YtD Return -32.20 NGN139.66 (from previous NGN194.29), implying a 12.71% downside to current market
52-Week Return -31.33
price of NGN160. Hence, our rating on GUINNESS is downgraded to a SELL.
52-Week High 262.00
52-Week Low 160.00 52-Weeks Rebased Price Trajectory of Key Breweries Sector Stocks vs. NSEASI
Year High 239.95 1.70
Year Low 160.00
1.50 GUINNESS NB INTBREW NSEASI
Beta 0.97
14D-RSI 35.30 1.30
1.10
0.90
0.70
Analyst: Wale Olusi 0.50
olawaleolusi@meristemng.com Nov-13 Jan-14 Mar-14 May-14 Jul-14 Sep-14 Nov-14
Source: NSE
1|P a ge
Equity Research | www.meristemng.com | Nov. 2014Breweries I Company Report I November 2014
1.0 Recent Developments
What is wrong with GUINNESS?
GUINNESS is the second largest brewer in Nigeria listed on the Nigerian Stock
Exchange in 1965. The company’s operating history in the Nigerian Beer market
is over 5-decades. Over the years, the premium GUINNESS stout producer has
recorded impressive sales and distribution of its Guinness Stout and Harp Lager
beer brands in the Nigerian market, thus making Nigeria the largest market for
Guinness Stout in the world by Net Sales Value.
As against the above, GUINNESS’ recent number is fraught by performance drags.
Revenue has sustained consistent declines (-3.03%, -5.41%, -13.34%, -11.40%, -
10.83% and -6.05%) from Q4:2013 to Q1:2015 even as profit after tax continues
to bleed (dipped 3.53%, 22.16% 22.14%, 19.30% and 14.81% from Q1:2014 to
Q1:2015 in a row) due to higher financial charges, operating expenses and cost
disadvantages compared to major competitors.
Market survey suggests that a number of factors accounted for this sustained
lackluster performance. We highlight our findings below.
1. A More Complex and Competitive Operating Environment: Competition in
the Nigerian beer market is very keen at the moment. By our estimation,
HEINEKEN via its stake in Nigerian Breweries (NB), Consolidated Breweries
(CONSBREW) and Champion Breweries Plc. (CHAMPION) controls more than
70% of the space. GUINNESS has 26% market share while International
Breweries Plc. (INTBREW), controls 4%. But the ‘tug of war’ is between NB
and GUINNESS. NB (61% market share) is by far the market leader in the
space enjoying the best cost advantage, widest distribution network
(c.525,000 retail outlets) and brewing plants spread all over Nigeria. As a
result, NB has sustained a better Quarter on Quarter (Q-o-Q) performance
compared to GUINNESS.
2. The Consumer Rights Advocacy Network of Nigeria (CRANN) accused a
Dominant Brewery of Pirate Marketing: The rivalry in the space recently
brought about an alleged “De-marketing” of GUINNESS brands by a major
Brewery. Other terms used in some quarters include “Guerilla or Pirate-
marketing”. According to CRANN, distributors and bar owners are being
2|P a ge
Equity Research | www.meristemng.com | Nov. 2014Breweries I Company Report I November 2014
offered incentives to de-stock GUINNESS brands in Lagos, Port Harcourt,
Abuja, and Ibadan, and this has been ongoing for a while (more than a year).
As against the above, we see this as a likely incentive-based marketing
strategy on the part of the said ‘Dominant Brewery’ given the operating
environment.
3. Slowing Premium Segment Growth: Growth in the beer market has
maintained a slowing trend (3.00% and -3.00% in 2012 and 2013 vs. 9.00%
10 year average) in recent periods, but we note that the value (affordable)
brands are currently driving the sector’s performance. In contrast to
GUINNESS, NB (key competitor) had since tapped into this segment of the
market, even as other players such as CONSBREW and INTBREW who
already had a solid footing on the segment of the market, continue to raise
the bar further. GUINNESS, on its part, had concentrated on its premium
brands for too long until lately.
4. Slowing Discretionary Spending and GUINNESS’ Pricing Review: The
management of GUINNESS noted that pricing review in December 2013
accounted for its poor half year performance. Realizing the impact of this,
the company had since reverted this decision. However, we wonder why
such a counterproductive decision will be taken at a time when consumer
discretionary spending is slowing in the Country.
NGN52bn CAPEX and a Foray into the Value Segment
To gear up the company’s resolve to match the keen competition in the
industry, GUINNESS invested NGN52bn more than 2 years ago to expand its
operations and meet the need of its customers. The beer maker also took a
foray into the value segment of the market, launching a range of new brands
such as DUBIC EXTRA LAGER, SNAPP, ALVARO and the recently introduced
popular ORIJIN brand.
Exhibit2: Product portfolio
Source: Company’s filings
3|P a ge
Equity Research | www.meristemng.com | Nov. 2014Breweries I Company Report I November 2014
Although the introduction of ‘Orijin’ into the market appears to be a major
success, given the widespread acceptance that greeted the herbal-mixed
brand, we suspect that the brand may be taking the competition back home, a
sort of market cannibalism (by displacing some of its sister brands like
Smirnoff), as the most recent quarter result remained a decline despite the
hype.
Other strategic initiatives include ‘The made of more’ and ‘Made of Black’
promo targeted at selling the GUINNESS brand. However, keen competition in
the operating environment seem pretty complex as already cited above.
Adetu Bows Out, O’Keeffe Steps In
Following the sustained performance drag as highlighted above, GUINNESS has
announced that Mr. Seni Adetu, the current Managing Director (MD) of the
Company will be stepping down in November 2014, for Mr John O'Keeffe, who
is currently a Non-Executive Director (NED) to take over the leadership position.
According to the company’s website;
‘’Mr John O’Keeffe holds a Bachelor of Commerce degree from the
University College Cork, Ireland specializing in Economics & Marketing. He
joined Diageo Plc. in 1994 and he has held a number of leadership
responsibilities including Brand Manager, Diageo Ireland; New Product
Development Manager, Diageo Ireland; Guinness Brand Manager, Diageo
Ireland (based in Dublin); Marketing & Innovation Manager, Diageo
Jamaica; Marketing Director, Diageo Jamaica/Caribbean; Marketing
Director, Diageo Nordics; Commercial & Innovation Director, Diageo
Nordics; General Manager, Diageo Sweden & Finland; Managing Director
Diageo Russia & CIS markets (based in Moscow) and Managing Director
Diageo Russia & Eastern Europe. Mr O’Keefe is presently the Global
Category Director, Beer and Baileys for Diageo Plc. Mr O’Keeffe was
appointed to the Board as a Non-Executive Director on 9th February 2012’’.
We believe that the company opted for John O’Keeffe based on his wealth of
experience in Russia and Eastern Europe market, where he has led Diageo (the
parent company of GUINNESS) businesses successfully in a more complex and
highly competitive operating environment similar to that of Nigeria at the
moment. Although we imagine that Mr O’Keeffe will be coming with fresh
ideas and strategic initiatives to drive sales volume and attempt to expand
market share for GUINNESS, we do not see this translating into stronger
performance in the near term.
4|P a ge
Equity Research | www.meristemng.com | Nov. 2014Breweries I Company Report I November 2014
2.0 Ownership, Plants and Distribution Network
GUINNESS is a subsidiary of the Diageo Group (46% stake), the fourth largest
brewer in Africa and a world leading premium drinks producer with a broad-
based portfolio of spirits, beers and wines. Popular brands include Johnnie
Walker, Crown Royal, J&B, Windsor, Buchanan's and Bushmills whiskies,
Smirnoff, Ciroc and Ketel One vodkas, Baileys, Captain Morgan, Tanqueray and
Guinness. Guinness Nigeria remains Diageo’s largest market for the sale of the
GUINNESS stout brand.
Diageo therefore holds 46% stake in GUINNESS via Guinness Oversea Ltd. Other
major stakeholders include Atlantaf (8%) and the Nigerian public (46%).
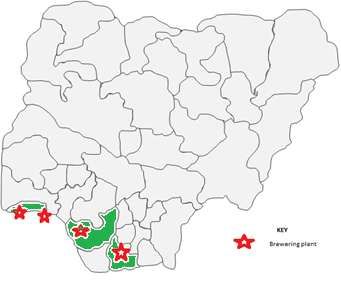
Exhibit3: Shareholding Structure Geographical Spread of GUINNESS Brewing
Plants
Atlantaf
8%
Guinness
Oversea Ltd
46%
Others
46%
Brewing Plants
Concentrated in
the South-West
Source: Company fillings
In terms of plant distribution, GUINNESS is the second biggest player in Nigeria
by installed capacity- with a total capacity of 5.5mhl, operated via its four
brewing plants, two in Lagos, and one in Benin and Aba each.
5|P a ge
Equity Research | www.meristemng.com | Nov. 2014Breweries I Company Report I November 2014
3.0 Industry Outlook and Competitive Dynamics
Industry growth outlook
Beer market growth has remained pressured by soft consumer spending,
worsening security challenges and competition from other beverages in the
sector (most especially spirit). Compared to a 10 years average growth of
(9.00%), sector growth slowed to 3% in 2012 and -3% in 2013.
Exhibit 4: Sector Turnover growth (2002-2013)
25%
20%
15%
10%
5%
0%
-5%
-10%
2002 2003 2004 2005 2006 2007 2008 2009 2010 2011 2012 2013
Source: Company fillings, Meristem research
Our X-ray of recent latest corporate releases buttress this further as NB posted a
9months Revenue growth of 2.33% (vs. >5.00% in September 2013), GUINNESS
dipped by 6.36% whilst INTBREW’s most recent filing indicated that sales
volume slowed to 6.36% compared to 3years average growth of 126.25%.
Heineken to Consolidate Operations of NB and CONSBREW
The Nigerian beer market remains dominated by global brewing giants.
Heineken controls the largest share, with interest in three key players (NB,
CONBREW and CHAMPION) in the space.
Exhibit 5: Beer Market share outlook
NB
4.30% 0.50% 62%+8%=70%
GUINNESS 7.80% NB’s MARKET SHARE
CONSBREW POST MERGER
25.30%
INTBREW
62.10%
CHAMPION
Source: Company fillings, Meristem research
6|P a ge
Equity Research | www.meristemng.com | Nov. 2014Breweries I Company Report I November 2014
In a bid to optimise its competitive dominance in Nigeria, the global brewing
giant has already notified the market of its intention to consolidate the
operation of NB and CONSBREW into one. At the completion of this merger, NB
is expected to control a total market share of 70%, whilst exercising dominance
in both the premium and value segment of the market.
Exhibit 6: Industry Competitive Standing
NB GUINNESS CONSBREW INTBREW CHAMPION
INSTALLED.
CAPACITY (mhl) 15.4 5.5 3.7 0.5 0.5
TURNOVER
(N’bn) 268.6 109.2 33.9 18.5 2.23
MARKET SHARE 62.10% 25.30% 7.80% 4.30% 0.50%
Source: Company fillings, Meristem research
Although, GUINNESS is the 2nd largest brewer in Nigeria by installed capacity
(5.5mhl) and revenue (NGN109bn), we believe that the presence of SABMILLER
in Nigeria, the second largest brewer in the world, via the acquisition of
INTBREW (4.30% Market share) and other non-quoted players such as Pabod
breweries, has raised the competitive landscape for GUINNESS in the value
segment.
4.0 Financial Analysis and Projections
Revenue, Cost and Earnings Projections
We reviewed our revenue projection for GUINNESS downward given the
keen competitive operating environment, the overall growth outlook for
the sector and the tempering discretionary spending. As stated above,
although we anticipate that the management of the company under the
new leadership of Mr O’keeffe will roll out strategies to drive volume and
play catch-up with competition, we do not see this impacting top-line
significantly in the near term. Consequent on this, we project the beer
maker to expand turnover marginally by 0.91% by full year.
7|P a ge
Equity Research | www.meristemng.com | Nov. 2014Breweries I Company Report I November 2014
We expect cost of sales to stay steady at a cost to sales ratio of 52%-53%, given
historical average and barring any major shock on the global price of Barley and
Sorghum in the commodities market. But, we think OPEX margin may be
pressured up, as new management intensifies effort to increase market share
and stay competitive.
Consequent on the above, we imagine that profit may decline further in 2015
but moderate into the medium to longer term. Hence, we forecast 2015FY PAT
to peg at NGN9.012bn representing a growth of -5.86%, compared to
NGN9.57bn in 2014FY.
Exhibit 7: Financial Highlights (Top-line and Bottom-line Performance and Expectation)
Profit after taxation (PAT) Growth
Turnover Growth 16.00 10%
Billions
125 9%
Billions
14.00 5%
120 5% 12.00
0%
10.00
115 1% -5%
8.00
-10%
6.00
110 -3%
-15%
4.00
105 -7% 2.00 -20%
0.00 -25%
100 -11% 2012 2013 2014 2015f 2016f 2017f
2012 2013 2014 2015f 2016f 2017f
Source: Company fillings, Meristem research
Valuation
We adopted a blend of dividend discount model (DDM) and price multiples to estimate
the fair price of GUINNESS. Our valuation assumptions are based on our reviewed
turnover growth expectation of 0.91%, 1.50% and 2.50% for 2015FY, 2016FY and 2017FY
as stated above. We also reviewed our dividend payout expectation downward to 50%
as against 5-years historical average of 80%.
Given the above, we downgrade our full year target price (TP) for GUINNESS to
NGN139.66 from previous NGN194.29. Compared to current market price of
NGN160/share, this translates to -12.71% downside potential, hence we rate GUINNESS
a SELL at current price.
8|P a ge
Equity Research | www.meristemng.com | Nov. 2014Breweries I Company Report I November 2014
Appendices
Exhibit 8: Financial Highlights ( Historical and Forecast 2012 to 2017f)
GUINNESS
Exhibit 7:NIGERIA PLC Highlights
Financial 2012
( Historical 2013 2012 to 2014
+ Forecast) 2017 2015f 2016f 2017f
Key Headlines FORECAST HORIZON
Turnover 116,461,882 122,463,538 109,202,120 110,195,859 111,848,797 114,645,017
Gross profit 55,183,201 56,078,434 51,333,214 51,792,054 52,568,935 53,997,803
EBITDA 31,388,469 29,155,359 30,609,393 26,098,553 26,358,850 26,508,165
Operating Profit (EBIT) 21,895,799 20,614,339 16,123,378 16,008,477 16,721,395 17,499,925
Profit before Tax 20,383,158 17,008,875 11,681,560 13,253,580 13,925,175 14,633,800
Profit After Tax 14,214,620 11,863,726 9,573,480 9,012,434 9,469,119 9,950,984
Non-current Asset 77,231,484 88,822,002 91,488,232 96,203,585 91,038,573 91,240,881
Total Asset 106,009,667 121,060,621 132,328,273 129,642,187 127,100,906 127,383,352
Net Asset 38,611,514 46,039,111 45,061,717 49,567,934 54,302,494 58,780,436
Cost to Sales Ratio 52.62% 54.21% 52.99% 53.00% 53.00% 52.90%
Gross Profit Margin 47.38% 45.79% 47.01% 47.00% 47.00% 47.10%
OPEX Margin 29.22% 29.62% 32.92% 33.17% 32.75% 32.56%
ROAE 36.03% 28.03% 21.02% 19.05% 18.23% 17.60%
ROAA 14.34% 10.45% 7.56% 6.88% 7.38% 7.82%
Current Ratio (x) 0.64 0.63 0.92 1.33 1.20 1.45
Quick Ratio (x) 0.53 0.57 0.78 0.96 0.86 1.06
Cash ratio (x) 0.11 0.06 0.14 0.37 0.34 0.39
Inventory turnover (x) 4.00 5.19 4.47 2.88 2.21 2.28
Du-Pont Analysis
ROE 36.81% 25.77% 21.25% 18.18% 17.44% 16.93%
Net Margin 12.21% 9.69% 8.77% 8.18% 8.47% 8.68%
Asset Turnover (x) 1.10 1.01 0.83 0.85 0.88 0.90
Leverage (x) 2.75 2.63 2.94 2.62 2.34 2.17
EBITDA Margin 26.95% 23.81% 28.03% 23.68% 23.57% 23.12%
Operating profit (EBIT) margin 18.80% 16.83% 14.76% 14.53% 14.95% 15.26%
Interest burden 0.93 0.83 0.72 0.83 0.83 0.84
Interest Coverage (X) 46.98 10.46 5.42 3.63 4.84 4.98
Tax burden 0.70 0.70 0.82 0.68 0.68 0.68
Interest coverage 10.46 5.42 3.63 4.84 4.98 5.09
Source: Company fillings, Meristem research
9|P a ge
Equity Research | www.meristemng.com | Nov. 2014Breweries I Company Report I November 2014
Analyst’s Certification and Disclaimer
This research report has been prepared by the research analyst(s), whose name(s) appear(s) on the cover of this report. Each
research analyst hereby certifies, with respect to each security or issuer covers in this research that:
(1) all of the views expressed in this report accurately reflect his or her personal views about any and all of the subject
securities or issuers (the Issuer); and
(2) no part of any of the research analyst’s compensation was, is, or will be directly or indirectly related to the specific
recommendations or views expressed by the research analyst(s) in this report. Research analysts’ compensation is determined
based upon activities and services intended to benefit the investor clients of Meristem Securities Limited (the Firm). Like all
of the Firm’s employees, research analysts receive compensation that is impacted by overall Firm profitability, which
includes revenues from other business units within the Firm.
(3) each research analyst and/or persons connected with any research analyst may have interacted with sales and trading
personnel, or similar, for the purpose of gathering, synthesizing and interpreting non-material non-public or material public
market information.
As at the date of this report, any ratings, forecasts, estimates, opinions or views herein constitute a judgment, and are not
connected to research analysts’ compensations. In the case of non-currency of the date of this report, the views and contents
may not reflect the research analysts’ current thinking. This document has been produced independently of the Issuer. While
all reasonable care has been taken to ensure that the facts stated herein are accurate and that the ratings, forecasts, estimates,
opinions and views contained herein are fair and reasonable, neither the research analysts, the Issuer, nor any of its direct ors,
officers or employees, shall be in any way responsible for the contents hereof, and no reliance should be placed on the
accuracy, fairness or completeness of the information contained in this document. No person accepts any liability whatsoever
for any loss howsoever arising from any use of this document or its contents or otherwise arising in connection therewith.
Analysts’ Compensation: The equity research analysts responsible for the preparation of this report receive compensation
based upon various factors, including the quality and accuracy of research, client feedback, competitive factors, and overall
firm revenues, which include revenues from, among other business units, Investment Banking.
Investment Ratings
Fair Value Estimate
We estimate stock’s fair value by computing a weighted average of projected prices derived from discounted cash flow and
relative valuation methodologies. The choice of relative valuation methodology (ies) usually depends on the firm’s peculiar
business model and what in the opinion of our analyst is considered as a key driver of the stock’s value from a firm specific
as well as an industry perspective. However, we attach the most weight to discounted cash flow valuation methodology.
Ratings Specification
BUY: Fair value of the stock is above the current market price by at least 20 percent
HOLD: Fair value of the stock ranges between -10 percent and 20 percent from the current market price.
SELL: Fair value of the stock is more than 10 percent below the current market price.
Definitions
Price Targets: Price targets reflect in part the analyst’s estimates for the company’s earnings. The achievement of any price
target may be impeded by general market and macroeconomic trends, and by other risks related to the company or market,
and may not occur if the company’s earnings fall short of estimates.
Asset allocation: The recommended weighting for equities, cash and fixed income instrument is based on a number of
metrics and does not relate to a particular size change in one variable.
10 | P a g e
Equity Research | www.meristemng.com | Nov. 2014Breweries I Company Report I November 2014
Movements in Price Target
Company Name: Guinness Nig. Plc.
Previous NewTarget Previous New
Date Price (N) Target Price(N) Price (N) Recommendation Recommendation
10/11/14 160.19 194.29 134.66 “HOLD” “SELL”
Company disclosures
Meristem or the analyst(s) responsible for the coverage may have financial or beneficial interest in securities or related
investments discussed in this report, which could, unintentionally, affect the objectivity of this report. Material interests,
which Meristem or the analyst(s) have with companies or in securities discussed in this report, are disclosed below:
Company Disclosure
GUINNESS NIG. Plc.
a. The analyst(s) hold(s) personal positions (directly or indirectly) in a class of the common equity securities of the
company.
b. The analyst responsible for this report, as indicated on the front page, is a board member, officer or director of the
company
c. Meristem beneficially owns 1% or more of the equity securities of the company
d. Meristem has been the lead manager or co-lead manager of any publicly disclosed offer of securities of the company
over the past 12 months.
e. Meristem beneficially holds a major interest in the debt of the company
f. Meristem has received compensation for investment banking activities from the company within the last 12 months
g. Meristem intends to seek, or anticipates receipt of compensation for investment banking services from the company in
the next 3 months
h. The content of this research report has been communicated with the company, following which this research has been
materially amended before its distribution
i. The company is a client of the stock broking division of the Meristem group.
j. The company is a client of the investment banking division of the Meristem group.
k. The company owns more than 5% of the issued share capital of Meristem
l. Meristem has other financial or other material interest in the company.
11 | P a g e
Equity Research | www.meristemng.com | Nov. 2014Breweries I Company Report I November 2014
Conflict of Interest
It is the policy of Meristem Securities Limited and its subsidiaries and affiliates (Individually and collectively referred t o as
“Meristem”) that research analysts may not be involved in activities that suggest that they are representing the interests of
Meristem in a way likely to appear to be inconsistent with providing independent investment research. In addition, research
analysts’ reporting lines are structured so as to avoid any conflict of interests.
For example, research analysts are not subject to the supervision or control of anyone in Meristem’s Investment Banking or
Sales and trading departments. However, such sales and trading departments may trade, as principal, on the basis of the
research analysts’ published research. Therefore, the proprietary interests of those Sales and Trading departments may
conflict with your interests.
Important Disclosure
For U.S. persons only: This research report is a product of Meristem Securities, which is the employer of the research
analysts who has prepared the research report. The research analysts preparing the research report are resident outside the
United States (U.S.) and are not associated persons of any U.S. regulated broker-dealer and therefore the analysts are not
subject to supervision by a U.S. broker-dealer, and are not required to satisfy the regulatory licensing requirements of FINRA
or required to otherwise comply with U.S. rules or regulations regarding, among other things, communications with a subject
company, public appearances and trading securities held by a research analyst account.
This report is intended for distribution by Meristem Securities only to "Major Institutional Investors" as defined by Rule 15a-
6(b)(4) of the U.S. Securities and Exchange Act, 1934 (the Exchange Act) and interpretations thereof by U.S. Securities and
Exchange Commission (SEC) in reliance on Rule 15a 6(a)(2). If the recipient of this report is not a Major Institutional
Investor as specified above, then it should not act upon this report and return the same to the sender. Further, this report may
not be copied, duplicated and/or transmitted onward to any U.S. person, which is not the Major Institutional Investor.
In reliance on the exemption from registration provided by Rule 15a-6 of the Exchange Act and interpretations thereof by the
SEC in order to conduct certain business with Major Institutional Investors, Meristem Securities has entered into an
agreement with a U.S. registered broker-dealer, Marco Polo Securities Inc. ("Marco Polo").
Transactions in securities discussed in this research report should be effected through Marco Polo or another U.S. registered
broker dealer.
Legal entity disclosures
Meristem Securities Limited is a member of The Nigerian Stock Exchange and is authorized and regulated by the Securities
and Exchange Commission to conduct investment banking and financial advisory business in Nigeria. However, the
company through its subsidiaries carries out stock broking, wealth management, trustees and registrars businesses which are
regulated by the SEC and ICMR.
12 | P a g e
Equity Research | www.meristemng.com | Nov. 2014Breweries I Company Report I November 2014
Contact Information
Brokerage Services
gbadunolasokunbi@meristemng.com (+234 803 361 6176)
www.meristemng.com
Investment Banking/Corporate Finance
adejumokeawolumate@meristemng.com (+234 806 273 2560)
seunlijofi@meristemng.com (+234 808 536 5766)
Wealth Management
sulaimanadedokun@meristemwealth.com (+234 803 301 3331)
damilolahassan@meristemng.com (+234 803 613 9123)
www.meristemwealth.com
Tel:+234 01 738 9948
Registrars
muboolasoko@meristemregistrars.com (+234 803 324 7996)
www.meristemregistrars.com
Tel: +234 01-280 9250
Trustees
yinkaadegbola@meristemng.com (+234 0803 717 9556)
Tel: +234 01 448 5990
Client Services
tounomonaiye@meristemng.com (+234 805 846 0048)
Investment Research
Saheedbashir@mersitemng.com (+234 802 454 6575)
kemiakinde@meristemng.com (+234 809 183 9487)
E-mail: research@meristemng.com
Tel: +234 01 295 3135
Corporate websites: www.meristemng.com www.meristemwealth.com www.meristemregistrars.com
Meristem Research can also be accessed on the following platforms:
Meristem Research portal: meristem.com.ng/rhub
Bloomberg: MERI
Capital IQ: www.capitaliq.com Reuters: www.thomsonreuters.com
ISI Emerging Markets: www.securities.com/ch.html?pc=NG FactSet: www.factset.com
13 | P a g e
Equity Research | www.meristemng.com | Nov. 2014You can also read