International Migration in Northern Ireland: an Update - The Northern ...
←
→
Page content transcription
If your browser does not render page correctly, please read the page content below
Research and Information Service
                           Research Paper

                                                       24 June 2016

                                                 Dr Raymond Russell

          International Migration in Northern
                   Ireland: an Update
                                                         NIAR 35-15

          Around 175,000 long-term international migrants are estimated to have arrived in
          Northern Ireland between 2000 and 2014. This paper, which contains recent statistics
          from the Northern Ireland Statistics and Research Agency (NISRA), updates a previous
          paper (February 2012) and describes the key elements of this remarkable demographic
          change.

      Paper 39/16                                                                                              24 June 2016

   Research and Information Service briefings are compiled for the benefit of MLAs and their support staff. Authors are available to
discuss the contents of these papers with Members and their staff but cannot advise members of the general public. We do, however,
        welcome written evidence that relates to our papers and this should be sent to the Research and Information Service,
       Northern Ireland Assembly, Room 139, Parliament Buildings, Belfast BT4 3XX or e-mailed to RLS@niassembly.gov.uk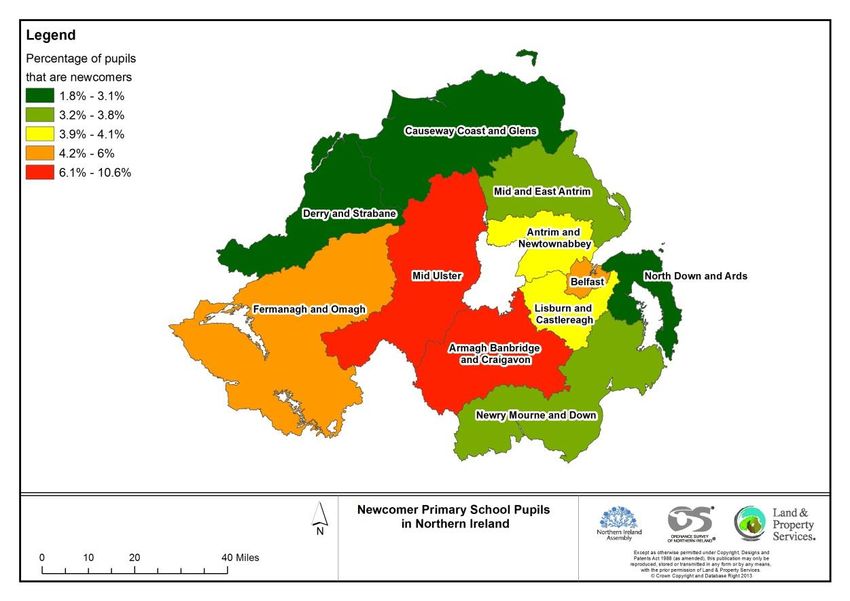
NIAR 35-15 Research Paper
Key Points
For many decades Northern Ireland was a net exporter of people. From 1871
right through to 1990, the number of people leaving Northern Ireland far
exceeded those who came here to live. In fact, an estimated net total of just
under one million people left Northern Ireland during this period.
Between 2000 and 2014, an estimated 175,000 long-term international migrants
came to Northern Ireland, while 143,000 left, leaving a net total of 32,000. Local
government districts in the west and south-west of Northern Ireland saw the
largest net inflow of new residents, in particular: Mid Ulster (9,800), Armagh,
Banbridge and Craigavon (9,300) and Newry, Mourne and Down (6,000).
In 2013-14 Northern Ireland had the lowest international migration rate of any
UK region. This compares with the peak year of 2006-7, when Northern Ireland
had the highest migration rate (5.2 per 1,000 population) in the UK.
Poland continues to be the most popular country of origin for international
migrants coming to live in Northern Ireland. During 2014 and 2015, however,
migration from Romania rose substantially, albeit from a low baseline.
Around 1,000 members of the Roma community, mostly from Romania, are
thought to be living in Northern Ireland, mainly in South Belfast.
International migration impacts upon the host community in a myriad number of
ways, including maternity services, school enrolments, social housing, health
and social care, and hate crime.
Births to mothers born outside the UK and Ireland now account for over 10 per
cent of all births in Northern Ireland each year. In 2014, 18 per cent of all births
in the Mid Ulster local government district were to non-UK and Ireland mothers,
followed by Armagh, Banbridge and Craigavon (15%), Belfast (15%),
Fermanagh and Omagh (14%) and Newry, Mourne and Down (14%).
The number of newcomer pupils in Northern Ireland has risen by almost three-
quarters (73.9%), from 6,795 in 2008 to 11,815 by 2014
Between 2006 and 2014, an estimated 11,700 migrant households applied for
social housing, of whom 2,000 were successful.
Figures from the Regional Interpreting Service show that just under half a
million requests (493,660) for interpreters were made between January 2004
and December 2014.
Hate crime incidents and offences with a racial motive increased substantially
between 2011 and 2014.
Northern Ireland Assembly, Research and Information Service 3NIAR 35-15 Research Paper
There are many positive aspects of migration. For example, it is argued that
migration contributes to economic growth, fills labour shortages, brings much
needed skills, and enriches our society through cultural diversity.
Northern Ireland Assembly, Research and Information Service 4NIAR 35-15 Research Paper
Contents
1 Introduction ..................................................................................................................... 7
2 Historical Migration Patterns, 1871 - 2014 ....................................................................... 7
3 Estimating Long-term International Migration .................................................................. 8
4 Long-term International Migration, 2000 – 2014 .............................................................. 8
4.1 International Migration by Local Government District (LGD 2014) ........................ 10
4.2 International Migration: Regional Comparison ...................................................... 11
4.3 International Migration: Countries of Origin ........................................................... 12
4.4 The Roma ............................................................................................................ 14
5 Impact of long-term International Migration .................................................................... 15
5.1 Births to Non-UK Mothers ..................................................................................... 15
5.2 Newcomer Pupils ................................................................................................. 17
5.3 Social Housing ..................................................................................................... 19
5.4 Health and Social Care: Interpreter Services ........................................................ 21
5.5 Hate Crime ........................................................................................................... 22
5.6 Economic Benefits of Migration: a Brief Note ........................................................ 23
6 Future Trends in International Migration ........................................................................ 24
Northern Ireland Assembly, Research and Information Service 5NIAR 35-15 Research Paper
1 Introduction
Since the year 2000, Northern Ireland has witnessed an unprecedented wave of
international migration mainly, but not exclusively, from central and eastern Europe.
Between 2000 and 2014, almost 175,000 long-term international migrants are
estimated to have arrived in Northern Ireland. In the process, Northern Ireland has
moved from a position of net migration loss to one of annual population gain.
This paper updates a previous paper (NIAR 10-12) and contains the most recent
statistics on migration.
2 Historical Migration Patterns, 1871 - 2014
While this Paper is primarily focused on international migration, it may be helpful to
begin by providing a brief overview of migration patterns in general. Chart 2.1 shows
net migration (the difference between outflows and inflows) for the entire period, 1871 –
2014. In this instance, migration includes both international migration (between
Northern Ireland and countries outside the UK), and flows between Northern Ireland
and othe parts of the UK.
20,000 Chart 2.1 Net Migration, 1871 - 2014
0
-20,000
Net Migration (incling UK)
-40,000
-60,000
-80,000
-100,000
-120,000
-140,000
-160,000
-180,000
1977/78
1993/94
2009/10
1911-1926
1871-1881
1891-1901
1937-1951
1961-1966
1967/68
1969/70
1971/72
1973/74
1975/76
1979/80
1981/82
1983/84
1985/86
1987/88
1989/90
1991/92
1995/96
1997/98
1999/00
2001/02
2003/04
2005/06
2007/08
2011/12
2013/14
Intercensual Period, 1871-2014
Source: NISRA (2015) Historical Migration, 1871-2014
Northern Ireland Assembly, Research and Information Service 7NIAR 35-15 Research Paper
The chart clearly shows that for many decades Northern Ireland was a net exporter of
people. From 1871 right through to 1990, the number of people leaving Northern
Ireland far exceeded those who came here to live. In fact, an estimated net total of just
under one million people left Northern Ireland during this period 1. Net migration then
moved into positive territory for a brief period (1990-1993), before resuming its negative
trend until the millennium. Between 2001 and 2008, the trend was generally positive,
with more people coming here to live than leaving. Migration again moved into
negative territory in the period 2009 – 2013, before another upturn in 2014.
3 Estimating Long-term International Migration
Long-term International migration refers to the number of people leaving or arriving to
live in Northern Ireland to and from areas outside the UK, for a period of at least twelve
months. Net international migration is the difference between outflows from Northern
Ireland and inflows to Northern Ireland. Migration estimates are calculated from mid-
year to mid-year (e.g. the most recent migration estimates occurred between July 2013
and June 2014). There are no estimates for short-term / temporary migration.
Migration is the most difficult component of population change to measure, as unlike
births and deaths, there is no complete system for registering migration. In Northern
Ireland, migration is estimated using Medical Card registrations and de-registrations
supplied by the Business Service Organisation (BSO). It is recognised that the medical
card method is deficient in recording young adult males, as well as the significant
proportion of migrants who return to their county of origin without de-registering. The
data is therefore upscaled and weighted to take account of these factors. NISRA is
content that their methods yield robust and accurate estimates 2.
NISRA also use other administrative data sources to validate and supplement the
medical card data, such as applications for National Insurance number (NINOs), and
data from the School Census, Health and Social Care Trusts, the Northern Ireland
Housing Executive, and birth registrations.
4 Long-term International Migration, 2000 – 2014
Table 4.1 and Fig 4.1 (overleaf) present estimates for net international migration during
the period 2000 – 2014. On 1 May 2004, eight central and eastern European countries
(the “A8”) joined the EU. Twelve of the EU-15 Member States imposed labour market
restrictions on A8 nationals, the exceptions being the UK, Ireland and Sweden. With
1
NISRA (2015) Historical Migration, 1871 to 2014. Available at:
http://www.nisra.gov.uk/archive/demography/population/midyear/Migration_(1871_to_2014).xls
2
NISRA (2015) Statistical Bulletin: Long-term International Migration Statistics for Northern Ireland (2014).
Available at: http://www.nisra.gov.uk/archive/demography/population/migration/Mig1314-Bulletin.pdf
Northern Ireland Assembly, Research and Information Service 8NIAR 35-15 Research Paper
comparatively free access to the labour market, citizens from the A8 countries began to
arrive in the UK and Ireland in large numbers 3.
Table 4.1 Estimated Net International Migration, 2000 - 2014
Estimated
Estimated Estimated Net
International International International
Time-period Inflows Outflows Migration
Jul 2000 - Jun 2001 6,524 7,609 -1,085
Jul 2001 - Jun 2002 6,488 6,393 95
Jul 2002 - Jun 2003 6,810 6,683 127
Jul 2003 - Jun 2004 8,174 6,996 1,178
Jul 2004 - Jun 2005 12,544 8,861 3,683
Jul 2005 - Jun 2006 15,803 8,797 7,006
Jul 2006 - Jun 2007 19,773 10,633 9,140
Jul 2007 - Jun 2008 18,261 11,981 6,280
Jul 2008 - Jun 2009 14,404 11,406 2,998
Jul 2009 - Jun 2010 13,877 12,115 1,762
Jul 2010 - Jun 2011 13,401 14,097 -696
Jul 2011 - Jun 2012 12,922 12,480 442
Jul 2012 - Jun 2013 12,736 13,623 -887
Jul 2013 - Jun 2014 13,300 11,063 2,237
Total 175,017 142,737 32,280
Source: NISRA (2015) Migration by additional breakdowns, 2013-14, Table 3.1
Fig 4.1 Estimated Net International Migration, 2000 - 2014
10,000
Estimated Net International Migration
8,000
6,000
4,000
2,000
0
2013 - 14
2000 - 01
2001 - 02
2002 - 03
2003 - 04
2004 - 05
2005 - 06
2006 - 07
2007 - 08
2008 - 09
2009 - 10
2010 - 11
2011 - 12
2012 - 13
-2,000
Time Period
3
The A8 countries include Czech Republic, Estonia, Hungary, Latvia, Lithuania, Poland, Slovakia and Slovenia.
Northern Ireland Assembly, Research and Information Service 9NIAR 35-15 Research Paper
International migration flows peaked in 2006-07, when a total of 19,800 people came to
live in Northern Ireland from outside the UK, while 10,600 left to live abroad, leaving a
net inflow of 9,100 people. With the onset of the global financial crisis in 2008,
migration flows began to decline and level off. After a net loss of international migrants
in 2012-13, when more people left Northern Ireland than came to live here, net
migration moved into positive territory again in 2013-14, with a net increase of 2,200
people. This represents a substantial change from 2012-13, when 900 more people
left Northern Ireland to live abroad, than entered Northern Ireland from outside the UK.
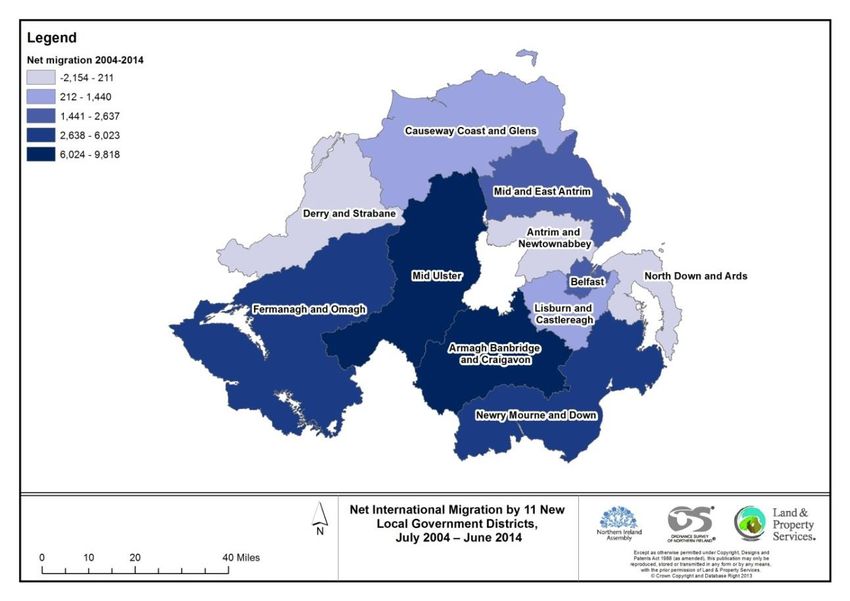
4.1 International Migration by Local Government District (LGD 2014)
Table 4.2 and Map 4.1 (overleaf) show net international migration in the elven new
local government districts (LGDs) during the period 2004 – 2014 4.
Table 4.2 Net International Migration (rounded) by LGD, 2004 – 2014
Total Net Migration,
LGD 2014 2004 – 14
Mid Ulster 9,800
Armagh, Banbridge & Craigavon 9,300
Newry, Mourne & Down 6,000
Fermanagh & Omagh 3,300
Mid & East Antrim 2,600
Belfast 1,500
Lisburn & Castlereagh 1,400
Causeway Coast & Glens 320
North Down & Ards 200
Antrim & Newtownabbey -350
Derry & Strabane -2,200
Northern Ireland 32,000
Source: NISRA (2015) Migration by additional breakdowns.
Overall, there was a net inflow of 32,000 international migrants to Northern Ireland over
the ten-year period. Local government districts in the west and south-west of Northern
Ireland saw the largest inflow of new residents, in particular: Mid Ulster (9,800),
Armagh, Banbridge and Craigavon (9,300) and Newry, Mourne and Down (6,000).
4
NISRA (2015) Migration by additional breakdowns, Table 3.2. Available at:
http://www.nisra.gov.uk/archive/demography/population/midyear/Net_Mig_1314.xls
Northern Ireland Assembly, Research and Information Service 10NIAR 35-15 Research Paper
Two council areas experienced a net outflow, namely, Antrim and Newtownabbey (-
350) and Derry and Strabane (-2,200).
Map 4.1 Net International Migration (rounded) by LGD, 2004 – 2014
4.2 International Migration: Regional Comparison
Table 4.3 presents a regional comparison for net international migration (per 1,000
population) in the four UK nations and the Republic of Ireland during 2013-14.
Table 4.3 Net International Migration in 2013-14 per 1,000 population, UK Nations
and Ireland
Migrants per
Country 1,000 pop.
England 4.5
Wales 1.9
Scotland 1.5
Northern Ireland 1.2
Republic of Ireland - 4.6
Source: NISRA (2015) Net international migration in UK countries
Northern Ireland Assembly, Research and Information Service 11NIAR 35-15 Research Paper
The table shows that, proportionately, Northern Ireland had the lowest international
migration rate of the UK nations in 2013-14, at 1.2 persons per 1,000 population,
compared with England (4.5), Wales (1.9) and Scotland (1.5). This compares with the
peak year of 2006-7, when Northern Ireland had the highest migration rate (5.2) in the
UK. In the Republic of Ireland, there was a net outflow of 4.6 per 1,000 population in
2013-14. Again, this compares with the Celtic Tiger period (2003 – 08) when migration
averaged around 15.0 per 1,000 population. Net international migration peaked in the
Republic of Ireland in 2006 – 07 with a figure of 24.8 per 1,000 population.
4.3 International Migration: Countries of Origin
Data from Census 2011, plus various administrative sources, indicate that Poland has
been, and continues to be, the top country of origin for international migrants coming to
live in Northern Ireland (Table 4.4).
More recent trends suggest that Northern Ireland is becoming an increasingly popular
destination for migrants from Romania. On 1 January 2014, a change came into effect
which gave Romanian and Bulgarian nationals the same rights to live and work in the
UK as other EEA nationals. Analysis of medical card registrations show a significant
rise in the number of registrations by Romanian nationals (and a modest increase for
Bulgarians) in 2014 and the first half of 2015 (Table 4.5)
Table 4.4 Top 10 Countries of Origin, Census 2011
Country of Origin Count
Poland 19,658
Lithuania 7,341
India 4,796
USA 4,251
Germany 3,908
Philippines 2,947
Slovakia 2,681
Canada 2,323
Latvia 2,297
China 2,223
Source: NISRA (2013) Census of Population 2011, Table QS208NI
Northern Ireland Assembly, Research and Information Service 12NIAR 35-15 Research Paper
Table 4.5 Medical Card Applications by Romanian and Bulgarian Nationals,
2005-15
Jan –
June
2005 2006 2007 2008 2009 2010 2011 2012 2013 2014 2015
Romania 108 81 104 109 137 253 297 178 205 1,407 680
Bulgaria 30 36 69 100 177 162 111 95 105 413 193
Source: NISRA (2015) Medical Card applications, BSO, 2005-15
Table 4.6 contains an analysis of medical card data, and shows the top three countries
of origin for migrants coming to Northern Ireland in 2014 by local government district
(LGD). Romania was the top country of origin for new medical card registrations in
Belfast LGD, as well as being in the top three of several other Districts. This marks the
first year since records began (2006) that Romania has been a top country in any of
the LGDs. Poland appears in the top three of each of the 11 LGDs 5.
Table 4.6 Medical Card Registrations in NI: Top 3 countries by LGD, Jan – Dec
2014
LGD First Second Third
Antrim & Newtownabbey Poland China Romania
Armagh, Banbridge & Craigavon Poland Portugal Lithuania
Belfast Romania Poland Irish Republic
Causeway Coast & Glens Poland Irish Republic France
Derry & Strabane Irish Republic Poland USA
Fermanagh & Omagh Irish Republic Poland Hungary
Lisburn & Castlereagh Poland Irish Republic Romania
Mid & East Antrim Poland Romania Slovakia
Mid Ulster Lithuania Poland East Timor
Newry, Mourne & Down Irish Republic Poland Bulgaria
North Down & Ards Irish Republic Lithuania Poland
Northern Ireland Poland Irish Republic Romania
Source: NISRA (2015) International In-Migration statistics, 2014
5
NISRA (2015) Statistical Bulletin: Long-term International Migration Statistics for Northern Ireland (2014).
Available at: http://www.nisra.gov.uk/archive/demography/population/migration/Mig1314-Bulletin.pdf
Northern Ireland Assembly, Research and Information Service 13NIAR 35-15 Research Paper
The increase in Romanian nationals coming to Northern Ireland is also confirmed by
figures from the Department of Work and Pensions (DWP) relating to National
Insurance Number (NINO) applications. NINO applications from Romanians coming to
Northern Ireland rose from 270 in 2012-13 to 2,420 in 2014-15 6.
4.4 The Roma
An unspecified proportion of Romanian nationals in Northern Ireland belong to the
Roma community. Precise estimates for the number of Roma do not exist 7, but it is
thought that around 1,000 Roma are presently living in various parts of Northern
Ireland, particularly South and East Belfast 8.
Roma are the largest ethnic minority group in Europe: their actual number is uncertain,
but the European Commission estimate it at between 10-12 million 9. According to
Fremlova and Amstead (2011), a number of Roma from Eastern Europe, particularly
from the Czech Republic, Poland, Romania, and Slovakia, initially came to the UK in
1990s seeking asylum to escape persecution and discrimination in their countries of
origin 1011. With the enlargement of the EU between 2004 and 2007, growing numbers
of Roma exercised their right to free movement, and came to live in the UK, including
Northern Ireland. Many settled in the Botanic – Lower Ormeau 12 areas of South
Belfast.
The Roma are generally employed in the informal sector, selling copies of the Big
Issue, local newspapers, flowers, or working as car wash attendants in sites across
Belfast. A recent EU survey of 11 Member States found that Roma households are
much more likely to be at risk of extreme poverty than non-Roma residents. For
example, in Romania and Hungary around 90 per cent of Roma live in households
6
NISRA (2015) NINO applications by Nationality, April 2009 to March 2015. Available at:
http://www.nisra.gov.uk/archive/demography/population/migration/Mig1314-In.xls
7
Census 2011 did not contain a category for the Roma, who often prefer to remain invisible to the authorities,
mainly due to centuries of persecution in their countries of origin in Central and Eastern Europe.
8
Educations Support for Northern Ireland (2014) Roma – Information for Schools. Available at:
http://www.education-support.org.uk/teachers/ids/roma/
9
EU Agency for Fundamental Rights (2012) The Situation of Roma in 11 EU Member States. Available at:
http://fra.europa.eu/sites/default/files/fra_uploads/2099-FRA-2012-Roma-at-a-glance_EN.pdf
10
Fremlova, L. and Anstead, A. (2011) Discrimination as standard. Runnymede Bulletin, Winter 2010-11, Issue
364, pp. 18-19. Available at: http://equality.uk.com/Roma_files/Discrimination as standard.pdf
11
Between 1942 and 1944, hundreds of thousands of Roma were transported by the Nazis across Europe to
extermination camps in Poland and murdered. In a resolution of 15 April 2015, the European Parliament
officially recognised 2nd August each year as Roma Holocaust Memorial Day (see European Commission
Statement, 15/5444 http://europa.eu/rapid/press-release_STATEMENT-15-5444_en.pdf )
12 Education Support for Northern Ireland (2014) Roma – Information for Schools. Available at:
http://www.education-support.org.uk/teachers/ids/roma/
Northern Ireland Assembly, Research and Information Service 14NIAR 35-15 Research Paper
affected by severe material deprivation 13. Another survey, this time conducted in
England, found that 97 per cent of Roma respondents claimed their lives had improved
since coming to England 14. A remarkable statistic, given their present precarious
circumstances, and one which serves to highlight just how difficult their lives must have
been in their countries of origin.
A small, but growing number of Roma pupils are now attending schools in Northern
Ireland, the majority (76%) in Belfast. According to the latest School Census the
number has risen from 30 in 2009-10 to 230 by 2014-15 15. One hundred and thirty two
children are attending primary school, while the remainder (73) are enrolled in post-
primary education 16.
5 Impact of long-term International Migration
International migration influences the host community in a myriad number of ways. The
following section examines some of the most significant impacts, including maternity
services, school enrolments, social housing, health and social care, and hate crime.
5.1 Births to Non-UK Mothers
Birth statistics clearly show the impact of migration. Table 5.1 presents statistics on
births in Northern Ireland by the country of birth of the mother for the full period, 1997 –
2014. It shows a significant increase in the number of births to mothers born in the EU
Accession (A8) countries and the rest of the world.
13 EU Agency for Fundamental Rights (2012) Op cit., p. 26
14 European Dialogue (2009) Movement of Roma from new EU Member States: a mapping survey of A2 and
A8 Roma in England. Report for Department for Children, Schools and Families, p. 8. Available at:
http://equality.uk.com/Resources_files/movement_of_roma.pdf
15
DENI (2015) Roma Pupils in Education, 2014/15 Key Statistics. School Census, Department of Education.
Available at: https://www.deni.gov.uk/sites/default/files/publications/de/Roma%20infographic.pdf
16
The attendance of Roma children at primary school is highly localised, with three or four schools accounting
for the majority of pupils. For example, in one small primary school in West Belfast, Roma pupils account
for half (50 per cent) of the total enrolment, or 70 out of 139 pupils (source: NISMP, 2015, The integration
of newcomer children with interrupted education into Northern Ireland schools, A Belfast-based case
study). Available at:
http://www.migrationni.org/DataEditorUploads/NISMPNewcomerChildrenwithInterruptedEducation.pdf
Northern Ireland Assembly, Research and Information Service 15NIAR 35-15 Research Paper
Table 5.1 Births in Northern Ireland by Country of Birth of Mother, 1997 – 2014
Registration NI, other UK, % A8 + Rest
Year All countries ROI A8 Rest of Word Not Stated of World
1997 24,087 23,518 2 542 25 2.6
1998 23,668 23,082 3 548 35 2.7
1999 22,957 22,341 6 579 31 2.9
2000 21,512 20,891 5 584 32 3.1
2001 21,962 21,272 12 649 29 3.5
2002 21,385 20,640 16 708 21 3.9
2003 21,648 20,723 21 875 29 4.8
2004 22,318 21,153 34 1,096 35 5.9
2005 22,328 21,208 118 986 16 5.7
2006 23,272 21,824 390 1,058 - 7.1
2007 24,451 22,504 775 1,170 2 8.9
2008 25,631 23,284 1,080 1,267 - 10.2
2009 24,910 22,592 1,113 1,205 - 10.3
2010 25,315 22,842 1,235 1,238 - 10.8
2011 25,273 22,796 1,210 1,267 - 10.9
2012 25,269 22,810 1,201 1,258 - 10.8
2013 24,277 21,834 1,257 1,186 - 11.1
2014 24,394 21,925 1,258 1,211 - 11.2
Source: NISRA (2015)
In 1997, only 2 babies in Northern Ireland were born to mothers from the A8 countries.
By 2008, this figure had risen to 1,080, and has hovered around the 1,200 mark ever
since. Births to mothers born in the rest of the world (excluding the UK, Ireland, and
the A8) have also increased, albeit at a lower rate, from 542 in 1997 to 1,211 in 2014.
Table 5.1 shows that births to mothers born outside the UK and Ireland (column 7) now
account for over 10 per cent of all births in Northern Ireland each year 17.
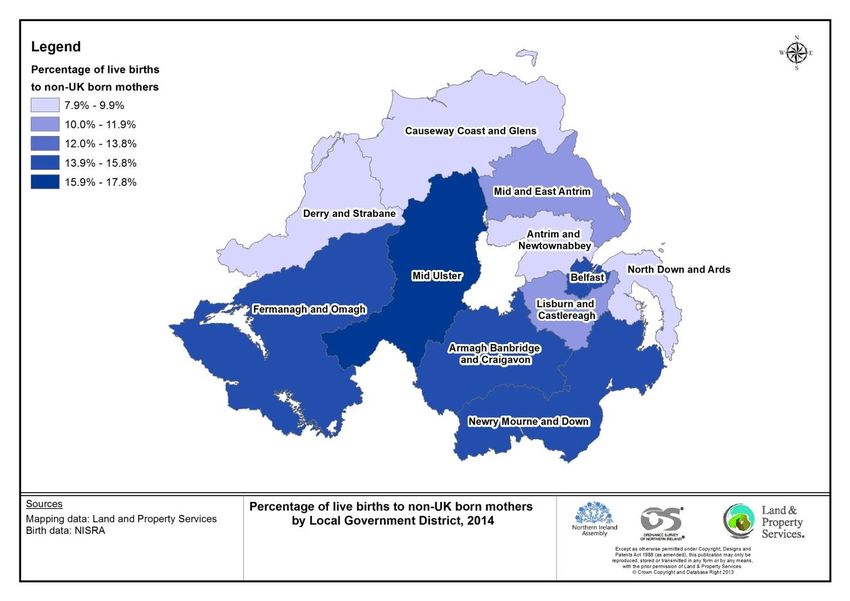
Births to non-UK born mothers have not been equally spread across Northern Ireland:
the largest number of such births have occurred in Belfast, plus the south and west
regions (Map 5.1). In 2014, for example, births to non-UK nationals accounted for 18
per cent of all births in the Mid Ulster local government district, followed by Armagh,
Banbridge and Craigavon (15%), Belfast (15%), Fermanagh and Omagh (14%) and
Newry, Mourne and Down (14%). North Down and Ards (7.9%) had the smallest
proportion.
17
NISRA (2015) Births by country of birth of mother, 1997-2014. Available at:
http://www.nisra.gov.uk/archive/demography/publications/annual_reports/2014/Table3.15_2014.xls
Northern Ireland Assembly, Research and Information Service 16NIAR 35-15 Research Paper
Map 5.1 Births to non-UK Mothers by LGD in 2014
Apart from maternity services and requests for interpreters (see section 5.4), however,
there is no evidence that newcomers to Northern Ireland are heavy users of health and
social care. In fact, migrant workers have a considerably younger age profile than the
host population, and tend to be in less need of medical care.
5.2 Newcomer Pupils
A newcomer pupil is one who has enrolled in a school but who does not have the
satisfactory language skills to participate fully in the school curriculum, and does not
have a language in common with the teacher, whether that is English or Irish 18. This
category, which has previously been referred to as English an Additional Language, is
primarily composed of children from a migrant worker background.
Fig 5.1 (overleaf) shows that the number of newcomer pupils in Northern Ireland has
risen by almost three-quarters (73.9%), from 6,795 in 2008 to 11,815 by 2014. Post-
primary pupils accounted for 20 per cent of newcomers, while the remainder were in
18
DENI (2015) Newcomer Pupils in Education, 2014/15 Key Statistics. School Census Department of
Education. Available at:
https://www.deni.gov.uk/sites/default/files/publications/de/newcomer%20infographic.pdf
Northern Ireland Assembly, Research and Information Service 17NIAR 35-15 Research Paper
pre-school, and primary school (Fig 5.2). The latest figures for 2015-16 show there are
now 12,900 newcomer pupils, accounting for 3.8 per cent of the school population 19.
Fig 5.1 Newcomer Pupils in Northern Ireland, 2008-14
14,000
11,815
12,000
10,605
10,000 9,535
8,210
7,805
No. of Newcomer Pupils
8,000 7,465
6,795
6,000
4,000
2,000
0
2008 2009 2010 2011 2012 2013 2014
Year
Source: DENI (2015) Newcomer pupils in education
Fig 5.2 Newcomer Pupils in Northern Ireland by category,
2014
0.9%
2.9%
2.7% 5.0% Voluntary and private pre-
20.1% 0.1% school centres
Nursery School
Nursery Class in Primary
School
Reception Class in Primary
School
Primary School (Year 1-7)
Post Primary
68.3%
Source: DENI (2015) Newcomer pupils in education
19
DENI (2016) Newcomer Pupils, 2001/02 to 2015/16. Available at:
https://www.deni.gov.uk/sites/default/files/publications/de/newcomer%20time%20series%201516.XLSX
Northern Ireland Assembly, Research and Information Service 18NIAR 35-15 Research Paper
Figure 5.3 shows the distribution of newcomer pupils by the new council areas in
October 2014.
Fig 5.3 Distributtion of Newcomer Pupils in Northern Ireland by LGD 2014
Mid Ulster (11% of total enrolments), Armagh, Banbridge and Craigavon (7.4%) and
Belfast (6.0%) have the highest proportion of newcomer pupils. Derry and Strabane
and Ards and North Down (both 1.8%) have the smallest proportion 20
5.3 Social Housing
While the majority of migrants live in the private rented sector, a growing number of
migrant households have applied for social housing in Northern Ireland.
During the period August 2006 – July 2014 (most recent figures available), an
estimated total of 11,671 migrant households applied for social housing, of whom 2,011
were successful 21. Table 5.2 contains a breakdown of the allocation figures by
20
DENI (2015) Newcomer Pupils in Education, 2014/15 Key Statistics. School Census Department of
Education. Available at:
https://www.deni.gov.uk/sites/default/files/publications/de/newcomer%20infographic.pdf
21
Social Housing includes both Housing Executive and Housing Association properties. Figures sourced from
NISRA (2015) International In-Migration by sex and single year of age (2014), Tables 2.22 and 2.23.
Available at: http://www.nisra.gov.uk/archive/demography/population/migration/Mig1314-In.xls
Northern Ireland Assembly, Research and Information Service 19NIAR 35-15 Research Paper
nationality for the period 2006 - 2014, and shows that Polish nationals were the largest
group (39%), followed by Lithuanians (14%) and Portuguese (10%) 22.
Craigavon council area, with a total of 392 allocations, had the largest number of
migrant social housing tenancies during the period 2007 – 2014, followed by Belfast
(380) and Dungannon (205). Larne and Banbridge had the smallest number of migrant
social tenancies, with less than five allocations during the seven-year period 23 .
Table 5.2 Migrant worker social housing allocations by Nationality, 2006 - 2014
Number of Migrant
Worker Social Housing
allocations Percentage
Nationality
Polish 783 38.9
Lithuanian 280 13.9
Portuguese 205 10.2
African 31 1.5
Other/undisclosed 717 35.7
Total 2,011 100.0
Source: NISRA (2015) International In-Migration 2014, Table 2.23
There are approximately 120,000 social housing dwellings in Northern Ireland, 88,000
owned and managed by the Housing Executive, and 32,000 by housing associations 24.
In July 2014, 1,342 migrant worker households held Housing Executive tenancies 25,
representing around 1.5 per cent of all Housing Executive stock. Overall, an estimated
three-quarters (76%) of migrant workers live in private rented accommodation, with
only 3 per cent in Housing Executive stock, and 5 per cent in housing association
properties 26.
22
NISRA (2015) International In-Migration by sex and single year of age (2014), Tables 2.23. Available at:
http://www.nisra.gov.uk/archive/demography/population/migration/Mig1314-In.xls
23
NISRA (2015) International In-Migration by sex and single year of age (2014), Table 2.20. Available at:
http://www.nisra.gov.uk/archive/demography/population/migration/Mig1314-In.xls
24
NIHE (2015) Northern Ireland Housing Market – Review and Perspectives 2015 – 2018. Available at:
25
NIHE (2015) Black and Minority Ethnic and Migrant Worker Mapping Update, July 2015. Available at:
http://www.nihe.gov.uk/black_and_minority_ethnic_and_migrant_worker_mapping_update.pdf
26
NIHE (2014) Housing Myths and Migrants. Available at:
http://www.nihe.gov.uk/housing_myths_and_migrants_updated.pdf
Northern Ireland Assembly, Research and Information Service 20NIAR 35-15 Research Paper
5.4 Health and Social Care: Interpreter Services
An indication of just how significant the impact of international migration has been on
the health and social care sector is provided by figures from the Regional Interpreting
Service. The Interpreting Service, which has 316 interpreters registered in 36
languages, is provided by the Belfast Trust for all health and social care organisations
in Northern Ireland. The service is provided free-of-charge to service users.
As Table 5.3 and Fig 5.4 illustrate, requests for interpreters have risen substantially in
recent years, from 825 in 2004 to 95,895 in 2014. Overall, a total of just under half a
million requests (493,660) were made between January 2004 and December 2014.
Table 5.3 Requests for Interpreter Services by HSCT Trusts, 2004-14
Year 2004 2005 2006 2007 2008 2009 2010 2011 2012 2013 2014
Interpreter 1815 2984 3419 4018 4904 5965 7354 8462 9589
requests 825 7710 0 5 0 0 5 5 5 0 5
Source: NISRA (2015) International Stock Migration, 2014
120,000
Fig 5.4 Requests for Interpreter Services by HSCT Trusts,
2004-14
100,000
No. of Interpreter Requests per Year
80,000
60,000
40,000
20,000
0
2004 2005 2006 2007 2008 2009 2010 2011 2012 2013 2014
Year
The largest proportion of requests come from the Southern HSC Trust (50%), followed
by the Belfast Trust (25%), the Northern Trust (13%), Western Trust (7.7%) and the
South Eastern Trust (4.2%) 27 28. During the eleven-year period (2004 – 2014), the
27
NISRA (2015) International Stock Migration by sex and single year of age (2014). Available at:
http://www.nisra.gov.uk/archive/demography/population/migration/Mig1314-Stock.xls
28
A request for interpreter services may not necessarily result in an actual interpreter appointment.
Northern Ireland Assembly, Research and Information Service 21NIAR 35-15 Research Paper
largest number of requests have been made on behalf of Polish nationals (33%),
followed by Lithuanians (17%), Chinese (9.7%), and Portuguese (8.8%).
5.5 Hate Crime
Incidents and offences with a racial motive are a relatively new category of crime
statistic in Northern Ireland, and were first recorded as such by the PSNI in 2004. Hate
crime refers to incidents or notifiable offences with a perceived racist, homophobic or
sectarian motive. A racist incident is defined as any incident, which may or may not
constitute a criminal offence, which is perceived to be racist by the victim or any other
person.
1,600
Fig 5.5 Racist incidents and offences, 2004 - 2014
1,400 Racist Incidents
1,200
Racist Incidents and Offences
1,000
800
600
400
Racist Offences
200
0
2004 2005 2006 2007 2008 2009 2010 2011 2012 2013 2014
Year
Figure 5.5 and Table 5.4 illustrate trends in racist incidents and offences for the period
2004 – 2014. The figure shows that the number of incidents / offences fluctuated
between 2004 and 2011, with a number of peaks and troughs. However, an upward
gradient has been evident over the past three years (2012 – 2014), with the number of
incidents almost doubling, rising from a low of 696 in 2011 to a figure of 1,356 in 2014.
The number of notifiable offences has also doubled, from 458 in 2011 to 921 in 2014.
Northern Ireland Assembly, Research and Information Service 22NIAR 35-15 Research Paper
Table 5.4 Racist Incidents and Offences, 2004 – 2014
Incidents Offences
2004 813 634
2005 936 746
2006 1,047 861
2007 976 757
2008 990 771
2009 1,038 712
2010 842 531
2011 696 458
2012 750 470
2013 982 691
2014 1,356 921
Source: NINIS (2015) Hate Crime Offences (Administrative geographies) 2014
5.6 Economic Benefits of Migration: a Brief Note
While migrants use public services in Northern Ireland, in the same way as other
citizens, it is important to note that they also make an important contribution to the
economic and cultural life of the region. Shirlow and Montague (2014) have drawn
attention to the myths and negative stereotyping associated with migrant communities
in Northern Ireland, and point out:
“In fact, recent European immigrants in the UK have paid £8.8 billion more in
tax than they have consumed in public services. In Northern Ireland,
migration also contributes to sustaining economic growth, filling labour
shortages, bringing much needed skills and enriching our society through
cultural diversity.” (Shirlow and Montague, 2014, p. 3) 29.
Migrants also make a vital contribution to the National Health Service (NHS). For the
UK as a whole, it has been estimated that around 30 per cent of the doctors and 40 per
cent of the nurses working in the NHS were born abroad 30.
In an early study (2008), Oxford Economics were asked by the Department for
Employment and Learning (DEL) to assess the net economic impact of migrant
workers (i.e. the genuine ‘additional’ impact of migrant workers over and above the
29
Shirlow, P. and Montague, R. (2014) Challenging Racism: Ending Hate. Queen’s University Belfast / Centre
for Democracy and Peacebuilding. November 2014. Available at: http://www.qub.ac.uk/research-
centres.../filestore/Filetoupload,472425,en.pdf
30
Hassan, M. (2003) cited in 30 Shirlow, P. and Montague, R. (2014) .
Northern Ireland Assembly, Research and Information Service 23NIAR 35-15 Research Paper
economic growth that might have occurred anyway in Northern Ireland in the absence
of immigration) 31.
For the year 2008, their central estimate for the overall net economic impact of post-
2004 migrant workers in Northern Ireland was an additional 40,000 jobs and £1.2bn
GVA 32. Overall, the authors concluded that migrant workers have made a significant
positive contribution to the Northern Ireland economy, filling labour shortages during a
‘golden era’ period (when unemployment was at a historic low).
The topic of Displacement, the extent to which migrants are employed at the direct
expense of local workers, was also considered. Based upon a survey of 600 local
employers, the authors concluded that displacement effects had been relatively
modest, largely due to ‘occupational segregation’ – the tendency for migrants to be
employed in a very different section of the market to indigenous workers, thereby
creating minimal displacement effects 33.
Since 2008, however, the economic outlook in Northern Ireland has worsened
considerably, with an anaemic recovery from recession coupled with significant cuts in
public expenditure. With migrants now likely to be competing with local workers for a
smaller pool of jobs, the balance of net benefits may change.
6 Future Trends in International Migration
In 2013-14, 13,300 people came to live in Northern Ireland from outside the UK, while
11,100 left to live abroad, leaving a net inflow of 2,200 people 34. Estimates of future
trends in international migration are produced by NISRA and form part of their bi-
annual Population Projections series. The latest projections (2014) 35 suggest a net
inflow of international migrants of 3,000 in 2015, falling to 2,000 per year between 2016
and 2019. Thereafter, net migration is projected to fall to around 1,000 per year up to
2035.
It is important to note, however, that international migration is notoriously difficult to
predict, as there are so many factors involved. The current migrant crisis in Europe, for
31
Source: Department for Employment and Learning (2009). The Economic, Labour Market and Skills Impacts
of Migrant Workers in Northern Ireland. Oxford Economics with FGS McClure Watters and Perceptive
Insight Market Research. Belfast: DEL. Available at:
http://www.delni.gov.uk/the_economic__labour_market_and_skills_impact_of_migrant_workers_in_nor
thern_ireland.pdf
32
GVA is defined by the authors as ‘Gross value added, a common measure of the value of economic output,
which is primarily made up of wages and profits’ (page ii).
33
An example is the food processing industry which, according to the authors, may have disappeared entirely
from Northern Ireland in the absence of migrant workers.
34
NISRA (2015) Statistical Bulletin: Long-term International Migration Statistics for Northern Ireland (2014).
Available at: http://www.nisra.gov.uk/archive/demography/population/migration/Mig1314-Bulletin.pdf
35
NISRA (2015) Northern Ireland Population Projections, 2014 – Components of Change. Available at:
http://www.nisra.gov.uk/archive/demography/population/projections/NPP14-coc.xls
Northern Ireland Assembly, Research and Information Service 24NIAR 35-15 Research Paper
example, which is a product of the continuing conflicts in Syria, Iraq, Afghanistan (and
other countries) highlights the inherent difficulties in accurately predicting migrant flows.
Unforeseen events such as wars, droughts and climate change, can dramatically alter
even the most carefully prepared calculations.
Northern Ireland Assembly, Research and Information Service 25You can also read