Greater Wellington Region - COVID-19 economic impact scenario one summary Pipiri 2020
←
→
Page content transcription
If your browser does not render page correctly, please read the page content below
Greater Wellington Region
COVID-19 economic impact scenario one summary

Pipiri 2020                            www.berl.co.nz
Month 2018

Author(s): Nick Robertson, Hugh Dixon, Hannah Riley

All work is done, and services rendered at the request of, and for the purposes of the client only. Neither BERL nor any of its employees accepts any responsibility
on any grounds whatsoever, including negligence, to any other person.

While every effort is made by BERL to ensure that the information, opinions and forecasts provided to the client are accurate and reliable, BERL shall not be liable
for any adverse consequences of the client’s decisions made in reliance of any report provided by BERL, nor shall BERL be held to have given or implied any
warranty as to whether any report provided by BERL will assist in the performance of the client’s functions.

©BERL                                                                   Reference No: #6124                                                              Pipiri 2020

                                                                                  Month 2018
Greater Wellington Region COVID-19 economic impact
Pipiri 2020
Making sense of the numbers
This is a supplementary report to support BERL’s Greater Wellington
Over the short-term, the region’s gross domestic product (GDP) will
Region COVID-19 economic impact report based on three scenarios.
reduce by 8.3 percent in the year to 31 March 2021. Four industries are
Our analysis shows that in the best case scenario (scenario one) the expected to be especially negatively impacted:
national and regional economy will take at least five years to recover
Accommodation and food services
from the impacts of COVID-19. Even then, growth will be below that
experienced in the years prior to COVID-19. Arts and recreations services
Under this scenario the population of the Wellington region is Personal services
expected to increase from 524,876 in 2020 to 569,821 in 2030. This is Administrative and support services.
an 8.6 percent increase (44,945 people). Population growth from
outside the region is expected to continue. However, this will be at a The three largest industries by GDP in the Wellington region will suffer
much lower rate than expected before COVID-19. The rate of job a decline in 2021, these are:
creation in the region is expected to slow as businesses recover. As a Professional scientific and technical services
result there is likely to be fewer opportunities to attract people to the
Public administration and safety
region from other parts of New Zealand.
Financial and insurance services.
As the country moves away from the restrictions put in place at
various alert levels and the economic situation begins to improve, the Employment in the Wellington region will decrease in 2021 and 2022
population growth is expected to pick up over the decade. before bouncing back in 2023. Unemployment will peak at 6.4 percent
in 2021 before falling to 5.7 percent in 2022.
International migration will be limited by the border restrictions. This
will limit the ability of international migrants to relocate to the region. Impacts on other indicators will see household income fall with an
Once border controls are lifted, in the short to medium term, it is associated decrease in consumer spending before both pick up as the
likely that people will be apprehensive to relocate away from family or economy recovers from 2022 onwards.
move country to take a new job given experiences during the
Māori have been adversely impacted by every previous economic
pandemic. A reduction in flight frequency and a likely increase in fares
shock, COVID-19 will also disproportionately impact upon Māori. Māori
will also make New Zealand and Wellington a less attractive option.
employment loss at alert level one in the Wellington region is (again)
most significant for accommodation and food services.
Making sense of the numbers i
Greater Wellington Region COVID-19 economic impact
Pipiri 2020

Contents

1    About the report ............................................................................................................................................................................................. 1

2    The scenario .................................................................................................................................................................................................... 2

3    Impact on the region..................................................................................................................................................................................... 3
     3.1      Population ................................................................................................................................................................................................................. 5
     3.2      Gross domestic product (GDP) ............................................................................................................................................................................ 6
     3.3      Employment.............................................................................................................................................................................................................. 6
     3.4      Retail............................................................................................................................................................................................................................7
     3.5      Hospitality ................................................................................................................................................................................................................. 8
     3.6      Tourism ...................................................................................................................................................................................................................... 9
     3.7      Transport ................................................................................................................................................................................................................... 9
     3.8      Future of work ........................................................................................................................................................................................................ 10
     3.9      Future of leisure ......................................................................................................................................................................................................11
     3.10      The Māori economy ...............................................................................................................................................................................................11

4    Conclusion ..................................................................................................................................................................................................... 12

5    Select data tables ........................................................................................................................................................................................ 13

                                                                                                                                                                                                                                  Contents          ii
Greater Wellington Region COVID-19 economic impact
Pipiri 2020

Tables

Table 2.1 Time spent at each alert level and GDP reduction ........................................................................................................................................................................ 2
Table 3.1 Wellington region population 2020-30 ............................................................................................................................................................................................. 5
Table 3.2 Wellington region GDP 2020-30 .........................................................................................................................................................................................................6
Table 3.3 Wellington region employment 2020-30 .........................................................................................................................................................................................6
Table 3.4 Retail trade GDP 2020-30 ................................................................................................................................................................................................................... 7
Table 3.5 Retail trade employment 2020-30 .................................................................................................................................................................................................... 7
Table 3.6 Accommodation and food services GDP 2020-30 .........................................................................................................................................................................8
Table 3.7 Accommodation and food services employment 2020-30 ..........................................................................................................................................................8
Table 3.8 Employment in largest industries 2020-30................................................................................................................................................................................... 10
Table 3.9 Arts and recreation GDP, FTEs, Māori GDP 2020-30.................................................................................................................................................................... 11
Table 5.1 Wellington region population 2019-2030........................................................................................................................................................................................ 13
Table 5.2 Wellington region employment by industry 2019-2030 ............................................................................................................................................................. 13
Table 5.3 Wellington region gross domestic product by industry 2019-2030 ......................................................................................................................................... 14
Table 5.4 Wellington region population by age and territorial authority 2019-2030 ............................................................................................................................. 15

Figures

Figure 3.1 Wellington region and territorial local authorities ........................................................................................................................................................................4
Figure 3.2 Wellington region population 2019-30 ............................................................................................................................................................................................ 5
Figure 3.3 Greater Wellington regional GDP 2019-2030 ($million)...............................................................................................................................................................6
Figure 3.4 Greater Wellington employment 2019-2030 (FTEs) .....................................................................................................................................................................6
Figure 3.5 Retail Trade GDP 2019-2030 .............................................................................................................................................................................................................. 7
Figure 3.6 Retail trade employment 2019-2030 ............................................................................................................................................................................................... 7
Figure 3.7 Accommodation and food services employment 2019-30 .........................................................................................................................................................8
Figure 3.8 Employment in largest industries 2019-2030 ............................................................................................................................................................................. 10

                                                                                                                                                                                                                                         Contents          iii
Greater Wellington Region COVID-19 economic impact
Pipiri 2020

1        About the report
                                                                           to provide GWRC with early projections and forecasts of how the
This report is a summary of the findings of scenario one, the best
                                                                           Wellington region is likely to respond to the impacts of COVID-19
case, from BERL’s report for Greater Wellington Regional Council
                                                                           under a range of scenarios:
(GWRC), COVID-19 economic impact.
                                                                           •     Scenario one -the best case
The positive direction of the national recovery from the restrictions
put in place to combat COVID-19 leads us to believe that scenario one      •     Scenario two - the mid-point
(best case) is the most likely path.
                                                                           •     Scenario three - the worst case.
This report places the findings of the COVID-19 economic impact
                                                                           The scenarios are based on the time spent at each alert level (the
report in the context of the challenges facing the region as identified
                                                                           health response), the economic impact at each alert level (the
by BERL for GWRC during alert level four.
                                                                           economic response) and the time spent to develop and distribute a
The COVID-19 pandemic has resulted in a global health and economic         vaccine (the treatment response).
crisis that will have long lasting impacts for the Wellington region and
                                                                           The information in this report and the main report is intended to
GWRC. The impact of COVID-19 requires GWRC to reconsider the
                                                                           inform and guide GWRC as it prepares to develop its planning
assumptions, forecasts and data that will be used to prepare its long
                                                                           documents which will outline the council’s response to support
term and annual plans.
                                                                           regional wellbeing during the recovery.
The impact of COVID-19 is likely to be one of the biggest challenges
                                                                           The economic impacts are presented across six indicators
many of us will face. The International Monetary Fund (IMF) forecast
that the global economic impact could be the worst since the Great         •     Population
Depression. Maintaining an environment that saves lives and a health       •     Gross domestic product (GDP)
system that meets the demands placed on it is of the upmost
importance COVID-19 will have long term impacts on the wellbeing of        •     Employment

Wellington communities and will require a long term response. The          •     Unemployment
recovery will impact all four of the wellbeings; economic, social,
                                                                           •     Household income
cultural and environmental.
                                                                           •     Consumer spending.
Greater Wellington Region COVID-19 economic impact report
                                                                           The report also comments on the impact on the Māori economy’s GDP
Because there is so much uncertainty surrounding COVID-19 the focus        in each scenario. All GDP, household income and household
of the Greater Wellington Region COVID-19 economic impact report is        consumption figures in this report are real in 2020 values.

                                                                                                                                            Contents   1
Greater Wellington Region COVID-19 economic impact
Pipiri 2020

2        The scenario                                                      Table 2.1 Time spent at each alert level and GDP reduction

                                                                           Alert level                  Months      GDP Reduction (%)
What happens in the 12 to 24 months following identification of
                                                                             Level four                      1                  37.0
COVID-19 in New Zealand will set the foundation for the economic
                                                                               Level three                   1                  19.0
recovery and the performance of the Wellington regional economy
                                                                               Level two                     5                   8.8
over the 10 year period of the Long Term Plan (LTP). To enable Greater
                                                                               Level one                     5                   3.8
Wellington Regional Council (GWRC) to plan for the future BERL
                                                                               Level one (2021)              6                   4.8
created three scenarios to illustrate how the recovery might unfold.

Given the success New Zealand has had in fighting COVID-19 it              Once New Zealand leaves alert level one (2021) in October 2021, New
appears that the path identified in scenario one of the report is the      Zealand will move from the short term scenarios into the long term
most likely.                                                               recovery that will continue until March 2030.

Scenario one is the best case scenario for the economic recovery. The      This report makes a number of assumptions about the time spent at
scenario begins from April 2020 soon after New Zealand entered alert       each alert level and the level of activity allowed. If the health and
level four. In this scenario New Zealand will continue on the              treatment responses are better than the assumptions in the respective
successful trajectory that has seen the county move from alert level       scenarios, the negative economic impact will be less than the scenario.
four down through the alert levels to alert level two at the time of       This would reduce the initial negative impacts and keep the economic
writing. We have assumed that the remaining ten months of the year         trajectory of the region as close to pre-COVID-19 levels and trajectory,
will be split evenly with five months at alert level two and five months   forecasts and projections as possible.
at alert level one. This also allows for uncertainty and some              The industries that would benefit from fewer restrictions are expected
movement between alert levels as the situation in New Zealand and          to be those hardest impacted across the GDP and employment
globally evolves.                                                          measures used in this report. These include:
To account for the additional time required to manufacture and             •       Accommodation and food services
distribute the vaccine, an additional six months at alert level one is
included. This is to account for the border restrictions that will be in   •       Arts and recreation services
place while distribution occurs. We have referred to this as alert level   •       Retail trade.
one (2021).
                                                                           The benefits that are experienced from being able to increase
As restrictions on activities reduce at each alert level and the impact    activities have indirect and induced benefits that further reduce the
on the economy is also reduced. To account for this we have applied        impact of COVID-19 and will drive the recovery.
the Reserve Bank forecasts for the impact on GDP at each level.

                                                                                                                                        The scenario   2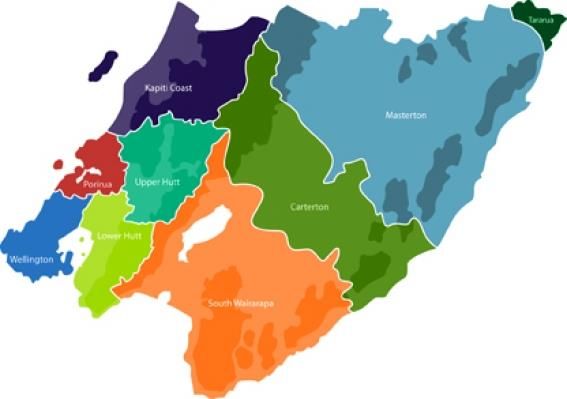
Greater Wellington Region COVID-19 economic impact
Pipiri 2020

3         Impact on the region                                              GWRC and the territorial authorities should work with central
                                                                            government early to investigate alternative methods of funding and
Central government has shown a commitment to the recovery. It is            financing for local projects. Funding options such as special purpose
clear that government will play a much greater role in economic             vehicles or growth zones could be used to enable local government to
activity. Private sector businesses, despite their best efforts, will       bring forward projects. Government has shown a willingness to do
struggle to maintain cashflow. Consequently, and given ongoing              this before COVID-19.
uncertainty, there will be little appetite for investment in renewal or
                                                                            With central government looking to bring projects forward it is likely to
expansion opportunities. Similarly, families, whānau, and households
                                                                            be open to alternative approaches led by local government.
will face uncertain employment and income prospects. Their appetite
for spending will similarly be constrained. It will be left for             Long Term
government, both central and local, to underpin spending (the demand
                                                                            In the long term, fiscal policy will drive the economic recovery.
side) but also reinforce confidence in future plans. The latter includes
                                                                            Government has a central role in maintaining the demand for goods
maintaining confidence in social and community networks as the
                                                                            and services.
safety net for businesses and for families (the supply side). Continued
spending and operations in the economic and social infrastructure will      As well as short term support for households and families, central
be critical to enabling a return to some confidence in future               government have indicated that it will make significant investment in
opportunities.                                                              infrastructure. The Government has tasked the Infrastructure Industry
                                                                            Reference Group to seek infrastructure projects that are ready to start
Consequently, the role of local government is just as critical as that of
                                                                            within six months of the construction industry returning, and will put
central government. Front and centre for local government must
                                                                            forward projects to Ministers from the private and public sector.
remain the four wellbeings. The kaupapa remains unchanged.
                                                                            GWRC should ensure that it has projects ready to get maximum
Local government can ensure demand remains strong. Increased
                                                                            benefit from infrastructure investment that will continue to support
investment by local government will support the recovery. Local
                                                                            the recovery into the medium and long term. The infrastructure
government sets the environment for economic activity. Local
                                                                            developed during the recovery can have an intergenerational benefit
government also has closer levels of engagement and stronger
                                                                            like the electrification of the Johnsonville line and state houses built
relationships with local business. Local government will play a
                                                                            during the Great Depression.
significant role in promoting local projects to central government. To
show that these projects are ready to proceed it will be important to       Government investment presents the opportunity to prepare for
have well developed business cases to support investment. Shovel            climate change. The importance of a strong utility network has been
ready projects require political support, budgets in long term plans        highlighted before and during the COVID-19 pandemic. Broadband and
(LTPs) and a lot of initial design already done.                            phone lines have been essential to ensuring that some of the economy
                                                                            can continue to operate in an emergency.

                                                                                                                                 Impact on the region   3
Greater Wellington Region COVID-19 economic impact
Pipiri 2020
Given the increasing number of weather events expected the recovery councils are likely to reduce expenditure which will create job losses
presents the opportunity for Wellington to improve the resilience of directly or indirectly. Longer-term, DIA expects that reduced
the utility networks so that they are equipped to withstand weather investment in infrastructure is likely to lower productivity and reduce
and seismic events. the availability of serviced land needed for housing.1
Accessing government funding to prepare for the future impacts of We understand the need to put a realistic LTP together, the use of
climate change could enable the region to support multigenerational deferred payment schemes (rather than zero rates increases), should
wellbeing. be explored. Similarly, the use of debt funding should be explored (as
should a revision of the debt-ceiling constraint) – given the likelihood
Longer term there are likely to be significant changes in the roles of
of incredibly low interest rates for the foreseeable future. Further,
central and local government, and potentially the funding sources.
alternative funding mechanisms from central government should be
Given the level of government investment expected to support the
actively pursued (together with LGNZ).
economy through the recovery, the role and activities of government
will likely broaden. This may mean that local authorities are given Conversely, an untowardly narrow perspective on protecting council
more opportunity to access funding and financing. finances will be reflected in deficits across other wellbeing domains as
has been experienced in recent years.
Rates and spending
Figure 3.1 Wellington region and territorial local authorities
All Wellington councils should expect a reduction in non-rate revenue
in 2021 and 2022. The impact on the business sector is likely to be
more pronounced than in a conventional economic downturn. Local
authorities with a high proportion of business rates are likely to face
greater collection difficulties than others.
We are aware of pressures across many councils to hold rates
increases as household incomes fall. We must advise that this ‘kicking
the can down the road’ is likely to jeopardise the delivery of future
services. This will act directly against the kaupapa of ensuring the
wellbeing of current and future generations.
The Department of Internal Affairs (DIA) expects that the effect of
lower-than-planned rates and other revenue reductions means
1
Department of Internal Affairs (2020). Local Government Sector COVID-19
Financial Implications Report 1 – Initial Analysis
Impact on the region 4Greater Wellington Region COVID-19 economic impact
Pipiri 2020
3.1 Population The impact on population will depend on how well Wellington recovers
compared to the rest of the country. With employment opportunities
Population estimates from before COVID-19 are now likely to be
limited and high unemployment, it is unlikely that there will be large
inaccurate as the underlying assumptions no longer stand. We expect
movements of people into Wellington to take on work opportunities.
that COVID-19 will cause domestic and international migration into the
region to slow in the short term before picking up again from 2024 for When new jobs are created during the recovery, it is likely that the
the remainder of the decade. By 2030 the Wellington region majority of these jobs will be filled by locals who lost their job as a
population is expected to be close to those forecast prior to COVID-19. result of COVID-19. There is likely to be fewer opportunities to attract
people to the region from other parts of New Zealand.
The population of the Wellington region is expected to increase from
524,876 in 2020 to 569,821 in 2030. This is an 8.6 percent increase However, if Wellington can recover faster than other parts of the
(44,945 people). The natural cycle of birth and deaths is expected to country, there is potential that a strong recovering economy could
keep the population growing while international migration slows. attract more people to the region in the medium term.
Figure 3.2 Wellington region population 2019-30 International migration will be limited by the border restrictions. This
will limit the ability of international migrants to relocate to the region.
580,000
Then once border controls are lifted, in the short to medium term, it is
570,000 likely that people will be apprehensive to relocate away from family or
560,000
move country to take a new job given experiences during the
pandemic. A reduction in flight frequency and a likely increase in fares
550,000 will also make New Zealand and Wellington a less attractive option.
540,000 The reduction in inward migration will be partially offset by residents
staying in Wellington. Unemployment will remain high across the
530,000
world. This may cause some New Zealanders living overseas to return.
520,000 With Australia already in recession, people there may return home.
2019 2020 2021 2022 2023 2024 2025 2026 2027 2028 2029 2030
Additionally, the traditional overseas experience will be a less
Wellington region Pre Covid-19 .id Projection
attractive proposition with tighter travel restrictions. This may reduce
the attraction of living in the United Kingdom and travelling to Europe.
Population growth is expected to be slower in 2021 and 2022 as the
impact of border measures continue to be felt. Once the country Table 3.1 Wellington region population 2020-30
moves away from the restrictions put in place at all alert levels and Total population 2020 2021 2022 2025 2030
the economic situation begins to improve, the population growth is Wellington region 524,876 527,271 528,469 542,984 569,821
expected to pick up.
Impact on the region 5Greater Wellington Region COVID-19 economic impact
Pipiri 2020
3.2 Gross domestic product (GDP) 3.3 Employment
The impact of COVID-19 will cause the GDP of the Wellington region to Employment is expected to fall by 5.5 percent by March 2021 to
fall by $277 million between 2020 and 2021 (8.3 percent). GDP will 248,266 full time equivalent employees (FTEs). In 2022 there will be a
then pick up again in 2022 when GDP is expected to recover by 7.8 further 0.9 percent decrease in the number of FTEs in the Wellington
percent ($223.5 million) to $30.4 billion. By 2023 GDP in the region will region. Total FTEs will decrease to 246,134.
increase a further 5.5 percent from 2021 to $32.1 billion.
Table 3.3 Wellington region employment 2020-30
Table 3.2 Wellington region GDP 2020-30 2020 2021 2022 2025 2030
Total employment (FTEs)
Total GDP ($millions) 2020 2021 2022 2025 2030 Wellington region 262,783 248,266 246,134 268,629 288,055
Wellington region 30,746 28,193 30,389 34,142 38,452
In 2023 employment will bounce back and the total number of FTEs
All industries will be impacted by the COVID-19 restrictions directly or,
will increase by 4.5 percent. Total employment in the region will reach
indirectly. Industries that are reliant on face to face interactions or
288,055 by 2030. This is an increase of 17 percent (41,922 FTEs) from
people being in close contact will be impacted hardest by the health
the low expected in 2022.
measures taken to stop the spread of COVID-19. Industries that were
able to transition to alternative ways of working such as public Figure 3.4 Greater Wellington employment 2019-2030 (FTEs)
administration and safety, agriculture, fishing and forestry and 295,000
information media and telecommunications will be the least impacted. 285,000
275,000
Figure 3.3 Greater Wellington regional GDP 2019-2030 ($million)
265,000
43,000 255,000
41,000 245,000
39,000 235,000
37,000
225,000
35,000
2019 2020 2021 2022 2023 2024 2025 2026 2027 2028 2029 2030
33,000
31,000 Wellington Region
29,000
27,000
25,000
Employment growth over the decade will be greatest in Wellington
2019 2020 2021 2022 2023 2024 2025 2026 2027 2028 2029 2030 City where FTEs will increase by 9.7 percent (15,376 FTEs) from 2020
Wellington Region to 2030 and 17 percent from the low of 2022. Lower Hutt City will add
an additional 4,249 FTEs between 2020 and 2030 (9.6 percent). The
Wellington City will have the highest contribution to regional GDP second largest increase in the region. Upper Hutt City will have the
across the decade from $19.9 billion in 2020 to $24.9 billion by 2030. largest proportional increase over the decade (10.1 percent).
Impact on the region 6Greater Wellington Region COVID-19 economic impact
Pipiri 2020
3.4 Retail Retail employment
The retail sector will be impacted by the COVID-19 restrictions. Some Employment in retail trade will decline by 9.5 percent in 2021. Almost
retail businesses will not reopen after the lockdown. The retail sector 2,000 retail workers will become unemployed. This will bounce back
is likely to see an initial spike as people replace what was used during in 2022 as the economy recovers. Retail will add 921 FTEs in 2022.
the lockdown. However, as the economic slowdown continues and However, this will leave over 1,000 workers still unemployed.
unemployment grows the retail sector will suffer. Retail that focusses Employment in the retail industry will remain below 2020 pre COVID-
on low cost and savings may become popular as people become more 19 levels until 2024. Retail employment will pick up as the recovery
budget conscious. continues and will reach 23,202 FTEs by 2030.
Retail GDP Table 3.5 Retail trade employment 2020-30
GDP in the retail sector will see a decline by 16.3 percent in 2021 due Total employment (FTEs) 2020 2021 2022 2025 2030
Retail trade 20,898 18,904 19,825 21,637 23,202
to the COVID-19 restrictions on activity. In 2022, retail GDP will
Total 262,783 248,266 246,134 268,629 288,055
recover by 16.3 percent from the low in 2021. Following this low, in
2022 retail trade will grow to $2 billion by 2030. This is a 22.5 percent Retail trade employment is concentrated in Wellington City where
increase in retail trade over the decade. retail employment will fall by 61.6 percent in 2021 before recovering in
2022 and continuing to grow out to 2030. At this time there will be
Table 3.4 Retail trade GDP 2020-30
9,585 retail FTEs in Wellington City. Lower Hutt City will remain a key
Total GDP ($millions) 2020 2021 2022 2025 2030
retail centre with 5,363 FTEs in 2030. An increase of 11 percent from
Retail trade 1,703 1,425 1,649 1,853 2,086
2020.
Total 30,746 28,193 30,389 34,142 38,452
Figure 3.6 Retail trade employment 2019-2030
Figure 3.5 Retail Trade GDP 2019-2030
24,000
2,200
23,000
2,000 22,000
21,000
1,800
20,000
1,600 19,000
18,000
1,400
17,000
1,200 16,000
15,000
1,000
2019 2020 2021 2022 2023 2024 2025 2026 2027 2028 2029 2030
2019 2020 2021 2022 2023 2024 2025 2026 2027 2028 2029 2030
Retail trade
Retail trade
Impact on the region 7Greater Wellington Region COVID-19 economic impact
Pipiri 2020
3.5 Hospitality Hospitality employment
The impact of COVID-19 on the hospitality sector has already been Accommodation and food services employment will be heavily
seen with some businesses announcing they will not reopen. A impacted and will fall by 61.6 percent (11,381 FTEs) in 2021. This will
number of hospitality businesses will re-open, however, the impact of recover by 17.9 percent (1,270 FTEs) in 2022. Employment will remain
COVID-19 may cause many to change their operating model and some below 2020 levels for the decade. By 2030 employment in
may find their business is no longer sustainable. Experience with accommodation and food services in the region will return to 9,793
takeaway and delivery during the lockdown period may see these FTEs. This is just 53 percent of the FTEs in the industry in 2020.
options become more popular. This could create new employment Table 3.7 Accommodation and food services employment 2020-30
opportunities in the warehousing and logistics industry.
Total employment (FTEs) 2020 2021 2022 2025 2030
As the recovery continues hospitality will be negatively impacted by Accommodation and food services 18,479 7,098 8,368 9,133 9,793
Total 262,783 248,266 246,134 268,629 288,055
reduced international tourism and a reduction in household incomes.
Falling household incomes will see spending on non-essential goods The biggest loss of accommodation and food service employment will
decline. Eating out and recreational travel are often some of the first be seen in Wellington City. In 2020 there were over 11,000
areas where families can look to reduce costs when facing budget accommodation and food service employees in Wellington City. By
concerns. 2021 this will have declined to 4,240. From this low of 2021
accommodation and food service employment will grow slowly to see
Hospitality GDP
5,850 FTEs employed in 2030.
The after work and weekend economy which typically involves dense
Figure 3.7 Accommodation and food services employment 2019-30
numbers of people in confined spaces will see a number of these
businesses face pressure. This could impact on the vibrancy of places 19,000
like Courtney Place and Station Village. 17,000
15,000
The accommodation and food services industry will be hit the hardest
13,000
by COVID-19. GDP in the accommodation and food services sector will
11,000
fall by 63.9 percent in 2021. Although there will be some recovery, the 9,000
industry contribution to regional GDP will remain below 2020 levels 7,000
until past 2030. 5,000
2019 2020 2021 2022 2023 2024 2025 2026 2027 2028 2029 2030
Table 3.6 Accommodation and food services GDP 2020-30
Accommodation and food services
Total GDP ($millions) 2020 2021 2022 2025 2030
Accommodation and food services 796 288 374 420 473
Total 30,746 28,193 30,389 34,142 38,452
Impact on the region 8Greater Wellington Region COVID-19 economic impact
Pipiri 2020
3.6 Tourism 3.7 Transport
Industries involved in tourism activities are expected to be the hardest A reduction in vehicle traffic was seen during alert levels three and
hit by COVID-19. These will primarily be the industries identified in four. However, as restrictions have eased traffic levels have begun to
this summary; accommodation and food services, retail trade and arts increase. Social distancing may require changes to regional public
and recreation services. There are a number of migrant workers who transport services. Overseas public transport has been one of the
work in these industries who will face a decision whether to stay in major causes of virus spread. Allowing fewer passengers on individual
New Zealand or return home. busses or trains may require smaller more frequent services.
International travel options will be limited and more expensive which If people work from home more frequently after the experiences
will make people want to visit more of their own backyard. With during alert levels three and four, this could see a reduction in the
international tourism likely to be constrained for a while businesses demand for public transport services. This may also see some
with a focus on international tourism will be the hardest hit and will services needing to change to adapt for the changing needs of
need to consider options for domestic tourists. Wellington’s public transport users.
Wellington is well positioned to take advantage of domestic tourism. Reduced international and domestic air travel will also push back the
Wellington has a number of significant attractions including Te Papa timeframe for needing to extend the runway at Wellington
and Zealandia. The Kapiti Coast and Wairarapa will also be attractive International Airport. Only once air transport sees a significant growth
for weekend or day trips. Wairarapa has been a popular domestic will the runway length need to be considered. Air travel will continue
tourist destination for residents from the western side of the to be more expensive but the industry will be recovering.
Remutaka hill and should remain a popular domestic tourist
An increase in domestic tourism could put pressure on the road
destination.
networks in and out of the region. The opening of Transmission Gully
Trans-Tasman Bubble and the Levin and Otaki Bypasses should help this. However, the
Remutaka hill road could become congested at peak holiday times.
A trans-Tasman travel bubble would limit the impact of COVID-19 on
the Wellington economy. Accommodation and food services, arts and The impact on the transport warehousing and logistics industry will be
recreation services and retail trade will be the industries that will less than other sectors, as many of the businesses operating in this
benefit from increased tourism activity. However, airfares are likely to industry were considered essential and continued operating across all
be higher than before COVID-19 which will reduce demand. alert levels.
If a vaccine is developed sooner than expected, the benefits to Employment in transport warehousing and logistics will grow by 1.8
tourism focussed businesses will further limit the negative impact that percent (162 FTEs) in 2021 as deliveries become more popular. This
COVID-19 will have on the economy and wellbeing. will decline by 2.8 percent (266 FTEs) in 2022. By 2030 employment in
the industry will be 16 percent greater than in 2020 with 10,670 FTEs.
Impact on the region 9Greater Wellington Region COVID-19 economic impact
Pipiri 2020
3.8 Future of work Public administration and safety was the largest industry by
employment in 2020 (41,659 FTEs). This is expected to grow in 2021 to
Currently and looking ahead to 2030, the five largest industries in
support the COVID-19 response before declining in 2022 to a level
Wellington by employment are:
consistent with 2020 employment. By 2030 employment in this
Public administration and safety industry will have grown 17.9 percent from 2020. Eighty percent of
Public administration and safety FTEs will be based in Wellington City.
Professional scientific and technical services
Figure 3.8 Employment in largest industries 2019-2030
Health care and social assistance
45,000
Construction
40,000
Education and training.
35,000
Employment in these industries will drop by 2,554 full time employees
30,000
by 2022, but will recover in 2023. Employment in these industries is
25,000
expected to grow by an estimated 21,350 between 2019 and 2030.
20,000
Table 3.8 Employment in largest industries 2020-30
15,000
Total employment (FTEs) 2020 2021 2022 2025 2030
Construction 21,426 21,348 21,583 23,555 25,259 10,000
Professional scientific 33,527 33,023 33,408 36,461 39,098 5,000
Public Administration 41,659 44,453 41,968 45,803 49,115
-
Education and training 20,949 21,274 19,903 21,722 23,293
2019 2020 2021 2022 2023 2024 2025 2026 2027 2028 2029 2030
Health care and social 24,374 25,551 23,487 25,633 27,487
Construction
Total for these industries 141,935 145,650 140,348 153,175 164,253
Professional scientific and technical services
It is vital that businesses are kept informed about government Public administration and safety
programs and support packages that are available to ensure Education and training
businesses and the jobs they support directly and indirectly survive. Health care and social assistance
The increase of people working from home during the COVID-19 Professional scientific and technical services is the largest industry by
lockdown may result in people working from home more frequently. regional GDP contribution ($4.4 billion). The industry will be one of
Working from home will take people from our city centres and will eight to see employment decline in 2021 (1.5 percent). By 2030 the
keep them in the local communities. This will likely see more activity industry employment will have grown by 16.6 percent from 2020, while
in smaller town and city centres. GDP will grow 28.6 percent over the same period to $5.7 billion.
Impact on the region 10Greater Wellington Region COVID-19 economic impact
Pipiri 2020
3.9 Future of leisure 3.10 The Māori economy
Local outdoor recreation facilities are likely to see increased demand Māori have been adversely impacted by every previous economic
from residents. Regional and national parks are likely to see higher shock, COVID-19 will also disproportionately impact upon Māori.
demand as international tourism is reduced. An increase in patronage However, a successful response to COVID-19 could insulate against
at these locations could require additional investment from GWRC to being adversely impacted in future shocks.
ensure natural capital is maintained and kept safe.
Immediate consequences on the Māori economy will centre on the
Recreation is important to wellbeing, in particular for social and negative impact on several tourism operators, with employment loss in
cultural wellbeing. GWRC should support and encourage recreation the accommodation and food services industry. The Wellington region
activities where possible. Māori economy GDP will drop eight percent ($299 million) from 2020
to 2021. Māori economy GDP will return above pre COVID-19 levels by
Arts and recreations services’ GDP will fall by 58.1 percent to $218
2023. Māori rangatahi between the ages of 15 and 19 in the Wellington
million and its regional employment will fall by 55.3 percent (3,138
region will be leaving formal secondary education during the most
FTEs). Arts and recreation GDP in the Māori economy will fall by $46
severe period of low employment.
million from 2020 to 2021.
A 2018 report for GWRC2 found Māori business thriving, with a strong
Arts and recreation services will recover in 2022 but will still be well
presence in film, technology and business services. Further, Māori
below pre COVID-19 GDP levels. The impact on arts and recreation
owned entities play a key role in commercial property, housing and
will continue right through the decade. Arts and recreation services
social developments. However, Māori did earn significantly less than
are only expected to reach 72.2 percent of their 2019 GDP by 2030.
the regional average. Notably lower home ownership rates
Employment in arts and recreation will be heavily impacted by COVID- constrained their ability to enter into self-employed or SME business
19. Employment will fall 55.5 percent in 2021 before recovering by just enterprise. Nearly 60 percent of Māori in the region were aged under
23.6 percent in 2022. By 2030 employment will be 35.2 percent less 30 years old.
than 2020.
Longer term the impact on Māori will be acutely felt by their currently
Table 3.9 Arts and recreation GDP, FTEs, Māori GDP 2020-30 young population. In particular, decisions to defer infrastructure
Arts and recreation 2020 2021 2022 2025 2030 spending (whether on social networks, community facilities, or
GDP ($millions) 521 218 297 334 376 physical and natural capital) will impact disproportionately more on
Empoyment (FTEs) 5,678 2,541 3,140 3,427 3,675 Māori. Especially Māori rangatahi who will bear more of the load of
Māori GDP ($millions) 80 34 46 51 58 restoring infrastructure in the future, should it be neglected now.
2
Māori economy in the Greater Wellington Region, BERL report #5885, March
2018
Impact on the region 11Greater Wellington Region COVID-19 economic impact
Pipiri 2020
4 Conclusion The experience of working from home has seen some businesses
announce office closures in Wellington City. If more follow this will
GWRC should assume that the Wellington region will see the impact of have an impact on retail and hospitality in the central city.
the response to COVID-19 across all indicators and all territorial
This could see the Wellington region’s town and city centres attract
authority areas. While the scenario shows that the Wellington region
additional activity as people spend more time in local communities
will be significantly impacted by COVID-19 up to 2030, it is likely that
rather than commuting into Wellington City.
the region will perform better than a number of regions. Wellington
does not have the same reliance on tourism and face to face services The Government has tasked the Infrastructure Industry Reference
as other regions. Wellington’s position as the heart of New Zealand’s Group to seek infrastructure projects that are ready to start as soon
government will help it recover. Government will play a major part in as possible. GWRC should ensure that it has projects ready to provide
the recovery, and will require staff to perform the roles required to maximum benefit from infrastructure investment. The infrastructure
lead New Zealand through the recovery from COVID-19. developed during the recovery can have an intergenerational benefit
like the electrification of the Johnsonville line and state houses built
If the health and treatment responses are better than the scenario
during the Great Depression.
foresees, we expect the economic impact will be less than the
scenario predicts. Therefore, the economic future of the region will be Government investment also presents the opportunity to prepare for
better with less time at each alert level. climate change. Accessing government funding to prepare for the
future impacts of climate change could enable the region to support
The industries that will be hardest hit by COVID-19 will be those that
multigenerational wellbeing.
rely on face to face interactions. These include accommodation and
food services, professional services, retail trade and personal services. Given the increasing number of weather events expected the recovery
presents the opportunity for Wellington to improve the resilience of
Looking ahead to 2023, when the recovery will be in full effect, all
the utility networks to withstand weather and seismic events.
industries and territorial authorities will begin to see an increase in
employment. Finally, looking out to 2030 employment and GDP Some Wellington businesses could benefit from the increased
growth will continue but the rate of growth will decline as the unemployment. Businesses have the opportunity to hire more
economic recovery continues and COVID-19 is behind us. domestic talent than at any time in recent memory. Displaced
employees will be returning to the job market hungry for their next
In his Budget 2020 speech, Minister of Finance Grant Robertson said
challenge while government supported training will enable this
that “here are few times in life when the clock is reset. Now is the
transition.
time we should address these long-term issues.” This statement also
applies to local government. This once in a lifetime event presents an The data tables that follow show some of the impacts Wellington can
opportunity to try new ideas and approaches. expect as the region recovers from COVID-19.
Conclusion 12Greater Wellington Region COVID-19 economic impact
Pipiri 2020
5 Select data tables
Table 5.1 Wellington region population 2019-2030
Total Population 2019 2020 2021 2022 2023 2024 2025 2026 2027 2028 2029 2030
Kapiti Coast District 55,163 55,503 55,710 55,781 56,137 56,462 56,959 57,543 58,143 58,786 59,454 60,166
Porirua City 58,606 59,230 59,600 60,067 61,109 62,197 63,582 65,048 66,530 68,106 69,745 71,399
Upper Hutt City 44,126 44,084 43,955 43,714 43,755 43,892 44,131 44,426 44,746 45,124 45,484 45,824
Lower Hutt City 105,702 105,722 106,046 106,066 106,667 107,117 107,877 108,750 109,555 110,422 111,274 112,114
Wellington City 212,923 214,537 215,891 216,678 219,077 220,885 223,151 225,040 226,566 228,002 229,331 230,645
Wairarapa 45,400 45,800 46,069 46,162 46,503 46,828 47,284 47,764 48,228 48,722 49,202 49,671
Wellington Region 521,920 524,876 527,271 528,469 533,248 537,380 542,984 548,571 553,768 559,163 564,492 569,821
Table 5.2 Wellington region employment by industry 2019-2030
Total employment (FTEs) 2019 2020 2021 2022 2023 2024 2025 2026 2027 2028 2029 2030
Agriculture, fishing and forestry 3,713 3,755 4,018 3,783 3,954 4,047 4,129 4,201 4,267 4,326 4,379 4,427
Mining 417 421 433 425 444 454 463 472 479 485 491 497
Manufacturing 13,867 13,144 13,451 13,241 13,841 14,166 14,451 14,706 14,935 15,141 15,328 15,496
Electricity and waste services 2,205 2,090 2,221 2,105 2,201 2,252 2,298 2,338 2,375 2,407 2,437 2,464
Construction 21,403 21,426 21,348 21,583 22,561 23,090 23,555 23,971 24,344 24,680 24,984 25,259
Wholesale trade 8,411 7,510 7,638 7,435 7,772 7,954 8,115 8,258 8,386 8,502 8,607 8,702
Retail trade 19,122 20,898 18,904 19,825 20,724 21,210 21,637 22,018 22,361 22,670 22,949 23,202
Accommodation and food services 16,908 18,479 7,098 8,368 8,747 8,952 9,133 9,294 9,438 9,569 9,687 9,793
Transport, postal and warehousing 7,682 9,222 9,384 9,118 9,531 9,754 9,951 10,126 10,284 10,426 10,554 10,670
Information media and telecommunications 4,919 4,619 4,951 4,653 4,864 4,978 5,078 5,168 5,248 5,321 5,386 5,445
Financial and insurance services 12,416 11,813 12,399 11,723 12,254 12,542 12,795 13,020 13,223 13,405 13,571 13,720
Rental hiring and real estate services 2,779 2,609 2,781 2,595 2,713 2,776 2,832 2,882 2,927 2,968 3,004 3,037
Professional scientific and technical services 33,208 33,527 33,023 33,408 34,922 35,741 36,461 37,104 37,681 38,202 38,673 39,098
Administrative and support services 11,252 11,359 9,524 10,931 11,427 11,695 11,930 12,141 12,329 12,500 12,654 12,793
Public administration and safety 39,195 41,659 44,453 41,968 43,870 44,898 45,803 46,610 47,335 47,990 48,581 49,115
Education and training 22,500 20,949 21,274 19,903 20,805 21,293 21,722 22,105 22,449 22,759 23,040 23,293
Health care and social assistance 26,596 24,374 25,551 23,487 24,551 25,127 25,633 26,085 26,491 26,857 27,188 27,487
Arts and recreations services 5,366 5,678 2,541 3,140 3,282 3,359 3,427 3,487 3,542 3,591 3,635 3,675
Personal Services 8,741 9,250 7,274 8,443 8,826 9,033 9,215 9,377 9,523 9,655 9,774 9,881
Total 260,700 262,783 248,266 246,134 257,289 263,322 268,629 273,362 277,616 281,453 284,921 288,055
Data tables 13Greater Wellington Region COVID-19 economic impact
Pipiri 2020
Table 5.3 Wellington region gross domestic product by industry 2019-2030
Total GDP ($millions) 2019 2020 2021 2022 2023 2024 2025 2026 2027 2028 2029 2030
Agriculture, fishing and forestry 461 464 459 477 503 520 535 550 564 578 591 603
Mining 591 595 564 611 645 666 687 705 724 741 757 773
Manufacturing 1,752 1,761 1,666 1,810 1,910 1,974 2,034 2,090 2,143 2,194 2,243 2,290
Electricity and waste services 1,025 1,030 1,012 1,059 1,117 1,155 1,189 1,222 1,254 1,283 1,312 1,340
Construction 1,823 1,833 1,688 1,883 1,988 2,054 2,116 2,174 2,230 2,283 2,334 2,383
Wholesale trade 1,143 1,147 1,079 1,159 1,223 1,264 1,302 1,338 1,372 1,405 1,436 1,467
Retail trade 1,702 1,703 1,425 1,649 1,740 1,798 1,853 1,904 1,952 1,999 2,044 2,086
Accommodation and food services 832 796 288 374 394 408 420 432 443 453 463 473
Transport, postal and warehousing 1,149 1,153 1,085 1,164 1,228 1,269 1,307 1,343 1,378 1,411 1,442 1,472
Information media and telecommunications 1,956 1,967 1,948 2,021 2,133 2,204 2,271 2,334 2,393 2,450 2,505 2,558
Financial and insurance services 3,231 3,244 3,146 3,284 3,466 3,582 3,690 3,792 3,889 3,981 4,070 4,156
Rental hiring and real estate services 717 720 709 731 771 797 821 844 865 886 905 925
Professional scientific and technical services 4,379 4,398 4,006 4,471 4,719 4,876 5,024 5,162 5,294 5,420 5,541 5,658
Administrative and support services 694 695 540 683 720 745 767 788 808 828 846 864
Public administration and safety 4,219 4,242 4,182 4,359 4,600 4,754 4,897 5,032 5,161 5,284 5,402 5,515
Education and training 1,549 1,549 1,454 1,502 1,586 1,639 1,688 1,735 1,779 1,821 1,862 1,901
Health care and social assistance 2,460 2,463 2,386 2,422 2,556 2,642 2,722 2,797 2,868 2,937 3,002 3,065
Arts and recreations services 539 521 218 297 314 324 334 343 352 360 368 376
Personal Services 465 464 338 433 457 472 486 500 512 525 536 547
Total 30,688 30,746 28,193 30,389 32,070 33,142 34,142 35,085 35,982 36,839 37,661 38,452
Data tables 14Greater Wellington Region COVID-19 economic impact
Pipiri 2020
Table 5.4 Wellington region population by age and territorial authority 2019-2030
Total Population 2019 2020 2021 2022 2023 2024 2025 2026 2027 2028 2029 2030
Kapiti Coast District
Child - up to 15 years 9,649 9,627 9,582 9,516 9,499 9,477 9,485 9,507 9,606 9,712 9,822 9,939
Young adult - 15 to 24 years 5,343 5,356 5,357 5,345 5,361 5,373 5,402 5,440 5,452 5,468 5,487 5,509
Adult - 25 to 64 years 25,042 25,093 25,084 25,016 25,078 25,125 25,250 25,414 25,625 25,856 26,097 26,357
Older adult - 65 years and over 15,129 15,427 15,686 15,903 16,200 16,486 16,821 17,182 17,460 17,751 18,049 18,362
Total 55,163 55,503 55,710 55,781 56,137 56,462 56,959 57,543 58,143 58,786 59,454 60,166
Porirua City
Child - up to 15 years 13,855 13,936 13,958 14,004 14,184 14,375 14,633 14,909 15,251 15,613 15,990 16,371
Young adult - 15 to 24 years 7,884 7,918 7,918 7,932 8,023 8,118 8,253 8,397 8,549 8,713 8,885 9,058
Adult - 25 to 64 years 29,594 29,853 29,986 30,168 30,639 31,133 31,775 32,457 33,141 33,872 34,634 35,404
Older adult - 65 years and over 7,274 7,523 7,738 7,963 8,264 8,571 8,921 9,286 9,590 9,908 10,235 10,566
Total 58,606 59,230 59,600 60,067 61,109 62,197 63,582 65,048 66,530 68,106 69,745 71,399
Upper Hutt City
Child - up to 15 years 8,825 8,792 8,742 8,671 8,655 8,659 8,683 8,719 8,762 8,817 8,868 8,916
Young adult - 15 to 24 years 5,290 5,226 5,153 5,068 5,017 4,977 4,949 4,927 4,952 4,984 5,013 5,040
Adult - 25 to 64 years 22,826 22,757 22,644 22,474 22,450 22,475 22,553 22,660 22,752 22,875 22,988 23,091
Older adult - 65 years and over 7,185 7,309 7,416 7,501 7,633 7,780 7,945 8,120 8,279 8,449 8,615 8,777
Total 44,126 44,084 43,955 43,714 43,755 43,892 44,131 44,426 44,746 45,124 45,484 45,824
Lower Hutt City
Child - up to 15 years 21,963 21,873 21,847 21,759 21,790 21,791 21,855 21,942 22,046 22,161 22,274 22,384
Young adult - 15 to 24 years 13,604 13,520 13,476 13,394 13,386 13,359 13,372 13,397 13,455 13,520 13,583 13,645
Adult - 25 to 64 years 54,999 54,933 55,026 54,961 55,198 55,357 55,676 56,054 56,337 56,653 56,961 57,262
Older adult - 65 years and over 15,136 15,396 15,698 15,952 16,293 16,609 16,974 17,357 17,717 18,087 18,456 18,823
Total 105,702 105,722 106,046 106,066 106,667 107,117 107,877 108,750 109,555 110,422 111,274 112,114
Wellington City
Child - up to 15 years 34,869 34,835 34,761 34,599 34,696 34,700 34,777 34,795 34,854 34,899 34,927 34,952
Young adult - 15 to 24 years 36,942 37,132 37,278 37,327 37,654 37,879 38,184 38,424 38,650 38,860 39,053 39,242
Adult - 25 to 64 years 114,761 115,087 115,278 115,173 115,928 116,370 117,055 117,542 117,851 118,111 118,315 118,509
Older adult - 65 years and over 26,352 27,483 28,574 29,580 30,800 31,936 33,136 34,279 35,211 36,131 37,037 37,941
Total 212,923 214,537 215,891 216,678 219,077 220,885 223,151 225,040 226,566 228,002 229,331 230,645
Wairarapa
Child - up to 15 years 8,609 8,620 8,606 8,560 8,560 8,558 8,580 8,606 8,654 8,708 8,759 8,807
Young adult - 15 to 24 years 4,938 4,950 4,949 4,929 4,936 4,942 4,961 4,983 5,003 5,025 5,047 5,067
Adult - 25 to 64 years 22,140 22,271 22,337 22,319 22,422 22,517 22,675 22,845 23,018 23,206 23,386 23,562
Older adult - 65 years and over 9,713 9,959 10,177 10,354 10,584 10,811 11,068 11,330 11,553 11,783 12,011 12,236
Total 45,400 45,800 46,069 46,162 46,503 46,828 47,284 47,764 48,228 48,722 49,202 49,671
Wellington Region
Child - up to 15 years 97,770 97,682 97,496 97,108 97,385 97,561 98,014 98,479 99,173 99,910 100,640 101,369
Young adult - 15 to 24 years 74,000 74,103 74,131 73,996 74,376 74,649 75,120 75,567 76,060 76,571 77,068 77,562
Adult - 25 to 64 years 269,363 269,994 270,356 270,112 271,714 272,977 274,985 276,971 278,726 280,573 282,381 284,184
Older adult - 65 years and over 80,788 83,097 85,288 87,253 89,773 92,193 94,865 97,554 99,809 102,109 104,403 106,705
Total 521,920 524,876 527,271 528,469 533,248 537,380 542,984 548,571 553,768 559,163 564,492 569,821
Data tables 15You can also read