Indian Railway Finance Corporation Ltd - Issue Opens Monday, January 18, 2021 Wednesday, January 20, 2021 - Progressive Share ...
←
→
Page content transcription
If your browser does not render page correctly, please read the page content below

Indian Railway Finance Corporation Ltd

        Issue Opens            Monday, January 18, 2021
        Issue Closes         Wednesday, January 20, 2021
      Price Band (in Rs)                 25/26
           Bid Lot         575 shares and multiples thereafter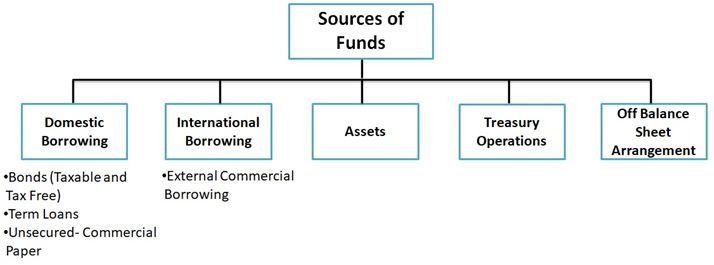
IPO UPDATE
Indian Railway Finance Corporation Limited
Industry Overview: SNAPSHOT
Issue Opens Monday, January 18, 2021
Indian Railways: (IR):
IR has the largest rail network in Asia, Exhibit 01: Route kms per mn Wednesday, January 20,
Issue Closes
running approx. 13,452 trains every Population (2017) 2021
day to transport approximately 22.70 Country Route kms per mn Price Band (Rs) 25/26
million passengers per day in FY18. As population 575 shares and multiples
of 31st March, 2019, the total Bid Lot
thereafter
running track kms was approx. USA 464
96,552kms, while the total freight Face Value Rs10
Russia 592
traffic per day was 3.19MT in FY18. Listing BSE & NSE
Japan 134
The IR employs around 1.27 million
people. The IR have been on an France 437 Type of Issue Offer for Sale & Fresh Issue
uptrend with revenues increasing Fresh Issue 30,889
China 49
from approx. Rs1,653bn in FY17 to
Offer Size (Rs Mn) OFS 15,445
Rs1,787bn in FY18. However globally, India 50
India still has one of the lowest rail Total 46,334
Germany 405
route kms per million population. *Implied Market Cap
Source: Company RHP, Progressive Research 3,39,781
(Rs Mn)
P/E (based on FY21 Earnings
The IR earns its internal revenue primarily from passenger and freight traffic. annualized)*
9.0
Freight movement:
The Indian railway along with national highways and port are the backbone *Note: Implied Market Cap & P/E are calculated at upper price
of India’s transportation wherein around 30% (in terms of tonne kms) of band of Rs26
freight is transported on rail. Freight remains the major revenue-earning Issue Allocation
segment for the Indian Railways, it utilises one-third of its capacity and
generates two-thirds of Indian Railway’s revenues. Reservations % of Net Issue
QIB 50
Exhibit 02: Freight Tonnage Originated and Earnings
NIB 15
Retail 35
Total 100
Employee Reservation: Upto Rs5mn
Object of the Offer
Augmenting our equity capital base to meet IRFC’s
future capital requirements arising out of growth in
its business
Source: Company RHP, Progressive Research
General corporate purposes
As a carrier of bulk freight, such as ores and minerals, iron and steel, cement,
mineral oils, food grains and fertilizers, and containerized cargo, the IR plays
a significant role in various industries. IR generates most of its freight
revenue from the transportation of coal, cement, iron ore and food-grains,
which accounted for 45.84%, 8.47%, 7.76% and 7.40%, respectively, of the
total earnings from bulk commodities in FY18. The IR goods earnings
increased from approx. Rs1,020bn in FY17 to Rs1,135bn in FY18.
To improve freight traffic, in FY18, the MoR implemented several policies
such as:
liberalising automatic freight rebate scheme in empty flow directions
(routes with low freight traffic)
entering into long term tariff contracts with key freight customers, and
introducing double stack dwarf containers as a new delivery model to
increase load-ability of trains and attract new traffic under wire
advent of DFC
Please Turn Over Page No 1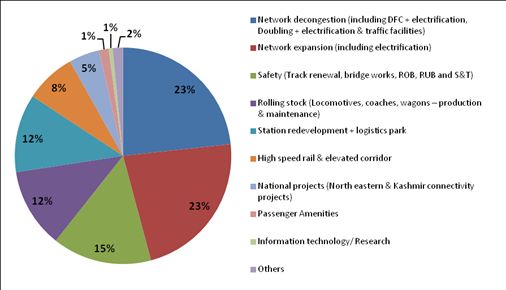
IPO UPDATE
Indian Railway Finance Corporation Limited
Industry: (contd.)
Exhibit 03: Passenger Originated and Earnings
Passenger traffic:
Passenger trains utilise two-thirds of capacity, however, generate only
one-third of revenues for the IR. Even now train travel remains the
preferred means for long-distance travel for a majority of Indians and
with urbanisation, improving income standards and increasing
population, technologically advanced trains with amenities, passenger
traffic is expected to grow further, which will entail major
investments and capital outlay.
Track/Route kilometres and Stations:
IR has constantly added tracks to enable wider reach and focuses on
connectivity throughout India. The capacity augmentation including
electrification remains a focus area for the IR and GoI provides for a
significant share in the IR budget for electrification every year. Source: Company RHP, Progressive Research
Exhibit 04: Total Running Track vs Electrified Exhibit 05: Route vs Electrified
Source: Company RHP, Progressive Research Source: Company RHP, Progressive Research
As of March 31, 2019, the IR had 34,035 (provisional) route kilometres of network commissioned on electric traction. This
constituted approximately 52% of the total network and carried approximately 65% of freight and approximately 54% of
coaching traffic. The rate of electrification has accelerated in India and a total of 38,000 route kilometres have been identified for
electrification by 2021.
In line with improvement in connectivity, number of train stations has also witnessed growth from 7137 in 2015 to 7401 in 2019.
Capital Investments in Railways:
Increasing investment in railways was identified as a top Exhibit 06: Capex Plan for FY16-20
priority to increase capacity and provide safety, while increas-
ing freight and passenger share of railways. The MoR has thus
increased capital investment and the amount of investment
made during FY15-17, was approximately 75% of the total
investment made in the IR during FY04-14
The IR had laid down a capital expenditure plan from FY16-20
of Rs8,560.2bn. The allocation of which is in the diagram
below
The capital investment plan for FY16-20 focuses on
Network Decongestion:
Enhancing outlay for doubling third and fourth line projects
Developing dedicated freight corridors
Network Expansion including electrification Source: Company RHP, Progressive Research
Safety
Station Redevelopment
High Speed Railway and Elevated Corridors
Rolling Stock
Locomotives and coaches
Please Turn Over Page No 2
IPO UPDATE
Indian Railway Finance Corporation Limited
Industry: (contd.)
Sources of Funding: The primary sources of funds for the planned capital outlay of the IR are GBS, internally generated funds,
public private partnerships and market borrowings leasing through IRFC and other sources (EBR-IF), railway safety fund and
RRSK. Total annual outlay for proposed capital expenditure for FY20 has been budgeted at Rs1,602bn comprising gross
budgetary support of Rs661.05bn, internal resources of Rs105bn and extra budgetary resources of Rs835.71bn consisting of
marketing borrowings, public private partnership and institutional financing.
Exhibit 07: IR Actual Capital Outlay and Sources of Financing
Market Borrowing
Period Capital Gross Internally Public Railway RRSK
IRFC EBR-IF
Outlay Budgetary Generated Private Safety Fund
through
Support Funds Partnership
IRFC
FY19 1,334 349 16 243 237 279 30 180
FY18 1,020 270 18 221 188 146 16 161
FY17 1,083 345 105 268 143 115 107 -
FY16 935 350 168 151 141 99 26 -
FY15 587 301 153 - 110 - 22 -
FY14 540 271 97 - 152 - 20 -
FY13 503 241 95 - 151 - 16 -
Source: Company RHP, Progressive Research
Gross Budgetary Support (GBS): GOI supports IR in the form of a Exhibit 08: Break-up Capex Plan for FY16-20
GBS in order to expand its network and invest in capex, wherein in
FY20, the GBS from the central Government is proposed to be
Rs661.05bn.
Internally Generated Funds: The IR’ internal resources are
primarily utilized for replacement, renewals, upgrades and
modernization of existing infrastructure. The internal resource
generation is significantly dependent on the economic growth as
freight revenues form a major part.
Railway Safety Fund and RRSK: The railway safety fund actual Source: Company RHP, Progressive Research
capital outlay has increased from Rs16bn in FY18 to Rs30bn in
FY19. The RRSK fund has an amount Rs1,000bn over a period of 5years, with an annual outlay of Rs200bn.
Public Private Partnerships (PPP): The IR proposed capital expenditure plan from FY16-FY20 comprises Rs1,300bn in PPP. The IR
has also approved 2 new locomotives factories in Bihar with a combined order book of Rs400bn over 10 years, one of the largest
FDI investment projects of the IR in India. PPP estimated contribution was Rs270bn in FY19 and is estimated to contribute
Rs281bn in FY20.
Market Borrowings/ Debt: Extra budgetary resource support from the GOI is proposed to be Rs836bn in FY20, which has
increased from Rs759bn in FY19. The IR has planned to borrow Rs2.50tn from IRFC, including Rs1tn for Rolling Stock Assets, to
fund its proposed capital expenditure from FY16 to FY20. The IR/ RVNL have borrowed an amount of Rs236.86bn, Rs274.88bn,
Rs335.22bn and Rs525.35bn in FY16, FY17, FY18 and FY19, from IRFC. The MoR has indicated its intention to borrow Rs554.71
billion from IRFC in FY20. As of 31st March, 2019, the cumulative funding by IRFC to the MoR amounted to Rs2,688.67bn.
Foreign Direct Investment: GOI has permitted 100% FDI on automatic route in the following areas of railway infrastructure:
Suburban corridor projects through PPPP
High speed train projects
Dedicated freight lines
Rolling stock including train sets, and locomotives or coaches manufacturing and maintenance facilities
Railway Electrification
Signalling systems
Freight terminals
Passenger terminals
Infrastructure in industrial park pertaining to railway lines or sidings including electrified railway lines and connectivities to
main railway
Please Turn Over Page No 3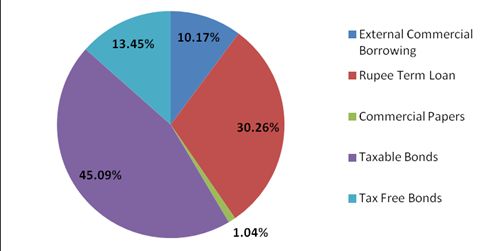
IPO UPDATE
                              Indian Railway Finance Corporation Limited

About the Company:                                                         Exhibit 09: Financing Model
Indian Railway Finance Company (IRFC) is a wholly owned company of
GOI acting through the Ministry of Railways (MoR) and is registered with
the RBI as a NBFC-ND-IFC. IRFC is in the primary business of financing
the acquisition of rolling stock assets, which includes both powered and
unpowered vehicles and other items of rolling stock components and
national projects of GOI. IRFC leases the same to MoR and ministries
under MoR and transfers ownership post completion of leasing period.
It is the dedicated market borrowing arm of the IR. The company
supports the capital expenditure of IR by financing part of its annual
outlay. The company generally leases Rolling Stock Assets for a period
of 30 years comprising primary period of 15 years and secondary period
of 15 years (unless mutually revised). The principal amount pertaining to
the leased assets is effectively payable during the primary 15 years lease
period, along with the weighted average cost of incremental borrowing
and an additional margin determined by the MoR in consultation with
IRFC at the end of each Fiscal. During the secondary period a nominal         Source: Company RHP, Progressive Research
amount of Rs1lakh per annum shall be payable for the 15 year period or
until the Rolling Stock Assets are sold out to the MoR or any other buyer before the completion of the lease period. For project
asset, the company follows lease periods of 15 to 30 years depending on the mode of raising funds. At the end of 30 years, the
assets are to be transferred to the MoR for a nominal price of Rs1 plus applicable taxes, if any.
   Exhibit 10: AUM Break-up (Sept, 2020)                           Exhibit 11: IRFC Share in Rolling Stock of IR as on Mar, 2019

    Source: Company RHP, Progressive Research                        Source: Company ‘s PPT, Progressive Research

Competitive Strengths:
Financing Growth of IR: The Union Budget proposed a capital expenditure of Rs1,610bn for the IR for FY21, which was higher
than the capital expenditure of Rs1,480.64bn in FY20. The outlay for FY21 comprises Rs702.50bn from gross budgetary support,
Rs75bn from internal resources and Rs832.92bn from extra budgetary resources. In FY20, IRFC financed Rs713.92bn accounting
for 48.22% of the actual capital expenditure of the IR and in FY21 the management expects to finance 70% of the total outlay
expected. MoR, through its letter dated 7th January, 2021, has upped the target to be borrowed from IRFC to Rs625.67bn for
FY21, including Rs331.37bn for rolling stock, Rs14.30bn for projects being executed by RVNL and Rs280bn for projects under
EBR-IF. In September, MoR further indicated its intention to additionally borrow Rs530bn from IRFC.
Competitive Cost of Borrowings: In addition to the equity infusion from GOI, IRFC funds acquisitions of Rolling Stock Assets and
Project Assets through market borrowings of various maturities and currencies. It also sources external commercial borrowings
in the form of syndicated foreign currency term loans, issuance of bonds/ notes in offshore markets at competitive rates.
Company’s diversified sources of funding, credit ratings and strategic relationship with the MoR, have enabled IRFC to keep its
cost of borrowing competitive. Its Cost of Borrowings was 6.82%, 7.09% and 7.27% in FY18, FY19 and FY20, respectively, and
3.91% and 3.55% (non-annualized) in the 6 months ended 30th September, 2019 and 2020, respectively. Additionally, the
company maintains the highest possible credit ratings for an Indian issuer both for domestic and international borrowings i.e.
CRISIL – CRISIL AAA and CRISIL A1+, ICRA – ICRA AAA and ICRA A1+, and CARE – CARE AAA and CARE A1+. It have also been
accorded with Baa3 (Negative) rating by Moody’s, BBB- (Stable) rating by Standard and Poor’s, BBB- (Negative) rating by Fitch
and BBB+ (Stable) rating by Japanese Credit Rating Agency.

Strong Asset-Liability Management: IRFC manages its assets and liabilities in a manner to minimise asset-liability mismatches.
The company maintains satisfactory levels of liquidity to ensure availability of funds at any time to meet operational and
statutory requirements. Additionally, if the company faces shortfall of funds during a fiscal year, the MoR is required under the
SLA to provide for such shortfall, through bullet payments in advance prior to maturity of the relevant bonds or term loans.

Please Turn Over                                                                                                          Page No 4
IPO UPDATE
Indian Railway Finance Corporation Limited
About the Company (contd.):
Consistent Financial Performance and Cost Plus Model: IRFCs cost plus based Standard Lease Agreement (SLA) with the MoR has
been a positive for the company even though the margin is relatively low. The margin charged by the company in FY20 was 40bps
over the weighted average cost of incremental borrowing for financing Rolling Stock Assets and a spread of 35bps over the weighted
average cost of incremental borrowing for financing Project Assets. Margin charged by the company more or less revolves around
these numbers and is finalized every fiscal for that year and is rarely retrospective. IRFC also follows cost-plus pricing model for
financing other PSU Entities, which typically provide for a relatively higher margin. Company’s NIM in FY18, FY19, FY20 and six
months ended September, 2020 was 1.83%, 1.57%, 1.38% and 0.71% in FY18, FY19 and FY20, respectively.
Exhibit 12: Financing of Rolling Stock Assets
Period Cost to MoR Weighted Average Cost of incremental Margin on Incremental Rolling
Borrowing to IRFC for financing Stock Assets leased
Rolling Stock Assets
FY18 8.05% 7.75% 0.30%
FY19 8.49% 8.09% 0.40%
FY20 7.77% 7.37% 0.40%
Source: Company RHP, Progressive Research
Low Risk Business Model: The company has a lowrisk-model as MoR has historically never defaulted in its payment obligations
under the SLA and lease payments to IRFC by the MoR form part of the annual railway budget in the Union Budget of India. MoR is
also required to indemnify IRFC at all times from and against any loss or seizure of the Rolling Stock Assets under distress, execution
or other legal process. Company’s expense incurred with respect to any foreign currency hedging costs and/ or losses (and gains, if
any) as well as any hedging costs for interest rate fluctuations are built into the weighted average cost of incremental borrowing.
Experienced Senior Management: As of September 30, 2020, IRFC had 100 employees where 26 were permanent employees.
The Key Business Strategies: diversification of borrowing portfolio, broaden the financing portfolio, continued focus on asset-liability
management and provide advisory and consultancy services and venture into syndication activities.
Sources of Funding:
Exhibit 13: Sources of Funds Exhibit 14: Total Borrowing as of Sept, 2020
Source: Company RHP, Progressive Research Source: Company ‘s PPT, Progressive Research
Risk and Concerns
Credit Risk
Operational Risk
Foreign Exchange Risk
Interest Rate Risk
Technology
Insurance
Financial:
Total revenue from operations increased by 22.15% to Rs134.21bn in FY20 as compared to Rs109.87bn and was Rs73.84bn in the 6
months ended 30th September, 2020. Profit grew from Rs31.92bn as compared to Rs21.39bn in FY19 and Rs18.86bn in 6 months
ended 30th September, 2020. Company’s low overhead and administrative costs and high operational efficiency has resulted in
increased profitability. Its employee benefit expenses were merely Rs62.65mn in FY20 and Rs26.54mn in six months ended 30th
September, 2020, respectively and accounted for 0.05% and 0.04% of the total income, respectively. IRFC is not liable to pay tax
owing to huge unabsorbed deprecation and it is also not subject to GST.
Please Turn Over Page No 5IPO UPDATE
Indian Railway Finance Corporation Limited
Financial (contd.):
Exhibit 15: Financials Snapshot
Particulars (Rs mn) FY18 FY19 FY20 H1FY21
Share Capital 65,264.6 93,804.6 1,18,804.6 1,18,804.6
Net worth 2,03,242.8 2,48,663.0 3,02,997.5 3,16,869.7
Total Borrowings 13,40,055.3 17,39,326.8 23,43,767.2 24,53,493.2
Total Receivables 10,94,716.6 12,50,265.1 14,85,798.0 15,38,468.1
Revenue 92,069.7 1,09,873.5 1,34,210.2 73,831.2
Profit after tax 20,014.6 21,399.3 31,921.0 18,868.4
AUM 15,45,347 20,09,373 26,61,370 27,80,076
EPS 3.1 3.3 3.4 1.6
NAV per share (Rs) 31.1 26.5 25.5 26.7
Key Ratios: FY18 FY19 FY20 H1FY21
RoNW (%) 12.33% 9.47% 11.57% 6.09%
RoA (%) 1.38% 1.16% 1.32% 0.66%
CRAR (Basel-III norms) (%) 320.58% 347.14% 395.39% 433.92%
Gross NPA (%) NIL NIL NIL NIL
NIM (%) 1.83% 1.57% 1.38% 0.71%
Source: Company RHP, Progressive Research
Outlook and Recommendations:
IRFC is the only dedicated borrowing arm of IR, financing rolling stock assets and project assets (being a pioneer in project asset
financing), thus presenting a low-risk business model like no other. The company has managed to attain the highest possible
credit rating from domestic as well as international credit agencies. IRFC has strong financials owing to effective management of
overheads costs along with low cost borrowing due to diversified sources of funding, prudent management and consistent
margins. Growth story remains intact with the NIP, expansion and capacity enhancement plans of IR and electrification intended
by IR. Furthermore, the company also intends to finance reputed private players for rolling stock assets and other railway
infrastructure in times to come, thus providing a fillip to additional growth opportunities. Downside risks are limited as
receivables are backed by the union budget and the bi-annual payment model by MoR, works well for the company. The IPO is
priced attractively with upper price band at 1x of its Book Value Per Share as on 30th September, 2020 and at a PE of 9x
(annualized earnings of half year ending September, 2020). Considering these factors, one can make an investment in this
pioneer of project asset financing company from a long term perspective.
Page No 6IPO UPDATE
Indian Railway Finance Corporation Limited
DISCLAIMERS AND DISCLOSURES-
Progressive Share Brokers Pvt. Ltd. and its affiliates are a full-service, brokerage and financing group. Progressive Share Brokers Pvt. Ltd. (PSBPL) along with its affiliates
are participants in virtually all securities trading markets in India. PSBPL started its operation on the National Stock Exchange (NSE) in 1996. PSBPL is a corporate
trading member of Bombay Stock Exchange Limited (BSE), National Stock Exchange of India Limited (NSE) for its stock broking services and is Depository Participant
with Central Depository Services Limited (CDSL) and is a member of Association of Mutual Funds of India (AMFI) for distribution of financial products.
PSBPL is SEBI registered Research Analyst under SEBI (Research Analysts) Regulations, 2014 with SEBI Registration No. INH000000859. PSBPL hereby declares that it
has not defaulted with any stock exchange nor its activities were suspended by any stock exchange with whom it is registered in last five years. PSBPL has not been
debarred from doing business by any Stock Exchange / SEBI or any other authorities; nor has its certificate of registration been cancelled by SEBI at any point of time.
PSBPL offers research services to clients as well as prospects. The analyst for this report certifies that all of the views expressed in this report accurately reflect his or
her personal views about the subject company or companies and its or their securities, and no part of his or her compensation was, is or will be, directly or indirectly
related to specific recommendations or views expressed in this report.
Other disclosures by Progressive Share Brokers Pvt. Ltd. (Research Entity) and its Research Analyst under SEBI (Research Analyst) Regulations, 2014 with reference to
the subject company (s) covered in this report-:
· PSBPL or its associates financial interest in the subject company: NO
· Research Analyst (s) or his/her relative's financial interest in the subject company: NO
· PSBPL or its associates and Research Analyst or his/her relative's does not have any material
conflict of interest in the subject company. The research Analyst or research entity (PSBPL) has not been engaged in market making activity for the subject company.
· PSBPL or its associates actual/beneficial ownership of 1% or more securities of the subject company at the end of the month immediately preceding the date of
publication of Research Report: NO
· Research Analyst or his/her relatives have actual/beneficial ownership of 1% or more securities of the subject company at t he end of the month immediately
preceding the date of publication of Research Report: NO
· PSBPL or its associates may have received any compensation including for brokerage services from the subject company in the past 12 months. PSBPL or its associates
may have received compensation for products or services other than brokerage services from the subject company in the past 12 months. PSBPL or its associates have
not received any compensation or other benefits from the Subject Company or third party in connection with the research report. Subject Company may have been
client of PSBPL or its associates during twelve months preceding the date of distribution of the research report and PSBPL may have co-managed public offering of
securities for the subject company in the past twelve months.
· The research Analyst has served as officer, director or employee of the subject company: NO
PSBPL and/or its affiliates may seek investment banking or other business from the company or companies that are the subject of this material. Our sales people,
traders, and other professionals may provide oral or written market commentary or trading strategies to our clients that reflect opinions that are contrary to the
opinions expressed herein, and our proprietary trading and investing businesses (if any) may make investment decisions that may be inconsistent with the
recommendations expressed herein. In reviewing these materials, you should be aware that any or all of the foregoing, among other things, may give rise to real or
potential conflicts of interest including but not limited to those stated herein. Additionally, other important information regarding our relationships with the company
or companies that are the subject of this material is provided herein. This report is not directed to, or intended for distribution to or use by, any person or entity who is
a citizen or resident of or located in any locality, state, country or other jurisdiction where such distribution publication, availability or use would be contrary to law or
regulation or which would subject PSBPL or its group companies to any registration or licensing requirement within such juris diction. If this document is sent or has
reached any individual in such country, especially, USA, the same may be ignored. Unless otherwise stated, this message should not be construed as official confirma-
tion of any transaction. None of the material, nor its content, nor any copy of it, may be altered in any way, transmitted to, copied or distributed to any other party,
without the prior express written permission of PSBPL. All trademarks, service marks and logos used in this report are trademarks or registered trademarks of PSBPL or
its Group Companies. The information contained herein is not intended for publication or distribution or circulation in any manner whatsoever and any unauthorized
reading, dissemination, distribution or copying of this communication is prohibited unless otherwise expressly authorized. Please ensure that you have read “Risk
Disclosure Document for Capital Market and Derivatives Segments” as prescribed by Securities and Exchange Board of India before investing in Indian Securities
Market. In so far as this report includes current or historic information, it is believed to be reliable, although its accuracy and completeness cannot be guaranteed.
Terms & Conditions:
This report has been prepared by PSBPL and is meant for sole use by the recipient and not for circulation. The report and information contained herein is strictly
confidential and may not be altered in any way, transmitted to, copied or distributed, in part or in whole, to any other person or to the media or reproduced in any
form, without prior written consent of PSBPL. The report is based on the facts, figures and information that are considered t rue, correct, reliable and accurate. The
intent of this report is not recommendatory in nature. The information is obtained from publicly available media or other sources believed to be reliable. Such
information has not been independently verified and no guaranty, representation of warranty, express or implied, is made as to its accuracy, completeness or
correctness. All such information and opinions are subject to change without notice. The report is prepared solely for informational purpose and does not constitute
an offer document or solicitation of offer to buy or sell or subscribe for securities or other financial instruments for the clients. Though disseminated to all the
customers simultaneously, not all customers may receive this report at the same time. PSBPL will not treat recipients as customers by virtue of their receiving this
report.
Registered Office Address: Compliance Officer:
Progressive Share Brokers Pvt. Ltd,
Mr. Shyam Agrawal,
122-124, Laxmi Plaza, Laxmi Indl Estate,
New Link Rd, Andheri West, Email Id: compliance@progressiveshares.com,
Mumbai-400053;
Contact No.:022-40777500.
www.progressiveshares.com | research@progressiveshares.comYou can also read