Azimut Group Fixed Income Presentation - Milan, November 2019
←
→
Page content transcription
If your browser does not render page correctly, please read the page content below
Azimut Group
Fixed Income Presentation

        Milan, November 2019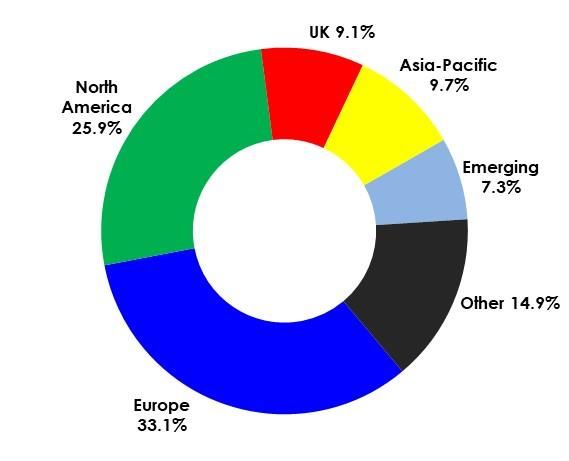
Disclaimer

This presentation contains certain forward-looking statements that reflect the Company’s management’s current views with respect
to future events and financial and operational performance of the Company and its subsidiaries. These forward-looking statements
are based on the Company’s current expectations and projections about future events. Because these forward-looking statements
are subject to risks and uncertainties, actual future results or performance may differ materially from those expressed in or implied by
these statements due to any number of different factors, many of which are beyond the ability of the Company to control or
estimate precisely, including changes in the regulatory environment, future market developments, fluctuations in the price and
availability of fuel and other risks. The Company undertakes no obligation to publicly update or revise any forward-looking
statements, whether as a result of new information, future events or otherwise, except as may be required by applicable law. The
information and opinions contained in this presentation are provided as at the date hereof and are subject to change without
notice. Neither this presentation nor any part of it nor the fact of its distribution may form the basis of, or be relied on or in connection
with, any contract or investment decision.

The information contained in this presentation does not purport to be comprehensive and has not been independently verified by
any independent third party. This presentation does not constitute a recommendation regarding the securities of the Company.

This presentation does not contain an offer to sell or a solicitation of any offer to buy any securities issued by the Company or any of
its subsidiaries. Pursuant to art. 154-bis, paragraph 2, of the Italian Unified Financial Act of February 24, 1998, the executive in charge
of preparing the corporate accounting documents at the Company, Alessandro Zambotti, declares that the accounting
information contained herein correspond to document results, books and accounting records.

                                                                        2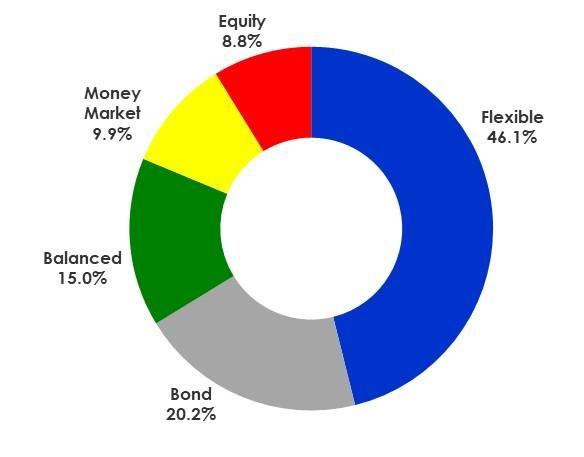
Table of Contents

Azimut at a glance                               2

Management team                                   8

Business model                                   11

A history of delivering on our promises          14

Asset Management                                 17

Distribution                                     25

Geographical diversification & funds breakdown   28

Results highlights                               34

Debt overview & the Transaction                  41

About Azimut                                     46

                                            3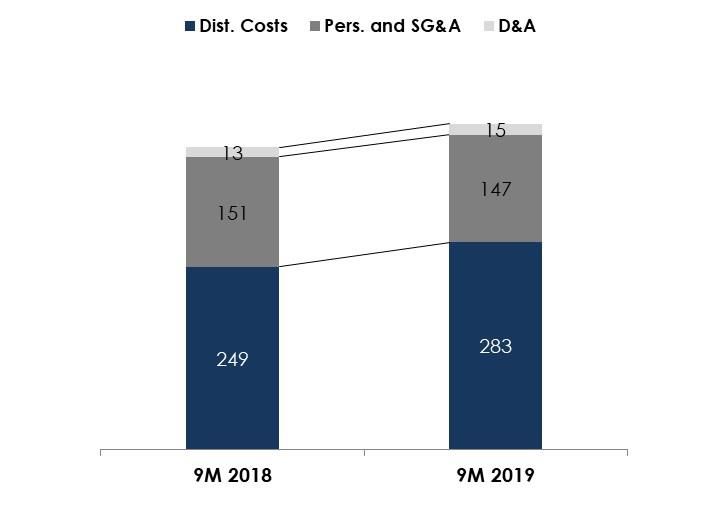
Azimut Group key highlights

Best-in-class performance leading to solid P&L results

                             FY 2018 Total Revenues: €748.5mln (vs. €810mln in FY 2017)
Financial                    FY 2018 Net Profit: €144.7mln (vs. €220.1mln in FY 2018)
Results                      9M 2019 Total Revenues: €724 mln (vs. €566mln in 9M 2018)
                             9M 2019 Net Profit: €247mln (vs. €112mln in 9M 2018)

                             Total Assets at 30/09/2019: €57.4bn (CAGR of 16.5% in the last 10 years)
Inflows &                    Net Inflows at 30/09/2019 : €3.7bn
AUM                          2019 Net New Money / Total Assets at 10%
                             So far in 2019, total net weighted average performance to clients at +6.9%

                             Undisputed leader thanks to an effective and unique business model with ca. 95 Investment
                             Professionals and almost 1,800 proprietary Financial Advisors in Italy
Business
                             Best international diversification vs Italian players (counting today for 29% of Total Assets and
Model
                             18% of FY 2018 Group Revenues)
                             Disrupted the traditional Private Markets segment in Italy (target 15%+ of Total Assets by 2024)

                             One of the best success stories in Italy and the only true Italy-based Global Asset Manager:
Alignment of                        +813% Total Return since IPO
Interest                            24% controlled by Managers, Investment Professionals, Financial Advisors & Employees
                                    Remaining is free float, as a true public company

Source: Azimut, Bloomberg.
                                                               4
Azimut key characteristics
A unique business model focused on long term value creation
Highly integrated business model
We are totally independent from
(manufacturing and distribution),
banking, insurance or industrial
ensuring a correct asset
groups. This allows us to operate
without any kind of bias
Independent Integrated allocation approach meeting
the clients risk/return expectations
Management, PMs, Aligned Innovative Our business model sets a new
Financial Advisors and
benchmark around the world,
employees are all long term
introducing unique innovative
shareholders, working to create
funds in different asset classes
value for all stakeholders
5The integration between production and distribution
A successful business model both in Italy and abroad
1) PRODUCTION 2) DISTRIBUTION 3) CLIENTS
PMs / Analysts: Financial Advisors and > 220k clients
Wealth Managers: around the world
> 95 Investment Professionals
across Europe, Asia-Pacific > 2,000 financial advisors
worldwide > 90% retail (mostly
and the Americas Asset upper affluent / HNW)
+ Financial Advice
Management Commercial agreements
Managing and offering: Asset allocation > 10% institutional
Products with small Italian banks
mutual and alternative funds, + (banks, pension
discretionary portfolios Agreements with banks and funds, insurance
insurance & trust services 3rd party distributors globally companies,
foundations, SWFs)
Azimut insiders (top management, PMs, Financial Advisors and Employees) are the
major single shareholder with 24% of share capital. The remaining is free float.
Asset growth & Sustainable Cash
Fees Profits
performance Flow Generation
ALL STAKEHOLDERS SHARE THE SAME INTERESTS
6Azimut’s shareholder base as of 9M 2019
One of the few true public companies
Timone Fiduciaria represents the shares of over 2,000 Breakdown by investor:
individual shareholders (FAs, employees, managers
BlackRock 4.2%
working for Azimut) and Peninsula Capital, tied up in a Harris Assoc. 3.0%
strong shareholders’ agreement Norges Bank 2.4%
Vanguard 2.2%
More than 1,200 participants of the shareholders
agreement together with Peninsula Capital, invested in Timone Fiduciaria 24.4%
Azimut shares in June 2018 thereby increasing Timone’s
stake up to ca. 24% from the previous ca. 15%. Other 63.8%
Shareholding breakdown: Breakdown by geography*:
Tresury Shares Timone Fiduciaria
2% 21.7% Other 15%
24.4% Spain 3%
Finland 3%
Norway 8%
US 56%
Peninsula
2.7%
Free Float
74% UK 15%
Source: Azimut, Bloomberg, Nasdaq. November. 2019
Note*: excluding Timone 7 7One of a kind transaction: Timone MBO
In June 2018 completed the most significant investment in Azimut Holding stock since the IPO
✓ Timone strengthened it’s stake in Azimut Key Metrics
Holding from 15.8% to 24.0%
✓ Participation of more than 1,200 colleagues
from 14 countries worldwide
̴11
Timone: €100m
Debt mln Azimut shares
Total Investment: €155m
✓ LBO: financed 50% through equity raised by
Transaction
Timone members and 50% through bank €50m
Summary
14.4
debt, secured by a pledge on shares
acquired and a cash collateral € avg share price(1)
✓ Peninsula joined the deal acquiring at Equity
settlement ca. 3.8m shares (2.7% of share
capital)
€50m
̴8 % stake acquired
Peninsula
✓ Strengthen and provide additional stability
to Azimut governance with strong and
renewed commitment to the market
€55m
24.0 % resulting stake
✓ Provide additional levered upside to existing
Strategic (younger) Timone members, considering the
Rationale stock is significantly undervalued Shareholding structure:
✓ Messages reinforced by the involvement of Pre (10 May 2018) Today
a leading financial investor (Peninsula)
Tresury Shares Tresury Shares Timone Fiduciaria
sharing the same view 9.0% 2% 21.7%
Timone Fiduciaria 24.4%
15%
✓ January 2018: Transaction announced
Timeline ✓ June 2018: Transaction completed Peninsula
2.7%
✓ June 2021: maturity of debt financing
Free Float Free Float
76.0% 74%
Source: Company data on public available information
Note (1): related to original Timone members 8 8Table of Contents
Azimut at a glance 2
Management team 8
Business model 11
A history of delivering in our promises 14
Asset Management 17
Distribution 25
Geographical diversification & funds breakdown 28
Results highlights 34
Debt overview & the Transaction 41
About Azimut 46
9A strong management team…
New management, same cost for the firm, same team
✓ CEO, Global Head of Azimut Group
Gabriele Milan
✓ Previously Head of International Operations and Business Development
Blei based
✓ Over 15 years of experience in the Brokerage and Asset Management sector
✓ Co-CEO, Global Head of Distribution
✓ Previously Head of Asia-Pacific region Hong
Massimo
✓ Over 22 years of experience in Investment Banking, Asset and Kong
Guiati
Wealth Management based
✓ Co-CEO & MD, Head of Distribution Italy, Global Head of Marketing,
Pietro Alternatives
Paolo Milan
Giuliani Martini
✓ Previously Commercial Director Italy and Co-Managing Director
based
✓ Over 20 years experience in commercial, marketing and distribution
Chairman functions
✓ Co-CEO, Global Head of Asset Management
Giorgio ✓ Previously Head of Turkey and MENA region and Portfolio Manager Lux.
Medda ✓ Over 20 years of experience in Research, Sales & Trading and based
Asset Management
✓ Co-CEO & CFO
Alessandro ✓ Previously Finance Director Milan
Zambotti ✓ Over 13 years of experience in the financial services, accounting and based
administration sectors
10…with a longstanding experience within Azimut
A complementary set of expertise coupled with proven ability to deliver on the field
'89 '90 '98
'91 '99 '00 '94
'92 '93 '01 '95
'02'96
'03'97'04'98'05
'99'06
'00 '07
'01 '08 '09 '04
'02 '03 '10 '05
'11'06
'12'07'13'08'14
'09 '15
'10 '16
'11 '17 '18 '14
'12 '13 '19 '15 '16
Pietro Giuliani
Founder & Chairman Azimut
Gabriele Blei
Global Head of Azimut Azimut
Group
Massimo Guiati
Global Head of Distribution Azimut
Paolo Martini
Head of Distribution Italy,
Global Head of Marketing, Azimut
Alternatives
Giorgio Medda
Global Head of Asset Azimut
Management
Alessandro Zambotti
Global Head of Finance & Azimut
Admin.
11 11Table of Contents
Azimut at a glance 2
Management team 8
Business model 11
A history of delivering on our promises 14
Asset Management 17
Distribution 25
Geographical diversification & funds breakdown 28
Results highlights 34
Debt overview & the Transaction 41
About Azimut 46
12A reshuffle of traditional markets towards a new vision
Continuous growth across business lines, with a stronger contribution from Private Markets
Total Assets Breakdown
2019 2024
Private
Markets &
Alternatives
Private
Markets &
Alternatives >15% International
and/or
1% Emerging
Markets
International 35%
29% and/or Emerging
Markets
Traditional /
70%
Developed
Markets 50%
Traditional /
Developed
Markets
Source: Company data
13A diversified business model for sustainable, l/t growth
Azimut.
Integrated Distribution and Asset Management platform
Public Markets Private Markets Emerging Markets
➢ Mutual Funds ➢ Private Equity ➢ Local Asset
➢ Private Credit Management
➢ Separate Managed
Accounts ➢ Mutual Funds
➢ VC & Start-Ups
➢ Unit Linked ➢ Separate Managed
➢ Real Estate and Social
Infrastructure Accounts
➢ Advisory
➢ IPO Club & Club Deals
Total Assets Evolution
57.4
50.4 50.8
43.6
36.7
30.0
24.0
19.6
13.9 15.7 15.8 16.5 16.5
11.6 13.0
8.7
2004 2005 2006 2007 2008 2009 2010 2011 2012 2013 2014 2015 2016 2017 2018 Sep-19
Source: Company data
14Table of Contents
Azimut at a glance 2
Management team 8
Business model 11
A history of delivering on our promises 14
Asset Management 17
Distribution 25
Geographical diversification & funds breakdown 28
Results highlights 34
Debt overview & the Transaction 41
About Azimut 46
15Delivered on all Business Plans since IPO
Strong track record on all Business Plans since IPO
2005-2009 Plan 2010-2014 Plan 2015-2019 Plan
Target Actual Status Target Actual Status Target Actual Status
Total Assets €27bn €29bn €50bn €57.4bn
Of which ex- €14bn €14bn 10% 9% 15% 29%
Italy
Net €1-1.5bn €2bn+ €2.5bn €4.9bn(2)
Inflows(1)
>75%
Dividend €0.44p.s. €1.5p.s.
Payout
>€0.10p.s.
Policy(1) 45% Payout >60%141% Payout
Net Profit €300mn €247mn
(9M 2019)
Source: Company data
Note (1): refers to average in the period. Note (2): Jan-Sept 2019 annualised. 16… and we are well above 2015-2019 targets
Well on track to achieve the remaining target of Net Profit
Legend:
✓ ✓ : Ahead of schedule
✓ : On schedule Today 2019 Target Status
: Behind schedule
Total Assets €57.4bn €50bn ✓✓
Of which outside Italy 29% ~15% ✓✓
Annual. Net Profit ≥ €300mln
€247mln
€300mln ✓✓
9M 2019 Net Profit
Annual. Net Inflows €4.9bn
2019 YtD Net Inflows
€2.5bn(1) ✓✓
€3.7bn
€1.5p.s. >75%
Dividend Policy Payout ✓✓
100%+ Payout >60%
Source: Company data
Note (1): 2019 Target Net inflows refers to an annual average across the 5 year 17
business planTable of Contents
Azimut at a glance 2
Management team 8
Business model 11
A history of delivering on our promises 14
Asset Management 17
Distribution 25
Geographical diversification & funds breakdown 28
Results highlights 34
Debt overview & the Transaction 41
About Azimut 46
18Evolution of Assets under Management
Growth in AUM has been consistent, both in Italy and abroad
Total Assets breakdown (€bn)
* Total Assets reaching all time high at
Italy International * €57.4bn
2x
Net Inflows in 2019 YtD at €3.7bn, almost
57.4 entirely organic, from both Italy and
International
50.4 50.8
Italy on an organic basis is 100% higher
16.7
43.6 than 2018
12.5 13.8 International continues to contribute
36.7 7.7 thanks to global diversification
Net Performance at a 2019 peak: +6.9%
4.3
30.0
2.1
Assets Under Management by portfolio:
40.7
37.9 37.0
35.9
32.4
27.9
2014 2015 2016 2017 2018 Sep-19
Source: Company data
Note*: through AZ International Holdings 19Azimut Net Weighted Average Performance
Net performance above peak levels at +6.9%
11.00%
9.00%
7.00%
5.00%
3.00%
1.00%
-1.00%
-3.00%
Dec-18 Jan-19 Feb-19 Mar-19 Apr-19 May-19 Jun-19 Jul-19 Aug-19 Sep-19
Azimut Net WAP Ita. Industry Risk Free
Source: Company data at 29 Oct 2019 and Bloomberg 20
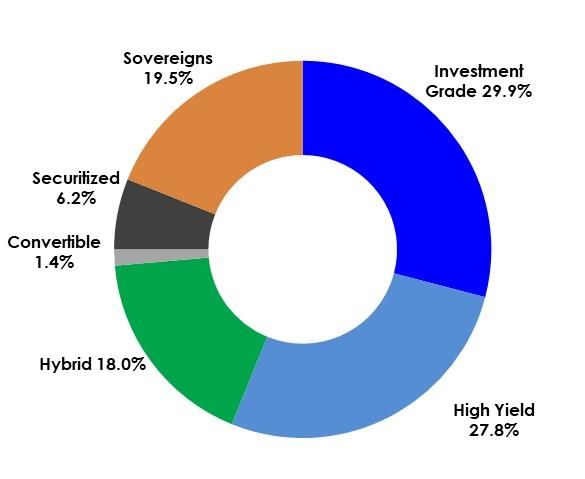
Italian industry: FIDMGEND. Risk free: MTSIBOTR Index.Azimut funds breakdown
Breakdown by asset class reflecting client behaviour and risk appetite
AuM by Category AuM by Underlying Asset
(8.4%)
Total Equity: 39%(39%)
(37.2%)
(11.0%)
(48.2%)
(33.9%)
(14%)
(23.5%)
(18.5%)
(5.4%)
Source: Company data at 30/09/2019
Note: Numbers in bracket refer to previous quarter. 21Azimut funds breakdown
Breakdown of Equities and Fixed Income by Geography and type
Equities Fixed Income
(10,1%)
(13.6%)
(8.4%) (30.2%)
(24.4%)
(6.6%)
(9.8%)
(1.5%)
(11.4%)
(20.7%)
(35.9%)
(29.8%)
Source: Company data at 30/09/2019
Note: Numbers in bracket refer to previous quarter 22Listed Italian Asset Management peers
Total Assets under Management adj. growth (December 2014 – September 2019)
Total AuM
(bn €) 57.4 62.9 189.5 78.6 80.3
Net Inflows
14-9M19 (bn €) 33.7 30.0 22.6 31.0 25.9
91.0%
72.0%
59.1%1 59.0%
25.0%
Banca Generali Anima Fineco Mediolanum
Dividend per share evolution and Consolidated Net Income
€ per share
DPS 2018 Total DPS (2014-2018)
Net Income
Growth
14-2019E 80% 42% 37% 75% 52%
(bn €)
6.8
5.8
1.5 1.8
1.3 1.3 0.91
0.4 0.3 0.17
Banca Generali Mediolaum Fineco Anima
Source: Company financial results, Bloomberg
1 Excluding
23
inorganic contribution by acquisition of Gestielle SGR for €19bn in 2017, Banca Aletti for €9.4bn in 2018 and €70.2bn from acquisition of
demerged business of BFPNet profit peer analysis
Net Inflows / AuM % as of September 2019
Net Inflows
(bn €) 3.7 42.7 76.3 6.2 (1.4) (5.2) (1.0) (3.1) (17.2) (28.7)
7.3%
3.0%
1.5%
0.9%
(0.3%)
(0.7%)
(1.0%) (1.1%)
(2.7%)
(4.6%)
Amundi Blackrock DWS Schroders Invesco Man Group Janus Aberdeen Franklin
Henderson Templeton
Source: Company financial results, Bloomberg
24Stronger Diversified Presence with High Margins
Anima Tikehau Capital
AUM € 57bn € 189bn €23.4 bn
Of which International € 16bn x Limited
Local AM Capabilities ✓ ✓ ✓
International AuM Capabilities ✓ x Limited
Proprietary Distribution Network ✓ x x
Local ✓ x x
International ✓ x x
Private Markets ✓ x ✓
2019E Net Profit (Bloomberg) € 300m + € 167m € 160m
Net profit/AuM 60 bps 9 bps 68 bps
9M 2019 Net New Money € 3.7 bn (€ 126m)
Net New Money/AuM +10% - 0.07%
2015 – 2018 Average +16.1% +6.1%
Source: Company data, Factset, Bloomberg and publicly available information
25Table of Contents
Azimut at a glance 2
Management team 8
Business model 11
A history of delivering on our promises 14
Asset Management 17
Distribution 25
Geographical diversification & funds breakdown 28
Results highlights 34
Debt overview & the Transaction 41
About Azimut 46
26Focus on Italy: main KPIs showing encouraging trends
Gross New Financial Advisor Hires Split of AuM and FA by geography
Millennials
Millenials
CF
FA 198
BANCARIO
Banks
153
78%
141
128
112
94 of FAs
80% 16% of FAs
of AuM 17% of AuM
FY 2014 FY 2015 FY 2016 FY 2017 FY 2018 9M 2019
New Clients (#)
6%
of FAs
+12.2%
3%
of AuM
11,131
9,924
9M 2018 9M 2019
Source: Company data.
27Net Inflows – Azimut Group vs. Avg. Italian Industry
Group total Net New Money as % of AuM: consistently above Italian industry levels
Azimut Group Italian Funds’ Industry
25% 25%
Azimut
average:
+11.8%
15% 15%
5% 5%
-5% -5%
Industry
average:
-1.4%
-15% -15%
➢ With Poste one-off
reclassification
-25% -25%
2007 2008 2009 2010 2011 2012 2013 2014 2015 2016 2017 2018 Sep-19
Source: Company data based out of Assogestioni monthly figures. Assogestioni
excludes foreign operations and 9M 2019 are annualised. 28
Azimut includes consolidated numbers at Group level, 9M 2019 are annualised.Table of Contents
Azimut at a glance 2
Management team 8
Business model 11
A history of delivering on our promises 14
Asset Management 17
Distribution 25
Geographical diversification & funds breakdown 28
Results highlights 34
Debt overview & the Transaction 41
About Azimut 46
29Total Asset Contribution by Area
An increasingly diversified global business, aimed at reaching a long term, sustainable growth
Breakdown of foreign Total Assets by Geography at September 2019 (€ bn)
29% 37% 34%
Total Assets
Equity Overseas
EMEA (Ex-Italy) Americas Asia-Pacific
€50m
(+22% YTD) (+26% YTD) (+17% YTD) (+22% YoY)
5.7
6.2 16.7
4.8
Source: Company data
30 Source: Company data 30Total Net Inflows Contribution by Area
An increasingly diversified global business, aimed at reaching a long term, sustainable growth
Breakdown of foreign Net Inflows by Geography at September 2019 (€ bn)
26% 49% 26%
Total Assets
Equity Overseas
EMEA (Ex-Italy) Americas Asia-Pacific
€50m
(+1% YoY) (+59% YoY) (+12% YoY) (+22% YoY)
0.6
1.1 2.2
0.6
Source: Company data
31 Source: Company data 31International Business: a source of consistent growth
EMEA (Ex-Italy) Asia-Pacific
✓ €4.8bn Total Assets at September 2019 ✓€5.7bn Total Assets at September 2019
✓ €0.6bn Net Inflows in 2019 YtD ✓€0.6bn Net Inflows in 2019 YtD
New JV in Egypt with € 360mln AUM: top performing New JV in China with Youmy Wealth Management
equity boutique increasing our Middle Eastern & Turkish focusing on partnerships with family offices with
presence and our Sharia-compliant competences domestic funds already launched
Growing in the U.A.E. with the opening of the Abu In Australia exploiting new trends post Royal
Dhabi office and additional institutional clientele Commission guidelines
Solid performance in CH and Monaco with moderate Taiwan and Singapore: strong recruitment of Sales and
AUM growth and new client acquisition Private Bankers with transfer of their AUM
Turkish operations: positive net inflows and profits YtD
Americas International Business in numbers
✓€6.2bn Total Assets at September 2019 9M 2019
AUM:
✓€1.1bn Net Inflows in 2019 YtD €16.7bn
Net Inflows:
€2.2bn
Brazilian business contributing with strong performance
and net new money growth in 1H despite a subdued
local market. Expecting progress in the approval of
reform packages to affect markets positively in 2H
Mexico focusing on FA growth and productivity as well
as overall franchise development
Looking to grow US presence Headcount: 17
+800 countries
Source: Company data
32International diversification: a differentiating factor
International operations are already making a tangible, positive contribution to the Group’s business
Fee Revenue(1) 2018 Headcount(2) 1Q 2019
International
~20% International
~27%
Italy
Italy
~73%
~80%
Total Assets at April 2019 Net Inflows (2015-2019YtD)
International
~28%
Italy
~50% International
Italy ~50%
~72%
Source: Company data.
Note (1): management and performance fees. Note (2): (including FAs and employees) 33 Arrows refer to expected medium term trendTotal Assets & Revenues increasing consistently
With a further acceleration of revenue contribution to Group figures especially in the last few years
International Revenues / Group Revenues (LHS) International Total Assets / Group Total Assets (RHS)
18.0 18. 0
18.4% 35%
19.0%
15.6% 30%
17.5 27.2%
16. 0
24.7%
13.8
14. 0
25%
17.0 14.0%
11.7% 12.5
12. 0
20%
16.5
17.6% 15%
11.8%
10. 0
16.0 9.0%
7.7 10%
7.1%
8.0
5.5% 8.1%
15.5 4.6%
6.0
5%
3.8% 5.7% 5.7% 4.3
15.0 4.0%
4.0
0%
2.1
14.5 -5%
2.0
1.3
0.9
14.0 0.0
-10%
-1.0%
2012
2012 2013
2013 2014
2014 2015
2015 2016
2016 2017
2017 2018
2018
International Total Assets (€bn)
Source: Company historical data
34Table of Contents
Azimut at a glance 2
Management team 8
Business model 11
A history of delivering on our promises 14
Asset Management 17
Distribution 25
Geographical diversification & funds breakdown 28
Results highlights 34
Debt overview & the Transaction 41
About Azimut 46
359M 2019 Highlights
Consistent Recurring Net Profit at above €50mln in the 3Q 2019 even including one-offs*
Revenues (€mln) Operating Costs (€mln)
+28%
724 +8%
445
412
566 -2%
➢ Recurring fees increasing 16% compared to 9M 2018, ➢ Disciplined cost base confirmed in Q3 and overall in
due to a growth in AUM and re-pricing the 9M
➢ Flat Revenue margin in Bps Q on Q ➢ Q3 SG&A costs back to 2017 levels
➢ Distribution cost increase due to one-offs as well as
➢ Strong performance of our products reflected in solid quality recruitment
performance fees
Source: Company data
Note: 3mln of one – off costs in the “Distribution Costs” line 36A new fee structure has transformed our P&L
Top and (especially) bottom line improvement: a transformational change leading to predictable earnings
Pre 2019(1) Post 2019(2)
Recurring 80%
Recurring Fees 90%
Revenues
Variable 20% Variable Fees 10%
Recurring 35% Recurring 80%
Net Profit
Variable 65% Variable 20%
Source: Company data
Note (1): Average 2012-2018. Note (2): estimate, varies based on AUM 37
growth, mix and performance. Normalised for a Full Year with the new performance fee mechanism (i.e. 2020 onwards))9M 2019 Highlights
Focus on bottom line: solid increase across the board
Net Profit Evolution
Net Profit / AUM Recurring Consolidated
(bps)* Net Profit(1) (€mln) Net Profit (€mln)
€50mln in a Quarter:
Achieved +121%
247
+102%
135
+105%
75 112
67
36
9M 2018 9M 2019 9M 2018 9M 2019 9M 2018 9M 2019
➢ Profitability and cash flow generation returning to the higher end of historical ranges
➢ Recurring Net Profit in Q3 > €50mln: target delivered as previously indicated
Source: Company data
Note*: Annualized Net Profit / Managed Assets. 38
(1) Considering re-pricing starting from mid February 20199M 2019 Highlights
A significant step up in Recurring Earnings, now delivered over 3 consecutive Qs
Evolution of Quarterly Recurring EBIT (excluding performance fees) over time
2019 Average: €59mn
€50mn Recurring
Net Profit achieved
+ Performance Fees
60
for the 3rd
consecutive quarter
Assuming full
repricing
45
2010-2018 Average: €22mn
€mn
30
15
0
Source: Company data
39Robust business model reflected in the P&L Net Margin 4x the levels since 2014 with 2019 … €/000 9M 2019 FY 2018 FY 2017 FY 2016 FY 2015 FY 2014 Entry commission income 4,122 5,401 10,247 9,826 10,151 9,213 Recurring fees 550,372 629,198 606,598 518,866 484,567 393,611 Variable fees 111,995 56,548 136,379 130,770 158,466 108,231 Other income 9,304 8,487 8,456 7,611 10,267 8,134 Insurance revenues 48,514 48,821 48,864 38,575 44,118 33,065 Total Revenues 724,306 748,454 810,544 705,648 707,569 552,254 Distribution costs (282,828) (336,195) (337,456) (325,436) (290,762) (256,326) Personnell and SG&A (146,986) (203,650) (178,534) (158,984) (125,831) (87,309) Depreciation, amort./provisions (15,039) (15,763) (16,465) (15,920) (11,110) (10,813) Operating costs (444,854) (555,608) (532,455) (500,340) (427,703) (354,448) Operating Profit 279,452 192,846 278,089 205,308 279,866 197,806 Interest income 12,276 (23,312) (13,057) (3,033) 14,392 10,082 Net non operating costs (6,042) (6,238) (8,114) (6,323) (5,065) (6,273) Interest expenses (7,775) (7,414) (9,646) (11,063) (11,015) (12,051) Profit Before Tax 277,912 155,882 247,272 184,889 278,178 189,564 Income tax (22,971) (24,836) (22,854) (19,281) (23,555) (93,761) Deferred tax 2,207 9,534 1,491 11,696 (4,636) 2,156 Net Profit 257,147 140,580 225,909 177,304 249,987 97,959 Minorities 10,598 18,434 11,123 4,619 2,566 1,145 Consolidated Net Profit 246,549 122,146 214,786 172,685 247,421 96,814 Consolidated Net Profit (excluding one-offs*) 246,549 144,712 220,085 172,685 247,421 174,308 Net Margin(1) 200,000(2) 89,352 90,608 34,446 67,974 49,976 Source: Company data Note (1): Recurring fees minus Distribution Costs and Personnell and SG&A. Note (2): 40 Annualized Net Margin assuming new pricing scheme.
Comparing fees and cost of ownership globally

Italy is a “bundled” market: not comparable to the US and UK unless considering full cost of ownership

                                                                  GFIE Report Morningstar

                                                                                           Recurring Front Load Advisory + Platform Total Cost of
                                                                                            Fees %     fees %         fees %        Ownership %
                                                                          Germany            1,46       0,45                             1,91
                                                                          Japan              1,64       0,39                             2,03
 “One of the difficulties in comparing annual
                                                                          United States      0,67       0,11            1,25             2,03
   expense ratios across countries has been                               Korea              1,63       0,43                             2,06
        the development of unbundled fee                                  Spain              2,00       0,06                             2,06
                                                                          Switzerland        0,37       0,45            1,25             2,07
   arrangements, whereby an advisor is not                                China              1,73       0,36                             2,09
       paid a sales commission by the fund                                Netherlands        0,67       0,23            1,25             2,15
                                                                          France             1,76       0,44                             2,20
 company in the traditional model but rather                              Singapore          1,74       0,47                             2,21
  is paid a separate fee by the fund investor”                            India              2,22                                        2,22
                                                                          Canada             2,23                                        2,23
                         Morningstar                                      Italy              2,07       0,20                             2,27
                                                                          Taiwan             1,91       0,47                             2,38
                                                                          Sweden             1,23       0,05            1,25             2,53
                                                                          Australia          1,26       0,07            1,25             2,58
                                                                          United Kingdom     1,28       0,30            1,25             2,83

                                                                          Average                                                        2,23

                                                                          AZIMUT                                                         2,15

Source: GFIE Report Morningstar, 2015 & 2017. Extract of selected countries.
                                                                                41
Table of Contents
Azimut at a glance 2
Management team 8
Business model 11
A history of delivering on our promises 14
Asset Management 17
Distribution 25
Geographical diversification & funds breakdown 28
Results highlights 34
Debt overview & the Transaction 41
About Azimut 46
42Proven ability to properly manage the Balance Sheet
An active and flexible capital management since the IPO
Net Debt (Net Cash) Net Debt/EBITDA- Perf Fees
Post-IPO deleveraging
Group
re-leveraging Investing for growth
& capital returns
200 16.0x
13.3x
150 14.0x
100 12.0x
50
147 77 107 31 10.0x
0 -18 -22
-23 8.0x
-102 -99 -278 -364 -312 (336) -192 (135)
-50
6.0x
-100
2.5x 4.0x
-150 1.8x
0.2x 2.0x
-200 -0.4x -0.4x -0.6x -1.7x -0.9x
-1.6x 0.0x
-250 -2.1x
-2.5x
-300 -3.3x -2.0x
-4.3x -4.5x
-350 -4.0x
-400 -6.0x
2004 2005 2006 2007 2008 2009 2010 2011 2012 2013 2014 2015 2016 2017 2018
Cash flow generation
Reconfirmed dividend/capital return policy: flexible use of cash (Dividend vs. Buybacks) while maintaining an
attractive return to shareholders
Paid 80% of the 2019 €1.50 DPS in Cash, with the remaining in treasury shares
Source: Company historical data
43Proven ability to properly manage the Balance Sheet
An active and flexible capital management since the IPO
600 Gross Debt Gross Debt/EBITDA- Perf Fees 14.0x
550 12.3x
12.0x
500
450
10.0x
400
350 8.0x
300
5.6x
250 5.3x 6.0x
4.8x
200
3.5x 4.0x
150 2.8x 2.7x 2.6x 2.7x 2.7x
2.3x 2.3x 2.3x
2.0x 1.9x 1.9x
100 192 2.0x
134 117
50
135 204 222 172 153 122 282 257 252 247 364 354 552
0 0.0x
2004 2005 2006 2007 2008 2009 2010 2011 2012 2013 2014 2015 2016 2017 2018 9M
2019
44
Source: Company historical data. 44Net Financial Position (IAS/IFRS Compliant)
Net Financial Position
€/000 30-09-19 30-06-19 31-12-18
Amounts due to banks: (199,267) (198,274) -
Loan BPM (199,267) (198,274) -
Securities issued: (352,649) (350,858) (354,166)
Azimut 17-22 senior bond 2.0% (352,649) (350,858) (354,166)
TOTAL DEBT (551,916) (549,132) (354,166)
CASH AND CASH EQUIVALENTS 504,475 474,396 323,113
NET FINANCIAL POSITION (47,441) (74,736) (31,053)
Lease Liabilities IFRS16 adoption (46,959) (48,318)
-123054 -
NET FINANCIAL POSITION (including IFRS16 impact) (94,400) (123,054) (31,053)
NFP at the end of September mostly includes:
€166mn ordinary dividends paid in cash in May 2019
€43mn stamp duty and policyholder tax advance
Other acquisitions / M&A operations for ca. €52mn
Treasury shares (not booked within the NFP) stand at 1.6% as of 30/09/2019
Lease liabilities do not constitute a cash item
Source: Company data
45Table of Contents
Azimut at a glance 2
Management team 8
Business model 11
A history of delivering on our promises 14
Asset Management 17
Distribution 25
Geographical diversification & funds breakdown 28
Results highlights 34
Debt overview & the Transaction 41
About Azimut 46
46Azimut Group Structure
Azimut Holding
(Listed: AZM.IM)
100% AZ International Holdings(6)
(2010)
100% 100% 100% 100%
An Zhong (AZ) IM AZ Brasil Holdings AZ IM Singapore Katarsis CA
(2011) (2013) (2013) (2011)
100% 65% 67% 100%
100% AZ Fund(4) AZ IM HK 100% AZ IM AZ Quest Sigma Funds Mgmt Eskatos CM
Asset (1999) (2011) (2011) (2015) (2016) (2011)
Management 51% 100% 100%
AZ Swiss(5) AZ Sestante Azimut ME
(2012) (2015) (2019)
100% 100% 100% 100%
100% Azimut Capital Azimut Portföy CGM-Azimut Monaco(3) Azimut Egypt AM Azimut DIFC
Management (2004) (2011) (2011) (2019) (2017)
51% 96% 100% 100%
AZ Sinopro FP AZ-México Holdings AZ Brasil Holdings AZ US Holdings
(2013) S.A. de CV (2014) (2013) (2015)
100% 100% 96% 75%
Distribution 100% Azimut Financial AZ Sinopro IP(2) Màs Fondos S.A. Azimut Brasil WM
Holding(1) AZ Apice LLC
Insurance (2015) (2013) (2014) (2015) (2016)
100% 59%
AZ Andes SpA AZ NGA
(2015) (2014)
Life 100%
AZ Life
(2003)
Insurance
100% Azimut Enterprises
(2014)
Alternatives
100% Azimut Libera Impresa
SGR (2014)
Source: Company data as at 30/09/2019. Note (1): Controls distribution companies M&O Consultoria, FuturaInvest and Azimut Brasil
Wealth Management. Note (2): controls AZ Sinopro Insurance Planning. Note (3): Controls 100% of CGM Italia SGR. Note (4): 30% is
owned by Azimut Capital Management and 19% by Azimut Financial Insurance, both fully owned by Azimut Holding. Note (5): 47
controls SDB Financial Solutions. Note (6): Showing only material subsidiaries with a majority ownership.Azimut Group business overview
Azimut Holding
(Listed: AZM.IM)
Life
Asset Management Distribution Private Markets
Insurance
Ireland Italy Luxembourg Italy Monaco Italy
Ireland Monaco Turkey Switzerland
EMEA
Switzerland Turkey UAE Egypt
UAE Egypt
ASIA-PACIFIC
Hong Kong China Taiwan Australia
Singapore Australia Hong Kong Singapore
AMERICAS
Brazil Mexico
Brazil Mexico
Chile USA
Source: Company data
Note: Presence related only to majority holding ownerships 48Azimut international presence
Azimut overseas business stands at 29% of Total Assets at September 2019
Ireland Monaco
Italy Switz.
Brazil Lux. Turkey Australia
Chile U.A.E. Egypt China
Mexico Hong Kong
USA Singapore
Taiwan
Asset Management
Distribution
Source: Company data
Note: Presence related only to majority holding ownerships 49Focus on Asia-Pacific
Market leader in Australia, while focusing on growth and scale in other geographies
Macro-Area Overview
➢ Total Investment(1) €83mln
➢ Total Avg Assets €5.1bn (+20% yoy)
➢ 2018 Total Revenues €45mln (+36% yoy)
Shanghai
➢ PMs & Analysts 21
Taiwan
Hong Kong
➢ FAs / WM / Sales 313
Main Operations
Singapore ➢ Australia:
✓ Leading independent financial planning operator
✓ Building a local product factory
➢ China/HK:
✓ Granted Private Fund Manager license: first amongst
eurozone asset managers
➢ Taipei:
✓ Expanded scope, including FAs and insurance
brokerage
➢ Singapore:
Asset Management ✓ Scaling up WM capabilities, focus on managing local
Australia
Distribution products & distributing to HNW and Family Offices
Source: Company data.
Note (1): overall since entering the market. 50Focus on EMEA*
Market leader in Turkey, set for growth in the U.A.E while consolidating in Europe
Macro-Area Overview
➢ Total Investment(1) €115mln
➢ Total Avg Assets €4.2bn (+12% yoy)
➢ 2018 Total Revenues €43mln (-5.9% yoy)
➢ PMs & Analysts 29
Ireland
➢ FAs / WM / Sales 46
Luxembourg
Switzerland
Turkey Main Operations
Monaco
➢ Turkey:
✓ Since 2012, leading independent AM with a 5% market share
✓ Manager of one of the largest global sukuk funds in the world
Egypt ➢ U.A.E:
✓ Developing an integrated platform in Dubai and Abu Dhabi
UAE
➢ Switzerland:
✓ Consolidating local managers, growing independent platform
➢ Monaco:
✓ Doubled AUM in 5 years, targeting UHNWI
Asset Management
➢ Eqypt:
Distribution ✓ New JV in Egypt, top performing equity boutique increasing our
regional presence and our Sharia-compliant competences
Source: Company data.
Note (1): overall since entering the market. Note*: excluding domestic markets (Italy, Lux and 51
Ireland).Focus on LatAm
Market leader in Brazil, while focusing on delivering in Mexico
Macro-Area Overview
➢ Total Investment(1) €85mln
USA (Miami)
Mexico ➢ Total Assets €4.9bn (+58% yoy)
➢ 2018 Total Revenues €36mln (+85% yoy)
➢ PMs & Analysts 29
➢ FAs / WM / Sales 116
Main Operations
Brazil ➢ Brazil:
✓ Best in class portfolio management team focusing on Equities,
Long/Short, Macro, Fixed Income, Credit, Arbitrage, Impact
Chile* and Private Pension funds
✓ Proprietary distribution focused on Wealth Management
➢ Mexico:
✓ Largest independent distribution network
✓ Growing in local AM, currently 3 onshore mutual funds
➢ Chile:
Asset Management ✓ Marketing of UCITS funds to local investors and future upgrade
into AM license
Distribution
Source: Company data.
Note (1): overall since entering the market. Note *: under approval. 52Azimut post-IPO development
A dynamic Group at the verge of product and corporate innovation
Obtained a BBB Rating New management
Strengthened and New Senior Bond to team
Libera Impresa rationalized Turkey refinance existing JV in Egypt
JV in Taiwan Strengthened Brazil Convert Repricing recurring
JV in China JV in Brazil Futurimpresa JV in U.A.E. fees
JV in Turkey JV in Singapore (Private Equity) Initiated Share buyback New financing
Azimut IPO
JV in Monaco Convertible bond Growing in Australia plan Expansion in Australia
Insurance: AZ Life JV in Switzerland JV in Chile
Azimut 2013-2020 Strengthened CH Re-Launch of Private
(Ireland)
2.125% Expansion in Australia Markets
2012
2004
2010
2011
2013
2014
2015
2016
2017
2018
2019
AZ International Launch of JV in Mexico Strengthened Sofia SGR
Holdings participating Second Turkey JV Australia Timone MBO
financial instruments JV in Australia Strengthened Brazil Strengthened Australia
AZ Swiss Expanded in
Total Assets (€bn) Private Insurance Switzerland
Out of the CRD IV
57.4
regime
50.4 50.8
43.6
36.7
30.0
24.0
19.6
15.7 15.8 16.5 16.5
13.9 13.0
11.6
Source: Company data 53Strong, consistent growth trends
Continuous growth throughout the decade, notwithstanding turbolent years
Total assets (€bn) Net inflows (€bn)
50.4 50.8 6.7 6.8
6.5
43.6 5.6
36.7
4.4
30.0
24.0 3.2
19.6
16.5 16.5
13.9 15.7 13.0 15.8 1.9
1.6
11.6 1.5 1.5
7.2 8.7 1.2 1.2 1.1
0.9
0.5
0.1
2003 2004 2005 2006 2007 2008 2009 2010 2011 2012 2013 2014 2015 2016 2017 2018 2003 2004 2005 2006 2007 2008 2009 2010 2011 2012 2013 2014 2015 2016 2017 2018
Clients (‘000) Financial advisors
218 1,747
208 1,637 1,638
198 1,576
187 1,477 1,524
173 1,379 1,390 1,396
160 163 1,289
148 145 149 154 156 1,205 1,255
135 1,117
120 947
109 881
101 780
2003 2004 2005 2006 2007 2008 2009 2010 2011 2012 2013 2014 2015 2016 2017 2018 2003 2004 2005 2006 2007 2008 2009 2010 2011 2012 2013 2014 2015 2016 2017 2018
Source: Company data as of 31/12/2018
542009-2019 A beta stock with a strong P&L
Solid financial performance (€mln)
Rec. Fees Var. Fees SG&A Other Costs
240
200
160
120
80
40
-
-40
-80
-120
-160
Source: Company data as of 30/09/2019
Note: 2014, 2017 and 2018 Net Profit excludes one-offs
55Contacts
Investor Relations Contacts
Vittorio Pracca
Tel. +39.02.8898.5853
Email: vittorio.pracca@azimut.it
Galeazzo Cornetto Bourlot
Tel. +39.02.8898.5066
Email: galeazzo.cornetto@azimut.it
www.azimut-group.com
Disclaimer – Safe harbour statement
This document has been issued by Azimut Holding just for information purposes. No reliance may be placed for any purposes whatsoever on the information
contained in this document, or on its completeness, accuracy or fairness. Although care has been taken to ensure that the facts stated in this presentation are
accurate, and that the opinions expressed are fair and reasonable, the contents of this presentation have not been verified by independent auditors, or other third
parties.
Accordingly, no representation or warranty, express or implied, is made or given by or on behalf of the Company, or any of its members, directors, officers or
employees or any other person. The Company and its subsidiaries, or any of their respective members, directors, officers or employees nor any other person acting
on behalf of the Company accepts any liability whatsoever for any loss howsoever arising from any use of this presentation or its contents or otherwise arising in
connection therewith.
The information in this document might include forward-looking statements which are based on current expectations and projections about future events. These
forward-looking statements are subject to risks, uncertainties and assumptions about the Company and its subsidiaries and investments, including, among other
things, the development of its business, trends in its operating industry, and future capital expenditures and acquisitions. In light of these risks, uncertainties and
assumptions, the events in the forward-looking statements may not occur. No one undertakes to publicly update or revise any such forward-looking statement.
The information and opinions contained in this presentation are provided as at the date of this presentation and are subject to change without notice.
Any forward-looking information contained herein has been prepared on the basis of a number of assumptions which may prove to be incorrect and, accordingly,
actual results may vary. This document does not constitute an offer or invitation to purchase or subscribe for any shares and/or investment products mentioned and no
part of it shall form the basis of or be relied upon in connection with any contract or commitment whatsoever.
The information herein may not be reproduced or published in whole or in part, for any purpose, or distributed to any other party. By accepting this document you
agree to be bound by the foregoing limitations.
The Officer in charge of the preparation of Azimut Holding SpA accounting documents, Alessandro Zambotti (CFO), declares according to art.154bis co.2 D.lgs.
58/98 of the Consolidated Law of Finance, that the financial information herein included, corresponds to the records in the company’s books.
56You can also read