Southwest Airlines Co - Investor Booklet - April 2018 - Investor Relations

Page created by Anna King
 
CONTINUE READING
Southwest Airlines Co - Investor Booklet - April 2018 - Investor Relations
Southwest Airlines Co.
Investor Booklet – April 2018
Southwest Airlines Co - Investor Booklet - April 2018 - Investor Relations
Cautionary Statement Regarding Forward-Looking Statements
This booklet contains forward-looking statements within the meaning of Section 27A of the Securities Act of 1933, as amended, and Section
21E of the Securities Exchange Act of 1934, as amended. Forward-looking statements are based on, and include statements about, the
Company’s estimates, expectations, beliefs, intentions, and strategies for the future, and are not guarantees of future performance. Specific
forward-looking statements can be identified by the fact that they do not relate strictly to historical or current facts and include without
limitation statements related to (i) the Company’s financial position, goals, strategies, expectations, opportunities, and outlook, and its
projected results of operations, including factors expected to impact the Company’s results of operations; (ii) the Company’s operational
goals, strategies, and initiatives; (iii)the Company’s fleet plans and expectations, including with respect to its fleet modernization initiatives,
and the Company’s related financial and operational expectations; (iv) the Company’s expectations and goals with respect to returning value
to Shareholders; (v) the Company’s plans and expectations with respect to its new reservation system, and the Company’s related multi-
faceted financial and operational expectations and opportunities; and (vi) the Company’s Vision. Forward-looking statements involve risks,
uncertainties, assumptions, and other factors that are difficult to predict and that could cause actual results to vary materially from those
expressed in or indicated by them. Factors include, among others, (i) changes in demand for the Company’s services and other changes in
consumer behavior; (ii) the impact of a continually changing business environment, economic conditions, fuel prices, actions of competitors
(including, without limitation, pricing, scheduling, capacity, and network decisions and consolidation and alliance activities), governmental
actions, and other factors beyond the Company’s control, on the Company’s business decisions, plans, strategies, and results; (iii) the
Company’s dependence on third parties, in particular with respect to its fleet and technology plans; (iv) the Company’s ability to timely and
effectively implement, transition, and maintain the necessary information technology systems and infrastructure to support its operations and
initiatives; (v) the impact of labor matters on the Company’s business decisions, plans, strategies, expectations, and costs; and (vi) other
factors, as described in the Company's filings with the Securities and Exchange Commission, including the detailed factors discussed under
the heading "Risk Factors" in the Company’s Annual Report on Form 10-K for the fiscal year ended December 31, 2017.

                                                  Notice Regarding Third Party Content
This presentation may contain information obtained from third parties, including ratings from credit ratings agencies such as S&P Global
Ratings. Reproduction and distribution of third party content in any form is prohibited except with the prior written permission of the related
third party. Third party content providers do not guarantee the accuracy, completeness, timeliness or availability of any information,
including ratings, and are not responsible for any errors or omissions (negligent or otherwise), regardless of the cause, or for the results
obtained from the use of such content. THIRD PARTY CONTENT PROVIDERS GIVE NO EXPRESS OR IMPLIED WARRANTIES,
INCLUDING, BUT NOT LIMITED TO, ANY WARRANTIES OF MERCHANTABILITY OR FITNESS FOR A PARTICULAR PURPOSE OR
USE. THIRD PARTY CONTENT PROVIDERS SHALL NOT BE LIABLE FOR ANY DIRECT, INDIRECT, INCIDENTAL, EXEMPLARY,
COMPENSATORY, PUNITIVE, SPECIAL OR CONSEQUENTIAL DAMAGES, COSTS, EXPENSES, LEGAL FEES, OR LOSSES
(INCLUDING LOST INCOME OR PROFITS AND OPPORTUNITY COSTS OR LOSSES CAUSED BY NEGLIGENCE) IN CONNECTION
WITH ANY USE OF THEIR CONTENT, INCLUDING RATINGS. Credit ratings are statements of opinions and are not statements of fact or
recommendations to purchase, hold or sell securities. They do not address the suitability of securities or the suitability of securities for
investment purposes, and should not be relied on as investment advice.

                                                                                                                                            2
Southwest Airlines Co - Investor Booklet - April 2018 - Investor Relations
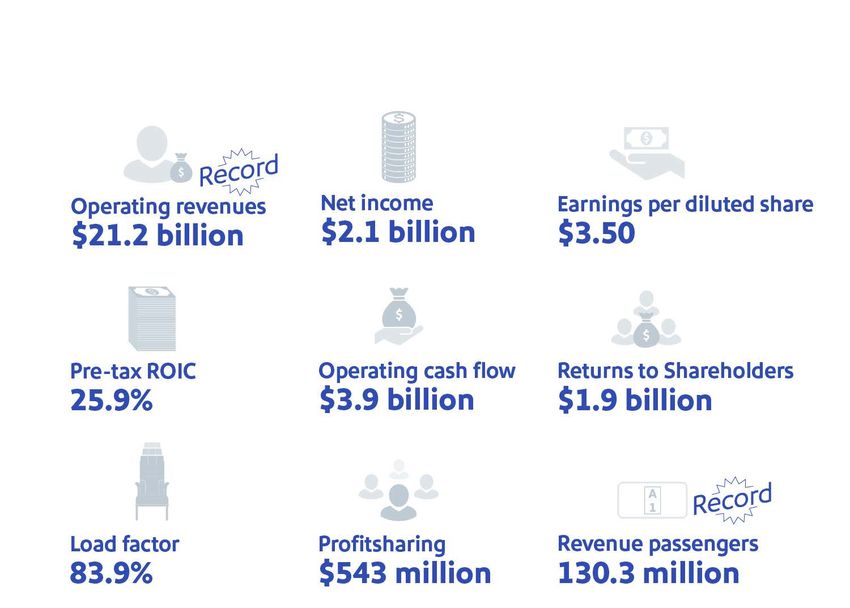
Competitive differentiators

   Unmatched profitability record with cost discipline and a
                   strong balance sheet

   Outstanding Customer Service and Hospitality that drives
                brand loyalty and recognition

         The best People and Culture in the industry

     Low fares and a point-to-point network that support
          market leadership and non-stop service

                 Reliable, efficient operations

                                                               3
Southwest Airlines Co - Investor Booklet - April 2018 - Investor Relations
1
           Unmatched profitability record

                                    U.S. Airline Industry Bankruptcies, 2000-2011

                                   Chapter 7
                                                    2008           2004          2003

                                                    2011           2008       2008 & 2004

                                                    2005           2005          2005
                                   Chapter 11

                                                    2005        2004 & 2002      2003

                                                    2002           2001          2001

                            Southwest has remained profitable for 45 consecutive years
1In   the U.S. Airline industry.
                                                                                            4
Southwest Airlines Co - Investor Booklet - April 2018 - Investor Relations
2017: an outstanding year!

                                                                                1                                                 1, 2                                                                                                       1, 2

                                                           1, 3

1These results will be recast primarily due to the retrospective application transition option selected as part of the Company’s adoption of Accounting Standards Update 2014-09, Revenue from Contracts with Customers. See the Company’s

Current Report on Form 8-K furnished to the Securities and Exchange Commission on March 20, 2018 for further information.
2Excludes special items.
3ROIC is defined as annual pre-tax return on invested capital, excluding special items.

Note: See reconciliation of reported amounts to non-GAAP financial measures.
                                                                                                                                                                                                                                             5
Southwest Airlines Co - Investor Booklet - April 2018 - Investor Relations
Significant profit expansion

                                 $2,500                                                                                                                                                                             14%

                                                                           Net income 1
                                                                                                                                                                                                                    12%
                                 $2,000                                                         2
                                                                           Net margin
                                                                                                                                                                                                                    10%
                                 $1,500                                                                                                                                                                             8%
               Net income

                                                                                                                                                                                                                                     Net margin
               (in millions)

                                 $1,000                                                                                                                                                                             6%

                                                                                                                                                                                                                    4%
                                  $500
                                                                                                                                                                                                                    2%

                                      $-                                                                                                                                                                            0%
                                                                                                                                                                               3                         3
                                                           2012                      2013                      2014                      2015                      2016                      2017

                 Y/Y %
                 Change                                      26.4                      93.0                      73.5                      68.6                       0.6                    (11.1)

                               Our annual profits and margins significantly improved since 2012, largely due to
                               the successful implementation of our strategic initiatives
1Excludes special items.
2NetMargin, excluding special items, is calculated as net income, excluding special items, divided by operating revenues, excluding special items.
3These results will be recast primarily due to the retrospective application transition option selected as part of the Company’s adoption of Accounting Standards Update 2014-09, Revenue from Contracts with Customers. See the Company’s
Current Report on Form 8-K furnished to the Securities and Exchange Commission on March 20, 2018 for further information.                                                                                                                         6
Note: See reconciliation of reported amounts to non-GAAP financial measures.
Southwest Airlines Co - Investor Booklet - April 2018 - Investor Relations
Delivering strong returns on investment

                          ROIC1
         35%
                                                                              32.7%
                                                                                                30.0%
         30%                                                                                                                                                                      Drivers of ROIC
                                                                                                                   25.9%                          •        AirTran integration
         25%
                                                            21.2%                                                                                 •        All New Rapid Rewards
         20%
                                                                                                                                                  •        International

         15%                              13.1%                                                                                                   •        New reservation system

         10%                                                                                                                                      •        Fleet modernization/Boeing 737-800
                         7.2%
                                                                                                                                                  •        Network optimization
           5%
                                                                                                                                                  •        Low fuel prices
           0%
                                                                                                            2                 2
                         2012              2013              2014               2015              2016              2017
   Y/Y Pt.
  Change                    0.4              5.9               8.1               11.5              (2.7)             (4.1)

1ROIC  is defined as annual pre-tax return on invested capital, excluding special items. ROIC is for the 12 months ended December 31 in each year shown.
2These  results will be recast primarily due to the retrospective application transition option selected as part of the Company’s adoption of Accounting Standards Update 2014-09, Revenue from
Contracts with Customers. See the Company’s Current Report on Form 8-K furnished to the Securities and Exchange Commission on March 20, 2018 for further information.
Note: See reconciliation of reported amounts to non-GAAP financial measures.
                                                                                                                                                                                                    7
Southwest Airlines Co - Investor Booklet - April 2018 - Investor Relations
Low cost advantage

                                                      16.00
           Domestic operating expenses per ASM, ex-fuel

                                                      14.00

                                                      12.00

                                                      10.00
                             (in cents)

                                                          8.00

                                                          6.00

                                                          4.00
                                                                                                                                                                                       Southwest
                                                          2.00                                                                                                                         Network 1
                                                                                                                                                                                       LCC 2
                                                            -
                                                                1Q 2000                                                                                                                    4Q 2017

                                                           While the gap to the industry has contracted over the past 10 years, we
                                                           are committed to preserving a meaningful competitive cost advantage

1Network  airlines: Trans World, American, US Airways, Northwest, Delta, Continental, United, America West (post-American merger)
2LCC airlines: JetBlue, Alaska, Virgin America, America West (pre-AA merger), AirTran (pre-Southwest merger), Allegiant, Spirit, Frontier
Source: DOT form 41 and T100 data, through December 31, 2017. Estimated unit costs have been stage-length adjusted to Southwest’s average stage-length, represents domestic mainline
                                                                                                                                                                                                   8
Southwest Airlines Co - Investor Booklet - April 2018 - Investor Relations
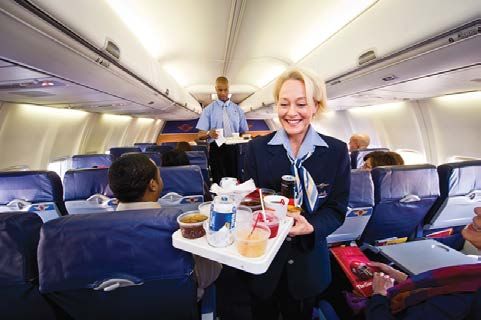
Fleet modernization has been a significant
contributor to our cost control efforts
  Aircraft by fleet type                              Average seats per aircraft
  Year end aircraft on property                       Year end average

                                       723
  694                         704            706
          681
                     665

                                                                                        152
                                                                                 149
                                                                   145    146

                                                            141

                                                    136

 2012    2013    2014      2015     2016     2017   2012   2013    2014   2015   2016   2017

  717s    Classics     700s     800s     MAX 8

     The increase in the seat gauge of our aircraft drives down unit costs and
     allows for efficient growth opportunities                                                 9
Southwest Airlines Co - Investor Booklet - April 2018 - Investor Relations
Reducing fuel consumption and improving efficiency
  through fleet modernization and other fuel initiatives

         ASMs per gallon
 76                                                          Fuel saving initiatives
                                            75.2
 75                                  74.4          In addition to modernizing the fleet:
                              73.9
 74
                                                   •   Split scimitar winglets
 73                    72.7

 72             71.7                               •   Galley refresh

 71
                                                   •   Fuel and flight planning
 70
         69.4
 69                                                •   New seats

 68
                                                   •   Single engine taxi
 67

 66                                                •   Electronic flight bags
         2012   2013   2014   2015   2016   2017
Y/Y %
Change    1.5    3.3    1.5    1.6    0.7   1.1

                                                                                           10
First quarter 2018 results
                                                                                                                                                        1Q
                                                                                                                                                      Record

                   27.1%                                                                                       20.8%                     $4.9B
                                                               1
                                                                                                                                          operating
                    pre-tax ROIC                                                                           after-tax ROIC       1
                                                                                                                                          revenues

                 $438M                                                                                         $0.75                     $102M
                                                                                                               earnings per
                       net income2                                                                                                       profitsharing
                                                                                                               diluted share2

                                                                                                                                  1Q

                 $648M                                                                                                                   (0.3)%
                                                                                                                                Record

                     returned to
                                                                                                               81.5%                      nonfuel
                    Shareholders                                                                                load factor              CASM2,3, y/y

1ROIC  is defined as annual return on invested capital, excluding special items, for the last twelve months.
2excluding special items.
3excluding profitsharing.                                                                                                                                 11
Note: see reconciliation of reported amounts to non-GAAP financial measures.
Sustaining a strong financial position

                                                                                                                                               Strong balance sheet
                                                                                                     •      $3.2 billion in unrestricted core cash and short-
                        Investment                                                                          term investments and $1 billion line of credit fully
                    grade rating by                                                                         undrawn and available
                   all three agencies                                                                •      Balance Sheet leverage goal in the low-to-mid
                                                                                                            30% range1

                                                                                                                                      Balanced capital deployment
                                                                                                 •       Cash flow from operations of $1.0 billion
                          Returned
                                                                                                 •       Capital spending of $409 million
                        $648 million
                      to Shareholders                                                            •       Free cash flow of $708 million3
                                    2
                         in 1Q 2018                                                              •       Debt repayments of $82 million4

                Southwest is focused on preserving a strong balance sheet and healthy cash
                flows and is the only domestic carrier with a decades-long history of consistently
                returning capital to Shareholders
1Includes off balance sheet aircraft leases.
2In 1Q 2018, $648 million was returned to Shareholders through a combination of $148 million in dividends and $500 million in share repurchases.
3Free cash flow is calculated as operating cash flows less capital expenditures less assets constructed for others, net. See reconciliation of reported amounts to non-GAAP financial measures.
4Includes payments of debt and capital lease obligations.                                                                                                                                         12
Note: Balance sheet information is as of March 31, 2018. All other information presented is for the three months ended March 31, 2018.
Industry-leading balance sheet

                                                                         Non-investment grade                                                                                             Investment grade

    S&P/ Fitch                       B-                    B                    B+                   BB-                   BB                   BB+                  BBB-                  BBB                  BBB+           A-
       Moody’s                      B3                    B2                    B1                  Ba3                   Ba2                   Ba1                  Baa3                 Baa2                  Baa1           A3

Source: Bloomberg as of April 20, 2018. Moody’s Senior Unsecured rating used (if unavailable, Long Term Corporate Family or Long Term rating used); S&P’s Long Term Issuer rating used; Fitch’s Senior Unsecured rating used
(if unavailable, Long-term Issuer rating used).
Note: Please see S&P disclaimer language on slide 2.
                                                                                                                                                                                                                                13
Future delivery schedule provides significant flexibility
         and continued fleet modernization opportunities

                                                           The Boeing Company
                                   -800                   MAX 7                    MAX 8
                                                                                                              MAX 8     Additional       Additional
                                   Firm                    Firm                     Firm                                                                  Total
                                                                                                              Options     -700s           MAX 8s
                                  Orders                  Orders                   Orders
          2018                                26                         —                       19                —             1                    —           46 (b)
          2019                                —                          7                       20                —             —                    3           30
          2020                                —                          —                       35                —             —                    —           35
          2021                                —                          —                       44                —             —                    —           44
          2022                                —                          —                       27                14            —                    —           41
          2023                                —                          12                      22                23            —                    —           57
          2024                                —                          11                      30                23            —                    —           64
          2025                                —                          —                       40                36            —                    —           76
          2026                                —                          —                       —                 19            —                    —           19
                                              26                         30                   237 (a)             115                1                3       412

(a) The Company has flexibility to substitute 737 MAX 7 in lieu of 737 MAX 8 firm orders beginning in 2019.
(b) Includes eleven 737-800s, one 737-700, and one 737 MAX 8 delivered as of April 25, 2018.                                                                           14
Note: Delivery schedule is as of April 25, 2018.
Creating value for Shareholders

                $2.5                         Free cash flow
                                                                           1

                                             Share repurchases
                                             Dividends
                $2.0

                $1.5
(in billions)

                $1.0

                $0.5

                $0.0
                               2011                          2012                         2013                             2014   2015   2016   2017   1Q18

                         From 2011 through first quarter 2018, we returned more than $8.2 billion to
                         Shareholders through share repurchases and dividends, and completed a $500
                         million ASR in first quarter 2018.
1Free cash flow is calculated as operating cash flows less capital expenditures less assets constructed for others, net.                                  15
Note: See reconciliation of reported amounts to non-GAAP financial measures.
LUV market outperformance

                                                 $700

                                                 $600                                     Southwest
                           Total Cumulative Return

                                                                                          NYSE ARCA Airline
                                                 $500
                                                                                          S&P 500
                                   (dollars)

                                                 $400

                                                 $300

                                                 $200

                                                 $100

                                                     $0
                                                            2012                          2013                          2014                           2015                          2016                          2017

Note: This graph compares the cumulative total shareholder return on the Company’s common stock over the five-year period ended December 31, 2017, with the cumulative total return during such period of the Standard and Poor’s 500
Stock Index and the NYSE ARCA Airline Index. The comparison assumes $100 was invested on December 31, 2012, in the Company’s common stock and in each of the foregoing indices and assumes reinvestment of dividends. The stock
performance shown on this graph represents historical stock performance and is not necessarily indicative of future stock price performance.
                                                                                                                                                                                                                                        16
Customer Experience builds loyalty

                                                                         “It’s a good experience. I
                                                                         feel a sense of Hospitality
                                                                         that other airlines do not
                                                                         have.”

                                                                 ®                                   Exceptional Inflight
      Rapid Rewards
                                                                                                          Offerings
   Frequent Flyer Program
                                                                                              •   Live TV
 • 100% seat availability1                                                                    •   $8 Wi-Fi flat rate per day
 • No blackout dates                                                                          •   Complimentary snacks and
 • Points don’t expire2                                                                           beverages

1Members    are able to redeem their points for every available seat.                                                  17
2Must   have points earning activity during the most recent 24 months.
Consistently loved and recognized brand

                                                                                                                                                                                   Awards in 2017
                                                                                                                                               • Ranked #8 in FORTUNE’S list of the
                                                                                                                                                 World’s Most Admired Companies, the only
                                                                                                                                                 commercial airline among the Top 10
                                                                                                                                               • Readers’ pick for Best Frequent Flyer
                                                                                                                                                 Program (U.S.) for Rapid Rewards by
No Hidden Fees1

                                                                                                                                                 SmarterTravel
                                                                             5
                                                                                                                                               • Best Loyalty Credit Card, Best Airline
                                                                                                                                                 Redemption Ability, and Best Customer
                                                                                                                                                 Service by the Freddie Awards
                                                                                                                                               • Air Forwarders Association’s Domestic
                                                                                                                                                 Carrier of the Year
                                                                                                                                               • Ranked among the Best Airline Rewards
                                                                                                                                                 Programs by U.S News & World Report

                                                           Low Fares2

                              TransfarencySM is a philosophy created by Southwest Airlines in which
                              Customers are treated honestly and fairly, and low fares actually stay
                              low—no unexpected bag fees3, change fees4, or hidden fees
       1No Hidden fees determined by having bag and reservation change/cancellation fees per domestic passenger below the industry average, as determined by Bureau of Transportation Statistics for the year ending December 31, 2017.
       2Low fares defined by having an average domestic fare below the industry average US domestic fare, as determined by data from the Department of Transportation O&D survey for the year ending December 31, 2017.
       3Firstand second checked pieces of luggage, size and weight limits apply.
       4There are never change fees, though fare differences might apply.                                                                                                                                                                 18
       5Alaska Airlines data includes Virgin America for the year ending December 31, 2017
Behind every seat is a story. Behind every story is
the reason for Transfarency.

                                                  19
Culture of celebration & appreciation

                                 Mission to our Employees

                        We are committed to provide our Employees
                        a stable work environment with equal
                        opportunity for learning and personal
                        growth. Creativity and innovation are
                        encouraged for improving the effectiveness
                        of Southwest Airlines. Above all, Employees
                        will be provided the same concern, respect,
                        and caring attitude within the organization
                        that they are expected to share externally
                        with every Southwest Customer.

                                                                20
Our network in 1996

                                               SEA       GEG

                                         PDX

                                                                   BOI
                                                                                                                                     DTW
                                                                                                                       MDW                               PVD
                                                                          SLC                            OMA
                                                                                                                                            CLE
                                                      RNO                                                                                  CMH
                                                                                                          MCI                  IND
                                          SMF                                                                    STL
                                                                                                                                                   BWI
                                                OAK
                                         SFO                                                                                 SDF
                                               SJC
                                                                                       AMA    OKC         TUL
                                                                   LAS                                                   BNA
                                                       BUR
                                                              ONT                ABQ                            LIT
                                                     LAX
                                                       SNA                             LBB                              BHM
                                                                         PHX
                                                             SAN                                    DAL
                                                                           TUS   ELP   MAF    AUS         IAH

                                                                                             SAT                 MSY
                                                                                                         HOU                                 MCO

                                                                                                    CRP                               TPA

                                                                                                   HRL                                       FLL

                     1996

                                                                                                                                                               21
Source: EDW DOT Traffic December 1996.
By 2006…

                                                     SEA          GEG

                                               PDX

                                                                         BOI                                                                                            BUF         ALB MHT
                                                                                                                                                      DTW
                                                                                                                                          MDW                                        BDL
                                                                                                                  OMA
                                                                                SLC                                                                                                            PVD
                                                                                                                                                            CLE                          ISP
                                                           RNO                               DEN
                                                                                                                                                                  PIT
                                                 SMF                                                                                                  CMH                          PHL
                                                                                                                                             IND                                BWI
                                                                                                                        MCI
                                               OAK                                                                                  STL                                   IAD
                                                                                                                                                SDF
                                                 SJC
                                                                                                                                                                              ORF
                                                                         LAS                                          TUL                   BNA
                                                                 BUR                                                                                                RDU
                                                                                                   AMA          OKC
                                                                                       ABQ
                                                                       ONT                                                    LIT
                                                            LAX
                                                              SNA              PHX                  LBB                                    BHM
                                                                  SAN                                            DAL
                                                                                 TUS                                                JAN
                                                                                       ELP         MAF

                                                                                                                AUS                                         JAX
                                                                                                          SAT                       MSY
                                                                                                                      HOU
                                                                                                                                                                  MCO
                                                                                                                  CRP                                  TPA
                                                                                                                                                                    PBI
                                                                                                                HRL                                     RSW
                                                                                                                                                                  FLL

                     1996
                     2006

                                                                                                                                                                                                     22
Source: EDW DOT Traffic December 1996, 2006.
… and today

                                               SEA          GEG

                                            PDX
                                                                                                MSP

                                                                                                                                                   PWM
                                                                                                      MKE                      ROC
                                                                                                             GRR         BUF           ALB MHT
                                                                                                                                                  BOS
                                                                       SLC
                                                                                   DEN                                                           PVD

                                            OAK
                                            SFO
                                               SJC

                                                      LAX

                                                         SAN
                                                                        TUS

                                                                                         SAT

                                                                                          HRL

                                                                             SJD                                                                 PLS
                                                                                                                   HAV

                                                                                                      CUN
                                                                                   PVR
                                                                                         MEX                             GCM     MBJ
                                                                                                        BZE                                             PUJ   SJU

                                                                                                                                                  AUA

                                                                                                            LIR
                                                                                                                  SJO

                     2006
                     2017
                                                                                                                                                                    23
Source: EDW DOT Traffic December 2006, Diio schedules December 2017.
The evolution of our network

                                                                                                             1996                                           2006                                           2017

               Daily departures1                                                                           >2,100                                          >3,200                                        >4,000

               Market share2                                                                                  11%                                             18%                                            24%

               Number of cities3                                                                                 49                                             63                                           100

               Number of states3                                                                                 24                                             32                                             40

               Number of countries3                                                                               1                                               1                                            11

               Fleet4                                                                                          243                                             481                                           706

               ROIC5                                                                                          12%                                             11%                                        25.9%6

                          The expansion of our robust network has driven meaningful results
1During  peak travel seasons.
21996  market share based on enplaned passengers; 2006 and 2017 market share based on revenue passengers. 2017 market share data presented herein as measured by the Department of Transportation O&D Survey for the twelve months
ended September 30, 2017 based on domestic originating passengers boarded. O&D stands for Origin and Destination.
32006 includes 32 states and the District of Columbia; 2017 includes 40 states, the District of Columbia, and the Commonwealth of Puerto Rico.

4Fleet is as of December 31 for each year shown.

5ROIC is defined as annual pre-tax return on invested capital, excluding special items and is for the twelve months ended December 31 for each year shown.

6These results will be recast primarily due to the retrospective application transition option selected as part of the Company’s adoption of Accounting Standards Update 2014-09, Revenue from Contracts with Customers. See the

Company’s Current Report on Form 8-K furnished to the Securities and Exchange Commission on March 20, 2018 for further information.                                                                                                  24
Note: See reconciliation of reported amounts to non-GAAP financial measures.
The nation’s largest domestic airline

                        LA Basin                                                   Phoenix
          (LAX, LGB, ONT, SNA, BUR)                                                (PHX, AZA)
                                                                             39%                                                                                    Market share
                   29%                                                                   32%
                              18%
                                          14%                                                                                       •       24% of total domestic market share
                                                                                                     9%

                                                                                                                                    •       Market leader in 26 of the top 50 U.S.
                                                                                                                                            metro areas1
                   DC/BWI Area                                                      Denver
                     (BWI, DCA, IAD)
                                                                                                                                    •       Serve (offer itineraries for sale) 96 of
                                                                             36%
                   32%                                                                                                                      the top 100 domestic O&D city pairs
                              24%                                                       27%
                                          18%                                                                                               (including co-terminal airports2)
                                                                                                    14%

                        Bay Area                                                 Las Vegas                                                    Orlando
                    (OAK, SFO, SJC)                                                                                                           (MCO, SFB)
                                                                                                                                                                                                     LUV
                                                                             37%
                   32%                                                                                                                                                                               OA #1
                                                                                                                                        27%
                              22%                                                                                                                                                                    OA #2
                                          16%                                                                                                       14% 12%
                                                                                         11% 10%

                      Southwest has a strong market presence in many of the nation’s top metro areas
Source: Data presented herein as measured by the Department of Transportation O&D Survey for the twelve months ended December 31, 2017 based on domestic originating passengers boarded. O&D stands for Origin and Destination.
1Metro Areas: A geographic area around a city that includes multiple major airports. In some cases, the airports within a metro area may serve separate competitive markets.
2Co-terminal: Airports that share a common city or region; for example Newark, LaGuardia and JFK are considered co-terminals to one another.                                                                                      25
Focus on Customer Service

                                                                        2015                                                     2016                                      2017

                                                                              #2                                                       #1                                   #1
                                                                               #1                                                       #3                                  #3

                                                                              #11                                                      #10                                  #10

                                                                               #5                                                       #5                                  #5

                                                                               #7                                                       #7                                  #6

                                                                               #6                                                       #6                                  #7

                                                                              #13                                                      #12                                  #12

                                                                              #10                                                       #9                                  #8

                                       Southwest has earned the DOT’s best customer satisfaction ranking
                                       for 23 of the past 27 years
                                                                                                                                                                                  26
Source: Air Travel Consumer Reports for each year shown. Rankings based on complaints filed with the Department of Transportation (DOT) per 100,000 passengers enplaned.
Focus on Reliability

Ontime Performance                          Mishandled Baggage Rate
(OTP)                                       (MBR)

82%                                         3.5

80%                                         3.0

78%                                         2.5

76%                                         2.0
         2015      2016     2017                    2015       2016       2017

        With record passengers in 2017, our strong OTP and a record-low MBR
        were notable operational achievements

                                                                                 27
New reservation system

                                                         •   Schedule variation
  • O&D Controls                                         •   Increased days of inventory
  • Improved fare flexibility                            •   Redeyes
  • Ancillary controls                                   •   Improved connection times

                                              New
                                           Reservation
                                             System
• IROPS automation & optimization
• Mobile enhancements at airport
• Standby capability & policy
  improvements

                                                         •   Interline & codeshare
                                                         •   Foreign currency
                                                         •   Foreign point of sale
    • Electronic Miscellaneous Documents                 •   New distribution capabilities
      (EMDs) for ancillary services

                                                                                             28
Purpose
 Connect People to what’s important in
their lives through friendly, reliable, and
            low-cost air travel.

                Vision
 To become the world’s most loved,
most flown, and most profitable airline.

                                        29
Non-GAAP Reconciliation
                    in millions, except per share amounts                                                                                                                               Year ended December 31,
                                                                                                                                                                      2011(e)   2012     2013     2014     2015     2016(f)   2017(f)
                    Operating revenues, as reported                                                                                                                   $ 15,658 $ 17,088 $ 17,699 $ 18,605 $ 19,820 $ 20,425 $ 21,171
                    Deduct: Special revenue adjustment (a)                                                                                                                    -       -        -        -    (172)          -         -
                    Operating revenues, excluding special items                                                                                                       $ 15,658 $ 17,088 $ 17,699 $ 18,605 $ 19,648 $ 20,425 $ 21,171

                    Net income, as reported                                                                               $                                                  178 $          421 $           754 $ 1,136 $ 2,181 $ 2,244 $ 3,488
                    Deduct: Special revenue adjustment (a)                                                                                                                     -              -               -       -    (172)      -       -
                    Add: Contract ratification bonuses                                                                                                                         -              -               -       9     334     356       -
                    Add (Deduct): Mark-to-market impact from fuel contracts settling in future periods                                                                        21           (221)           (103)    251     373       9      69
                    Add (Deduct): Ineffectiveness from fuel hedges settling in future periods                                                                                 33             42              11       5      (9)    (11)     31
                    Add (Deduct): Other net impact of fuel contracts settling in the current or a prior period (excluding
                                                                                                                                                                               35            (10)             87              24           (251)          (197)           (150)
                    reclassifications)
                    Add: Acquisition and integration costs (b)                                                                                                               132             183             86     126      39       -       -
                    Deduct: Litigation settlement                                                                                                                              -               -              -       -     (37)      -       -
                    Add: Asset impairment                                                                                                                                     14               -              -       -       -      21       -
                    Add: Lease termination expense                                                                                                                             -               -              -       -       -      22      33
                    Add: Aircraft grounding charge                                                                                                                             -               -              -       -       -       -      63
                    Add (Deduct): Net income tax impact of fuel and special items, excluding Tax reform impact (c)                                                           (83)              2            (30)   (154)   (103)    (74)    (17)
                    Deduct: Tax reform impact (d)                                                                                                                              -               -              -       -       -       -  (1,410)
                    Net income, excluding special items                                                                   $                                                  330 $           417 $          805 $ 1,397 $ 2,355 $ 2,370 $ 2,107

                    Net cash provided by operating activities                                                                                                         $ 1,356 $ 2,064 $ 2,477 $ 2,902 $ 3,238 $ 4,293 $ 3,929
                    Deduct: Capital expenditures                                                                                                                         (968) (1,348) (1,433) (1,748) (2,041) (2,038) (2,123)
                    Deduct: Assets constructed for others                                                                                                                   -       -     (14)    (80)   (102)   (109)   (126)
                    Add: Reimbursement for assets constructed for others                                                                                                    -       -       -      27      24     107     126
                    Free cash flow                                                                                                                                    $ 388 $ 716 $ 1,030 $ 1,101 $ 1,119 $ 2,253 $ 1,806

                    Net income per share, diluted, as reported                                                                                                                                                                                                      $  5.79
                    Deduct: Impact from fuel contracts                                                                                                                                                                                                                (0.08)
                    Add: Impact of special items                                                                                                                                                                                                                       0.16
                    Deduct: Net income tax impact of fuel and special items, excluding Tax reform impact (c)                                                                                                                                                          (0.03)
                    Deduct: Tax reform impact (d)                                                                                                                                                                                                                     (2.34)
                    Net income per share, diluted, excluding special items                                                                                                                                                                                          $ 3.50

(a) One-time adjustment related to the amendment of the Company's co-branded credit card agreement with Chase Bank USA, N.A. and a resulting change in accounting methodology.
(b) Expenses associated with the Company’s acquisition and integration of AirTran Holdings, LLC, the parent company of AirTran Airways, Inc. ("AirTran"). Such expenses were primarily incurred during the acquisition and integration period of the two companies from 2011 through 2015 as a result
of the Company’s acquisition of AirTran, which closed on May 2, 2011. The exclusion of these expenses provides investors with a more applicable basis with which to compare results in future periods now that the integration process has been completed. Further, pursuant to the terms of the
Company’s ProfitSharing Plan, acquisition and integration costs were excluded from the calculation of profitsharing expense from April 1, 2011, through Dec. 31, 2013. These costs, totaling $385 million, are being amortized on a pro rata basis as a reduction
of operating profits, as defined by the ProfitSharing Plan, from 2014 through 2018, in the calculation of profitsharing. In addition, acquisition and integration costs incurred during 2014 and 2015 will reduce operating profits, as defined, in the calculation of profitsharing.
(c) Tax amounts for each individual special item are calculated at the Company's effective rate for the applicable period and totaled in this line item.
(d) Adjustment related to the Tax Cuts and Jobs Act legislation passed in December 2017, which resulted in a re-measurement of the Company's deferred tax assets and liabilities at the new corporate tax rate.
(e) Includes the impact of the AirTran acquisition as of May 2, 2011.
(f) These results will be recast primarily due to the retrospective application transition option selected as part of the Company’s adoption of Accounting Standards Update 2014-09, Revenue from Contracts with Customers. See the Company’s Current Report on Form 8-K       30
furnished to the Securities and Exchange Commission on March 20, 2018 for further information.
Non-GAAP Reconciliation
               (continued)
                                                                                                                                                                                                                                                                               Twelve months
in millions                                                                            Twelve months ended December 31,                                                                                                                                                       ended March 31,
                                                                                                                                                                                                                                                                                   2018
                                                                   1996   2006   2011(f)   2012     2013    2014     2015    2016(g)  2017(g)
                                                                                                                                                                                                Operating income, as reported                                               $            3,417
Operating income, as reported                                     $ 351 $ 934 $ 693 $ 623 $ 1,278 $ 2,225 $ 4,116 $ 3,760 $ 3,515
                                                                                                                                                                                                Contract ratification bonuses                                                                 -
Special revenue adjustment (a)                                          -      -         -      -        -       -     (172)        -        -                                                  Net impact from fuel contracts                                                            (125)
Contract ratification bonuses                                           -      -         -      -        -       9      334      356         -                                                  Asset impairment                                                                              -
Net impact from fuel contracts                                          -    41          -     32      84      28      (323)    (202)    (156)                                                  Lease termination expense                                                                    28
Acquisition and integration costs (b)                                   -      -    132       183      86     126        39         -        -                                                  Aircraft grounding charge                                                                    63
Litigation settlement                                                   -      -         -      -        -       -      (37)        -        -                                                  Gain on sale of grounded aircraft                                                           (25)
Asset impairment                                                        -      -     14         -        -       -        -       21         -                                                  Operating income, non-GAAP                                                  $            3,358
Lease termination expense                                               -      -         -      -        -       -        -       22       33
                                                                                                                                                                                                Net adjustment for aircraft leases(c)                                                      107
Aircraft grounding charge                                                                       -        -       -        -         -      63
                                                                                                                                                                                                Adjusted Operating income, non-GAAP (A)                                     $            3,465
Operating income, non-GAAP                                        $ 351 $ 975 $ 839 $ 838 $ 1,448 $ 2,388 $ 3,957 $ 3,957 $ 3,455
Net adjustment for aircraft leases (c)                                  84          72            129           117           143           133           114            111           109 Non-GAAP tax rate (B)                                                                                 23.1% (h)
Adjustment for fuel hedge accounting (d)                                 -         (52)          (107)          (36)          (60)          (62)         (124)          (152)         (135)
Adjusted Operating income, non-GAAP (A)                                435         995            861           919         1,531         2,459         3,947          3,916         3,429 Net operating profit after-tax, NOPAT (A* (1-B) = C)                             $                    2,665

Debt, including capital leases (e)                     668   1,864    3,780    3,343    2,954    2,763    2,782    3,304    3,259                                                               Debt, including capital leases (e)                                                              3,300
Equity (e)                                           1,538   6,693    6,678    6,961    7,017    7,249    7,032    7,833    8,881                                                               Equity (e)                                                                                      8,561
Net present value of aircraft operating leases (e) 1,468     1,110    1,981    2,276    1,693    1,458    1,223    1,015      785                                                               Net present value of aircraft operating leases (e)                                                732
Average invested capital                           $ 3,674 $ 9,667 $ 12,439 $ 12,580 $ 11,664 $ 11,470 $ 11,037 $ 12,152 $ 12,925                                                               Average invested capital                                                    $                  12,593
Equity adjustment for hedge accounting (d)               -    (897)     184      145       50      104    1,027      886      296                                                               Equity adjustment for hedge accounting (d)                                                        196
Adjusted average invested capital (B)                3,674   8,770   12,623   12,725   11,714   11,574   12,064   13,038   13,221                                                               Adjusted average invested capital (D)                                       $                  12,789

ROIC, pre-tax (A) / (B)                                             11.8%        11.3%           6.8%          7.2%         13.1%         21.2%         32.7%          30.0%         25.9% Non-GAAP ROIC, pre-tax (A/D)                                                                          27.1%

                                                                                                                                                                                                Non-GAAP ROIC, after-tax (C/D)                                                                   20.8%

  (a) One-time adjustment related to the amendment of the Company's co-branded credit card agreement with Chase Bank USA, N.A. and a resulting change in accounting methodology.
  (b) Expenses associated with the Company’s acquisition and integration of AirTran Holdings, LLC, the parent company of AirTran Airways, Inc. ("AirTran"). Such expenses were primarily incurred during the acquisition and integration period of the two companies from 2011 through 2015 as a result
  of the Company’s acquisition of AirTran, which closed on May 2, 2011. The exclusion of these expenses provides investors with a more applicable basis with which to compare results in future periods now that the integration process has been completed. Further, pursuant to the terms of the
  Company’s ProfitSharing Plan, acquisition and integration costs were excluded from the calculation of profitsharing expense from April 1, 2011, through Dec. 31, 2013. These costs, totaling $385 million, are being amortized on a pro rata basis as a reduction of operating profits, as defined by the
  ProfitSharing Plan, from 2014 through 2018, in the calculation of profitsharing. In addition, acquisition and integration costs incurred during 2014 and 2015 will reduce operating profits, as defined, in the calculation of profitsharing.
  (c) Net adjustment related to presumption that all aircraft in fleet are owned (i.e., the impact of eliminating aircraft rent expense and replacing with estimated depreciation expense for those same aircraft). The Company makes this adjustment
  to enhance comparability to other entities that have different capital structures by utilizing alternative financing decisions.
  (d) The Adjustment for fuel hedge accounting in the numerator is due to the Company's accounting policy decision to classify fuel hedge accounting premiums below the Operating income line, and thus is adjusting Operating income to reflect such policy decision. The Equity adjustment
  for hedge accounting in the denominator adjusts for the cumulative impacts, in Accumulated other comprehensive income and Retained earnings, of gains and/or losses associated with hedge accounting
  related to fuel hedge derivatives that will settle in future periods. The current period impact of these gains and/or losses are reflected in the Net impact from fuel contracts in the numerator.
  (e) Calculated as an average of the five most recent quarter end balances or remaining obligations. The Net present value of aircraft operating leases represents the assumption that all aircraft in the Company's fleet are owned, as it reflects the remaining contractual commitments
  discounted at its estimated incremental borrowing rate as of the time each individual lease was signed.
  (f) Includes the impact of the AirTran acquisition as of May 2, 2011.
  (g) These results will be recast primarily due to the retrospective application transition option selected as part of the Company’s adoption of Accounting Standards Update 2014-09, Revenue from Contracts with Customers. See the Company’s Current Report on Form 8-K
  furnished to the Securities and Exchange Commission on March 20, 2018 for further information.
  (h) As the twelve month rolling tax rate no longer approximates an annual tax rate due to the significant impact of the Tax Cuts and Jobs Act legislation enacted in December 2017 had on corporate tax rates, the Company is utilizing the first quarter tax rate for 2018 ROIC, after-tax.
  The first quarter 2018 GAAP tax rate was 23.1 percent, and the Non-GAAP tax rate for the period was also 23.1 percent. See Note Regarding Use of Non-GAAP Financial Measures for additional information. For full year 2018, the Company continues to estimate its effective tax
  rate to be in the 23 to 23.5 percent range.
                                                                                                                                                                                                                                                                                        31
Three months
                                                                                                                                                                                                                                           ended March 31,
                                                                                                                                                                                                                                                2018
            Non-GAAP Reconciliation                                                                                                                                       Fuel and oil expense, unhedged                                   $         1,014
                                                                                                                                                                          Add: Premium cost of fuel contracts                                           34

            (continued)                                                                                                                                                   Deduct: Fuel hedge gains included in Fuel and oil expense, net
                                                                                                                                                                          Fuel and oil expense, as reported                                $
                                                                                                                                                                                                                                                        (30)
                                                                                                                                                                                                                                                     1,018
                                                                                                                                                                          Add: Net impact from fuel contracts                                            7
                                                                                                                                                                          Fuel and oil expense, excluding special items (economic)         $         1,025

                                                                                                                                                                          Total operating expenses, as reported                            $         4,328
                                                                                                                                                                          Add: Net impact from fuel contracts                                            7
                                                                                                                                                                          Add: Gain on sale of grounded aircraft                                        25
                                                                                                                                                  Three months
                                                                                                                                                 ended March 31,          Total operating expenses, excluding special items                $         4,360

                                                                                                                                                         2017             Deduct: Fuel and oil expense, excluding special items
                                                                                                                                                                                                                                                     (1,025)
                                                                                                                                                       as recast          (economic)
                                                                                                                                                                          Operating expenses, excluding Fuel and oil expense and
                                                                                                                                                                                                                                           $         3,335
                                                                                                                                                                          special items
   Fuel and oil expense, unhedged                                                                                                                 $                816
                                                                                                                                                                          Deduct: Profitsharing expense                                               (102)
   Add: Premium cost of fuel contracts                                                                                                                              34
                                                                                                                                                                          Operating expenses, excluding profitsharing, Fuel and oil
   Add: Fuel hedge losses included in Fuel and oil expense, net                                                                                                    106                                                                     $         3,233
                                                                                                                                                                          expense and special items
   Fuel and oil expense, as recast                                                                                                                $                956
   Add (Deduct): Net impact from fuel contracts                                                                                                                     37    Net cash provided by operating activities                        $         1,002
   Fuel and oil expense, as recast, excluding special items (economic)                                                                            $                993    Capital expenditures                                                        (409)
                                                                                                                                                                          Assets constructed for others                                                (24)
   Total operating expenses, as recast                                                                                                            $           4,248       Reimbursement for assets constructed for others                              139
   Add (Deduct): Net impact from fuel contracts                                                                                                                  37       Free cash flow                                                   $           708
   Deduct: Lease termination expense                                                                                                                             (5)
   Total operating expenses, as recast, excluding special items                                                                                   $           4,280       Net income, as reported                                          $           463
   Deduct: Fuel and oil expense, as recast, excluding special items (economic)                                                                                 (993)      Deduct: Net impact from fuel contracts                                        (7)
                                                                                                                                                                          Deduct: Gain on sale of grounded aircraft                                    (25)
   Operating expenses, as recast, excluding Fuel and oil expense and special items                                                                $           3,287       Add: Net income tax impact of fuel and special items (a)                       7
   Deduct: Profitsharing expense                                                                                                                                   (99)   Net income, excluding special items                              $           438
   Operating expenses, as recast, excluding profithsaring, Fuel and oil expense, and
                                                                                                                                                  $           3,188
   special items                                                                                                                                                          Net income per share, diluted, as reported                       $          0.79

                                                                                                                                                                          Deduct: Impact from fuel contracts                                          (0.01)
                                                                                                                                                                          Deduct: Impact of special items                                             (0.04)
                                                                                                                                                                          Add: Net income tax impact of fuel and special items (a)                     0.01
                                                                                                                                                                          Net income per share, diluted, excluding special items           $           0.75

(a) Tax amounts for each individual special item are calculated at the Company's effective rate for the applicable period and totaled in this line item.

                                                                                                                                                                                                                                                32
   April 2018
You can also read