NASDAQ: SELF Self-Storage REIT Achieving Strong Pricing Power and Lease-up Performance Driving Record Same-Store Occupancy and Revenues, with ...

Page created by Dana Riley
 
CONTINUE READING
NASDAQ: SELF Self-Storage REIT Achieving Strong Pricing Power and Lease-up Performance Driving Record Same-Store Occupancy and Revenues, with ...
®

                                                                                              NASDAQ: SELF

                                                                    ®

                                              NASDAQ: SELF

                 Self-Storage REIT Achieving Strong Pricing Power and Lease-up Performance
                    Driving Record Same-Store Occupancy and Revenues, with Double-Digit
                                      Percentage Growth in FFO & AFFO

Corporate Presentation                                                                       June 2021
NASDAQ: SELF Self-Storage REIT Achieving Strong Pricing Power and Lease-up Performance Driving Record Same-Store Occupancy and Revenues, with ...
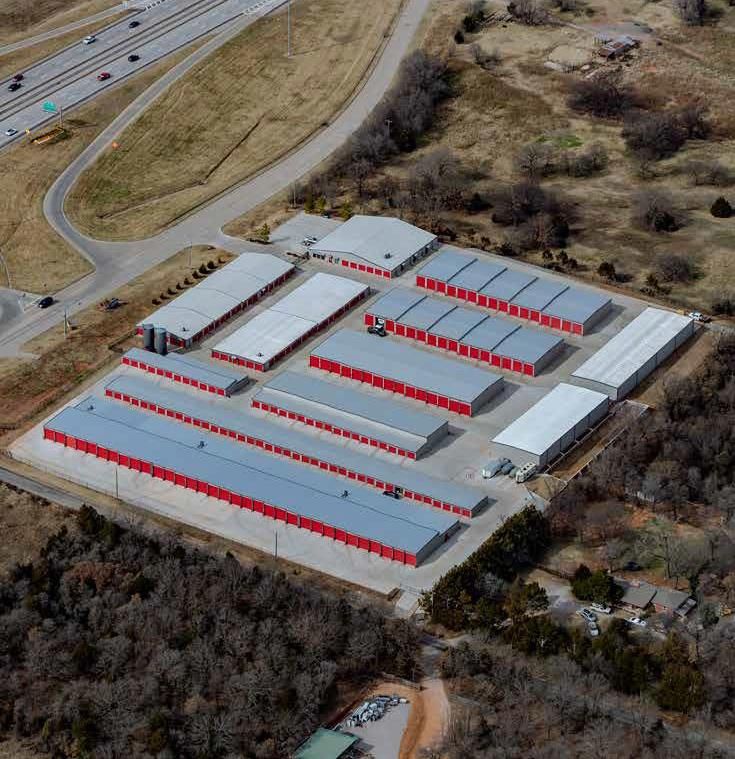
Important Cautions Regarding Forward-                                                                                                     ®

Looking Statements                                                                                                             NASDAQ: SELF

Certain information presented in this presentation may contain “forward-looking statements” within the meaning of the
federal securities laws including, but not limited to, the Private Securities Litigation Reform Act of 1995. Forward looking
statements include statements concerning the company’s plans, objectives, goals, strategies, future events, future
revenues or performance, capital expenditures, financing needs, plans or intentions, and other information that is not
historical information. In some cases, forward looking statements can be identified by terminology such as “believes,”
“plans,” “intends,” “expects,” “estimates,” “may,” “will,” “should,” “anticipates,” or the negative of such terms or other
comparable terminology, or by discussions of strategy.

All forward-looking statements by the company involve known and unknown risks, uncertainties and other factors, many
of which are beyond the control of the company, which may cause the company’s actual results to be materially different
from those expressed or implied by such statements, including the negative impacts from the continued spread of COVID-
19 on the economy, the self storage industry, the broader financial markets, the Company's financial condition, results of
operations and cash flows and the ability of the Company's tenants to pay rent. The company may also make additional
forward-looking statements from time to time. All such subsequent forward-looking statements, whether written or oral,
by the company or on its behalf, are also expressly qualified by these cautionary statements. Investors should carefully
consider the risks, uncertainties, and other factors, together with all of the other information included in the company’s
filings with the Securities and Exchange Commission, and similar information. All forward-looking statements, including
without limitation, the company’s examination of historical operating trends and estimates of future earnings, are based
upon the company’s current expectations and various assumptions. The company’s expectations, beliefs and projections
are expressed in good faith, but there can be no assurance that the company’s expectations, beliefs and projections will
result or be achieved. All forward looking statements apply only as of the date made.

The company undertakes no obligation to publicly update or revise forward looking statements which may be made to
reflect events or circumstances after the date made or to reflect the occurrence of unanticipated events. The amount,
nature, and/or frequency of dividends paid by the company may be changed at any time without notice.

Copyright © 2021 & 2020 Global Self Storage, Inc. All Rights Reserved. 060721                                                                 2
NASDAQ: SELF Self-Storage REIT Achieving Strong Pricing Power and Lease-up Performance Driving Record Same-Store Occupancy and Revenues, with ...
Non-GAAP Measures & Same-Store Definition                                                                                                                                                                         ®

                                                                                                                                                                                                 NASDAQ: SELF

Non-GAAP Measures
Funds from Operations (“FFO”) and FFO per share are non-GAAP measures defined by the National Association of Real Estate Investment Trusts (“NAREIT”) and are considered helpful measures of REIT
performance by REITs and many REIT analysts. NAREIT defines FFO as a REIT’s net income, excluding gains or losses from sales of property, and adding back real estate depreciation and amortization. FFO and
FFO per share are not a substitute for net income or earnings per share. FFO is not a substitute for GAAP net cash flow in evaluating the company’s liquidity or ability to pay dividends, because it excludes
financing activities presented on the company’s statements of cash flows. In addition, other REITs may compute these measures differently, so comparisons among REITs may not be helpful. However, the
Company believes that to further understand the performance of its stores, FFO should be considered along with the net income and cash flows reported in accordance with GAAP and as presented in the
Company’s financial statements.

Adjusted FFO (“AFFO”) represents FFO excluding the effects of business development, capital raising, and acquisition related costs and non-recurring items, which the company believes are not indicative of
the Company’s operating results. The company presents AFFO because management believes it is a helpful measure in understanding the company’s results of operations insofar as management believes that
the items noted above that are included in FFO, but excluded from AFFO, are not indicative of the company’s ongoing operating results. The company also believes that the analyst community considers its
AFFO (or similar measures using different terminology) when evaluating the company. Because other REITs or real estate companies may not compute AFFO in the same manner as the company does, and may
use different terminology, management’s computation of AFFO may not be comparable to AFFO reported by other REITs or real estate companies.

The company believes net operating income or “NOI” is a meaningful measure of operating performance because management utilizes NOI in making decisions with respect to, among other things, capital
allocations, determining current store values, evaluating store performance, and in comparing period-to-period and market-to-market store operating results. In addition, the company believes the investment
community utilizes NOI in determining operating performance and real estate values, and does not consider depreciation expense because it is based upon historical cost. NOI is defined as net store earnings
before general and administrative expenses, interest, taxes, depreciation, and amortization.

NOI is not a substitute for net income, net operating cash flow, or other related GAAP financial measures, in evaluating the company’s operating results.

Same-Store Self Storage Operations Definition
The company considers its same-store portfolio to consist of only those stores owned and operated on a stabilized basis at the beginning and at the end of the applicable periods presented. The company
considers a store to be stabilized once it has achieved an occupancy rate that management believes, based on the company’s assessment of market-specific data, is representative of similar self storage assets
in the applicable market for a full year measured as of the most recent January 1 and has not been significantly damaged by natural disaster or undergone significant renovation or expansion. The company
believes that same-store results are useful to investors in evaluating the company’s performance because they provide information relating to changes in store-level operating performance without taking into
account the effects of acquisitions, dispositions or new ground-up developments.

At March 31, 2021, the company owned nine same-store properties and three non-same-store properties. The Company believes that by providing same-store results from a stabilized pool of stores, with
accompanying operating metrics including, but not limited to, variances in occupancy, rental revenue, operating expenses, NOI, etc., stockholders and potential investors are able to evaluate operating
performance without the effects of non-stabilized occupancy levels, rent levels, expense levels, acquisitions or completed developments. Same-store results should not be used as a basis for future same-store
performance or for the performance of the Company’s stores as a whole.

                                                                                                                                                                                                                  3
NASDAQ: SELF Self-Storage REIT Achieving Strong Pricing Power and Lease-up Performance Driving Record Same-Store Occupancy and Revenues, with ...
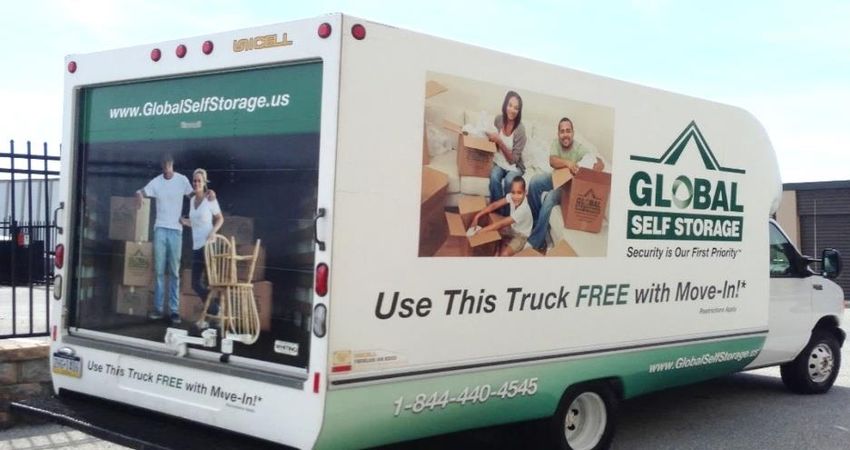
Key Stats: SELF (NasdaqCM)                                                                                                                                                     ®

                                                                                                                                                                     NASDAQ: SELF

Share Price (6/07/2021)             $6.40    Revenue 2020                                                                $9.2M             Funds From Operations (FFO) &
52 Week Range                $3.50 - $6.42   Operating Income 2020                                                       $1.2M         Adjusted Funds From Operations (AFFO)4
Avg. Daily Volume 3 mo.            22,726    Net Income 2020                                                              $274K                   Q1-20    Q1-21
Common Shares Outstanding1          9.4M     Capital Resources mrq3                                                      $8.9M
Free Float2                          92%     Total Debt mrq                                                            $24.0M                                         $634K
                                                                                                                                               $602K
Market Cap                        $60.3M     Dividends Per Share ttm                                                       $0.26
Insider Holdings                   ~8.5%     Dividend Yield ttm                                                             4.1%
Institutional Holdings              ~18%     Funds From Operations                                       $602K or $0.06
Employees                             30+    (FFO) mrq4                                                  per diluted EPS                                     $388K
                                                                                                                                       $350K
Fiscal Year End                   Dec. 31    Adjusted Funds From                                         $634K or $0.07
                                             Operations (AFFO) mrq4                                      per diluted EPS
                                             1) Total shares outstanding as of April 19, 2021.
                                             2) Free float = Total shares outstanding excluding insider ownership
                                             3) Capital resources as of Mar. 31, 2021 totaling approximately $8.9 million, comprised
                                                of $1.9 million of cash, cash equivalents, and restricted cash, $2.1 million of
                                                marketable securities, and $4.9 million available for withdrawal under the revolving
                                                credit facility.
                                             4) See definition of FFO & AFFO, both non-GAAP terms, in slide 3 of this presentation,
                                                and reconciliation to GAAP in the Appendix.
                                             Data sources: IPREO, Yahoo! Finance, SELF Form 10-Q as of March 31, 2020.

                                             mrq = most recent quarter as of March 31, 2021.
                                             ttm = trailing twelve months as of March 31, 2021.                                             FFO                    AFFO
                                             Dividend yield based on closing price as of June 7, 2021.                                                                              4
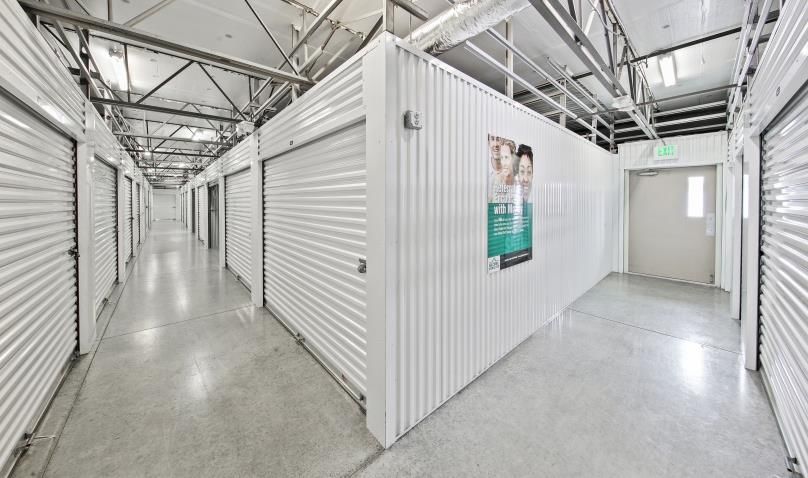
NASDAQ: SELF Self-Storage REIT Achieving Strong Pricing Power and Lease-up Performance Driving Record Same-Store Occupancy and Revenues, with ...
Who We Are                                                                                                                                      ®

                                                                                                                                     NASDAQ: SELF

• Global Self Storage is a self-administered and self-
  managed Real Estate Investment Trust (REIT).
• We own and/or manage 13 self-storage
  properties with 969,100 sf. of total leasable
  space.1
• Strong lease-up performance driving record same-
  store occupancy and revenues with double-digit
  percentage growth in FFO and AFFO.2
• Seeking to own, operate, manage and acquire
  properties where our highly-effective
  professional management and best practices can
  improve operations.

 1) As of 3/31/21; Includes outside parking (RV, boat, auto), retail, office and commercial space, and West Henrietta Acquisition.
 2) Source: Company’s Form 10-Q for March 31, 2021 as filed with the SEC.                                                                           5
NASDAQ: SELF Self-Storage REIT Achieving Strong Pricing Power and Lease-up Performance Driving Record Same-Store Occupancy and Revenues, with ...
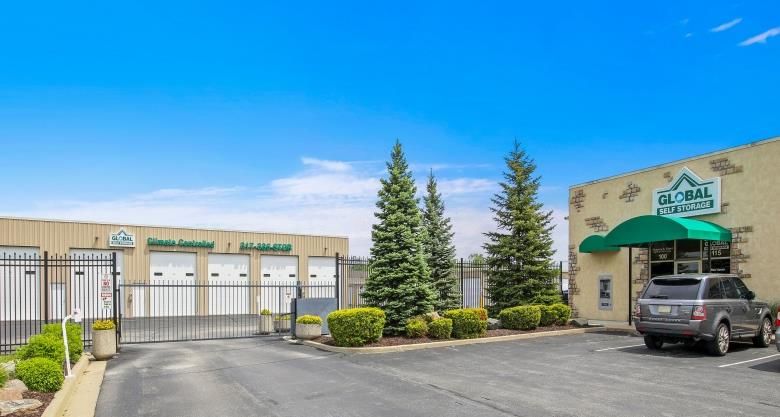
Q1 2021 Financial Results                                                                                                                                                                                 ®

                                                                                                                                                                                             NASDAQ: SELF

 Record Quarterly Results                                                                                                                      GAAP Quarterly Performance
 • Total revenues: Up 9.0% to $2.4M.                                                                                                                        Q1-20     Q1-21
 • Funds from operations: Up 72.1% to $602K or $0.06 per                                                                                                      $millions
   diluted share.1
                                                                                                                                             $2.3
 • Adjusted FFO: Up 63.2% to $634K or $0.07 per diluted share.1                                                                       $2.2           $2.1
                                                                                                                                                             $2.0
 Record Same-Store Results
 • Revenues: Up 4.7% to $1.9M.
 • NOI: Up 2.7% to $1.1M.
 • Occupancy at March 31, 2021: Up 470 basis points to 96.1%.
 Other Financial Results
 • Distributed dividends: $0.065 per share of common stock.
                                                                                                                                                                                 $0.5             $0.04
 • Same-store average tenant duration of stay: ~3.1 years at end
   of Q1 2021.                                                                                                                                                            $0.1

 • Capital resources at March 31, 2021: Totaled $8.9M,                                                                                                                                  $(0.04)
   comprised of $1.9M in cash, cash equivalents & restricted
   cash, $2.1M in marketable equity securities, and $4.9M                                                                            Total Revenues Total Expenses        Operating       Net Income
   available under a revolving credit line.                                                                                                                                Income       (Loss) per Share
1) See definition of FFO & AFFO, both non-GAAP terms, in Slide 3 of this presentation, and reconciliation to GAAP in the Appendix.                                                                          6
NASDAQ: SELF Self-Storage REIT Achieving Strong Pricing Power and Lease-up Performance Driving Record Same-Store Occupancy and Revenues, with ...
Strong Lease-up Performance at Expansions/ Conversions                                                                                                                                                                                                             ®

                                                                                                                                                                                                                                                        NASDAQ: SELF

                                          Added 32,800+ Leasable Square Feet (lsf) of Climate-controlled and Drive-up Units in 2020

                                          Millbrook, NY                                                                                         Fishers, IN                                                            West Henrietta, NY
                                Completed February 2020                                                                                Completed June 2020                                                            Completed August 2020
                                   Added 11,800 lsf                                                                                      Added 13,713 lsf                                                                Added 7,300 lsf

                                          Total Occupancy                                                                                     Total Occupancy                                                                  Total Occupancy
                                                              96.3% 97.8% 97.5% 95.6%                                                                    90.9%    91.2%
                                                                                                                                                                                              $88 .0B

                                                                                                                                                                                                                                           85.2%    85.4%    84.8%
                                                                                                                                                                                                                                                                      $70 .0K

$10 3.0B

$10 1.0B

 $99 .0B

                                                     90.9%
                                                                                                   $70 .0K
                                                                                                             $94 .0B

                                                                                                             $92 .0B
                                                                                                                                                                           89.5%    $70 .0K
                                                                                                                                                                                              $86 .0B

                                                                                                                                                                                                                                 83.4%                                $68 .0K

 $97 .0B

 $95 .0B                                                                                                     $90 .0B
                                                                                                                                     86.2%                                                    $84 .0B

                                                                                                                                                                                                                      80.5%
                                                                                                                                                84.0%
                                                                                                   $68 .0K                                                                          $68 .0K
 $93 .0B

 $91 .0B                                                                                                     $88 .0B
                                                                                                                                                                                                                                                                      $66 .0K
 $89 .0B                                                                                                                                                                                      $82 .0B

                                                                                                             $86 .0B
 $87 .0B

                                          75.9%                                                                                                                                                          77.9%
                                                                                                                                                                                    $66 .0K
                                                                                                   $66 .0K

                                                                                                                        79.1%
 $85 .0B
                                                                                                             $84 .0B
 $83 .0B                                                                                                                                                                                      $80 .0B
                                                                                                                                                                                                                                                                      $64 .0K
 $81 .0B
                                                                                                             $82 .0B
 $79 .0B
                                                                                                                                                                                    $64 .0K

                                67.0%
 $77 .0B                                                                                                                                                                                      $78 .0B
                                                                                                   $64 .0K   $80 .0B
 $75 .0B

 $73 .0B                                                                                                     $78 .0B                                                                                                                                                  $62 .0K

 $71 .0B
                                                                                                                                                                                              $76 .0B
                                                                                                                                                                                    $62 .0K
 $69 .0B                                                                                                     $76 .0B
                                                                                                   $62 .0K
 $67 .0B

 $65 .0B                                                                                                     $74 .0B
                                                                                                                                                                                              $74 .0B                                                                 $60 .0K
 $63 .0B
                                                                                                             $72 .0B                                                                $60 .0K
 $61 .0B

 $59 .0B                                                                                           $60 .0K

           45.5% 47.8%
                                                                                                             $70 .0B                                                                          $72 .0B
 $57 .0B
                                                                                                                                                                                                                                                                      $58 .0K
 $55 .0B
                                                                                                             $68 .0B
                                                                                                                                                                                    $58 .0K
 $53 .0B
                                                                                                                                                                                              $70 .0B
 $51 .0B
                                                                                                   $58 .0K   $66 .0B

 $49 .0B

 $47 .0B                                                                                                     $64 .0B                                                                                                                                                  $56 .0K
                                                                                                                                                                                              $68 .0B
 $45 .0B                                                                                                                                                                            $56 .0K

 $43 .0B                                                                                                     $62 .0B

                                                                                                   $56 .0K
 $41 .0B

                                                                                                             $60 .0B                                                                          $66 .0B
 $39 .0B
                                                                                                                                                                                                                                                                      $54 .0K
 $37 .0B                                                                                                                                                                            $54 .0K
                                                                                                             $58 .0B
 $35 .0B

 $33 .0B                                                                                                                                                                                      $64 .0B
                                                                                                   $54 .0K
                                                                                                             $56 .0B
 $31 .0B
                                                                                                                                                                                                                                                                      $52 .0K
 $29 .0B                                                                                                                                                                            $52 .0K
                                                                                                             $54 .0B
 $27 .0B                                                                                                                                                                                      $62 .0B

 $25 .0B                                                                                                     $52 .0B
                                                                                                   $52 .0K
 $23 .0B

 $21 .0B                                                                                                     $50 .0B                                                                $50 .0K   $60 .0B                                                                 $50 .0K

 $19 .0B

 $17 .0B

 $15 .0B                                                                                           $50 .0K                 At        Sep-20     Oct-20   Nov-20   Feb-21   Mar-21                           At        Sep-20      Oct-20   Nov-20   Feb-21   Mar-21
               At      Mar-20    Jun-20     Jul-20   Sep-20    Oct-20   Nov-20   Feb-21   Mar-21                                                                                                        Completion
           Completion                                                                                                  Completion
                                                                                                                                                                                                        (Aug. 2020)
           (Feb. 2020)                                                                                                 (June 2020)                                                                                                                                              7
NASDAQ: SELF Self-Storage REIT Achieving Strong Pricing Power and Lease-up Performance Driving Record Same-Store Occupancy and Revenues, with ...
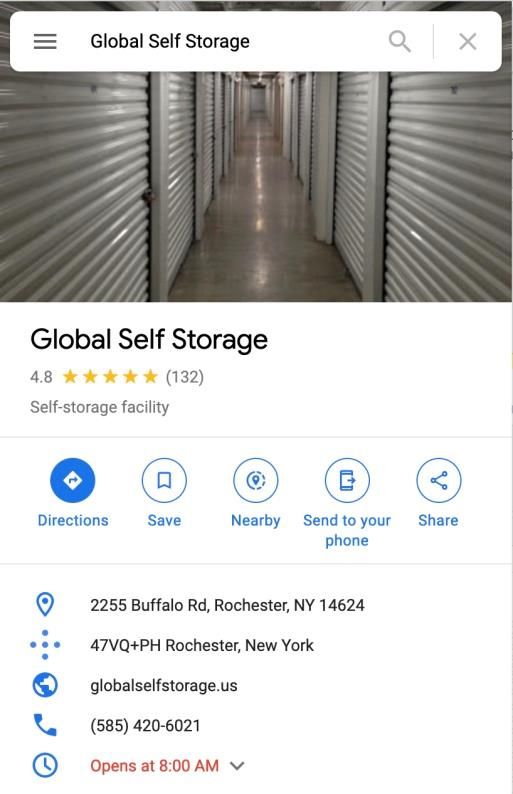
Expanding Market Opportunity                                                                                                                                           ®

                                                                                                                                                          NASDAQ: SELF

                                                                                                                       U.S. Self Storage Market Outlook1
                $44.5B                                                                   10.6%             $47 .0B

                                                                                                                                                         $44.5B
                                                                                                                                                                  $70 .0K

                    Self-Storage                                              U.S. Households with a       $45 .0B

                                                                                                                                                $43.2B
                                                                                                                                       $42.3B
                                                                                                                                                                  $68 .0K

                 Industry by 2024,                                           Self-Storage Unit in 2020     $43 .0B

                                                                                                                              $41.5B
                                                                                                                     $40.7B
                  up 9% vs 20201                                                   vs 6% in 19962          $41 .0B
                                                                                                                                                                  $66 .0K

                                                                                                           $39 .0B

                                                                                                                                                                  $64 .0K

                                                                                                           $37 .0B

                                                                                                                                                                  $62 .0K

                        49K+                                                           ~$3.0B
                                                                                                           $35 .0B

                                                                                                           $33 .0B                                                $60 .0K

                   Self-Storage                                                           Self-Storage     $31 .0B

                                                                                                                                                                  $58 .0K

                Facilities in U.S. vs.                                                   Acquisitions in   $29 .0B

                   47K in 20193                                                              20204         $27 .0B
                                                                                                                                                                  $56 .0K

                                                                                                           $25 .0B

                                                                                                                                                                  $54 .0K

                                                                                                           $23 .0B

                                                                                                                                                                  $52 .0K

                                                                                                           $21 .0B

1)   IBISWorld: Storage & Warehouse Leasing in the US – Industry Outlook (2019-2024) Report.               $19 .0B                                                $50 .0K

2)   SSA Self Storage Demand Study, 2020 and The Growth of Self Storage: Market for Improved Visibility.
3)
4)
     2021 Self Storage Almanac.
     MJ Partners Self Storage Market Overview – Fourth Quarter 2020 Results – Includes wholly-owned
                                                                                                                     2020     2021     2022     2023     2024
     property acquisitions and joint venture acquisitions.                                                                                                                  8
NASDAQ: SELF Self-Storage REIT Achieving Strong Pricing Power and Lease-up Performance Driving Record Same-Store Occupancy and Revenues, with ...
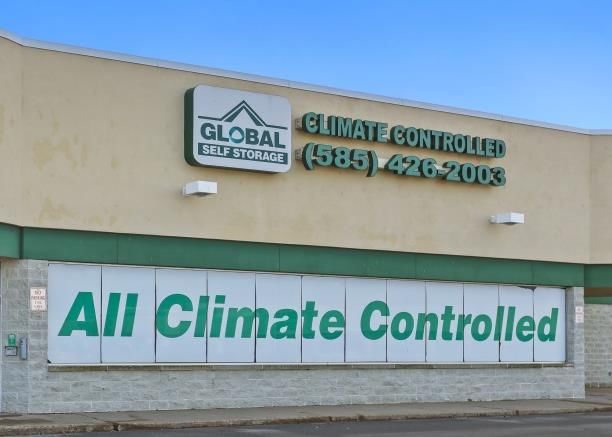
Key Industry Growth Drivers:                                                                                                            ®

High Occupancy Rates, Job Growth & Population Growth                                                                       NASDAQ: SELF

                                                                                       U.S. Self-Storage Market
 • Industry-wide demand remains high: average
                                                                                          Average Occupancy Rates
   occupancy rates still above 92% in 2020.1
 • Rate high despite increased supply of ~58M                                                                                   92.2%
   new net rentable sq. ft.1
 • Demand is strong and shifting to lower cost                    75.7%
   cities as population and migration growth
   increase in secondary markets.2

                                                                    $0. 4B

                                                                   10        11   12     13      14    15   16   17   18   19    20
1) 2021 Self Storage Almanac
2) Marcus & Millichap 2020 Self-Storage U.S Investment Forecast    Source: 2021 Self Storage Almanac                                      9
NASDAQ: SELF Self-Storage REIT Achieving Strong Pricing Power and Lease-up Performance Driving Record Same-Store Occupancy and Revenues, with ...
Highly-Fragmented U.S. Self-Storage Market                                                                                                      ®

                                                                                                                                        NASDAQ: SELF

                                                                                 49,233 Total Facilities in U.S.

                                                                                                                   5.8%
     71%                                                                                                            3.8%     Only ~20%
     Self-storage
     properties
                                                                               80%                                   2.6%
                                                                                                                             of the Market is
                                                                                                                             controlled by the
     managed by                                                        of Properties                                 1.8%    Top Six publicly-
     independent                                                         Non-REIT                                            traded self-storage
                                                                                                                      3.6%   companies.
     (mom & pop)
     operators                                                                                                      1.9%     (5 REITs + U-HAUL)

                                        High Fragmentation = Acquisition & Third-Party Management Opportunities
Source: SpareFoot StorageBeat U.S. Self-Storage Industry Statistics and 2021 Self Storage Almanac                                                  10
Market Dynamics                                                  ®

                                                      NASDAQ: SELF

• Continued ownership consolidation: large and
  midsize operators purchasing facilities owned and
  managed by smaller operators.
• Growing difference in operational management
  expertise between the larger, more sophisticated
  operators and the rest of the field.
• Internet and technology making it easier for
  consumers to shop for and rent units:
    • Internet marketing
    • Self-service kiosks
    • Call centers

                                                                 11
Target Market Factors                                                                                                                                                                ®

                                                                                                                                                                              NASDAQ: SELF

    • We’re focused on secondary & tertiary cities in the                                                    New Self-Storage Supply Concentration
      Northeast, Mid-Atlantic, Midwest & South-Central U.S.                                       37.7%                  % of NRSF under Construction

    • Generally targeting markets outside the top 25 MSAs that
                                                                                                                         23.0%
      have experienced dramatically slower supply growth.                                                                                      17.8%
                                                                                                                                                                   13.8%
    • Less competition from public REITs in these markets                                                                                                                    7.6%
      support outlook for stronger risk-adjusted returns.
    • Expect above average growth in rents due to favorable                                       Top 10                 11- 20                 21 - 30            31- 40    41- 50
      supply/demand dynamics.                                                                                                              MSA Ranking

                           Example Target MSAs – Square Foot per Capita                                                Public Peer MSA Concentration2
         Top 50 Avg                                                   6.3                                             Storage REIT Exposure to Top 25 MSAs
         Kansas City                                                5.9                             75%                          70%
           Columbus                                             5.6                                                                                          61%
                                                                                                                                                                            55%
      Milwaukwee                                               5.5
           Cleveland                                          5.4
       Indianapolis                                           5.3
                                                                          5.0 Average
       Minneapolis                                      4.4
                Buffalo                                4.3
                                                                                                   CUBE                          PSA                         EXR            LSI
               Chicago 1                             4.0                                Source: STR
1) Focus on exurbs of Chicago
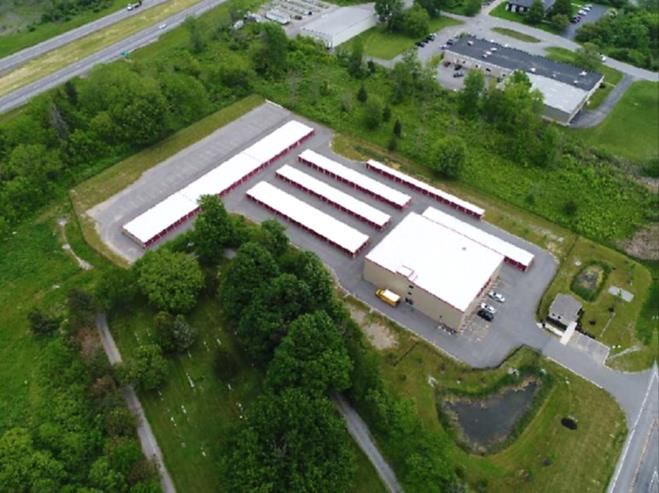
                                                                                        2) Bank of America Merrill Lynch Research Report, January 26, 2018                               12
We Address the Market Opportunity with a                                                                                                                                                     ®

Diverse Portfolio of Self-Storage Properties                                                                                                                                   NASDAQ: SELF

Global Self Storage properties are primarily
located in secondary or tertiary cities in the
Northeast, Mid-Atlantic, Midwest, South                                                                                                           Rochester, NY        Millbrook, NY
                                                                                                                                                W. Henrietta, NY
Central regions:                                                                                                                                                             Clinton, CT
                                                                                                                              Bolingbrook, IL    Merrillville, IN       Sadsburyville, PA
                                                                                                                                   Dolton, IL
    • Near metropolitan areas.                                                                                                                          Lima, OH
                                                                                                                                        Fishers, IN
    • Excellent road or highway exposure.
    • Prominent road-side signage.
                                                                                                                              ⚫ Edmond, OK
    • Easily accessible.                                                                                                                                            Summerville I & II, SC

    • Clean, well-maintained properties with
      minimal deferred maintenance.
    • Strong market fundamentals (demographics).
                                                                                                                 Facilities                     13
    • High competitive barriers to entry (zoning).
                                                                                                                 Units                     6,970         ⚫ Owned Properties
                                                                                                                                                         ⚫ 3rd Party Management Properties
                                                                                                                 Leasable Sq. Ft.       969,100
Facility data as of 3/31/2021. Includes outside parking (RV, boat, auto), retail, office and commercial space.
                                                                                                                                                                                             13
Good Mix Across Properties1                                                        ®

                                                                          NASDAQ: SELF

                            60%               32%                  8%
        Traditional Indoor               Climate Controlled   Outdoor Storage
             Storage2                         Storage         Boats/Cars/RVs
1) Percentage figures as of 3/31/2021.
2) Includes non-storage space.                                                       14
Why Customers Choose Us:                                                                                   ®

High Quality Service & Facilities                                                               NASDAQ: SELF

                                                                                   24/7 Security
                                                             Easy Gate Access
• Property managers encouraged to maintain the                                      Monitoring
  highest security and cleanliness standards.
• Employees are motivated to deliver courteous,
  attentive customer service.
• All facilities include customer service call centers and
  24/7 rental and payment kiosks.
• Our goal is to make the customer experience as                 24/7 Rental & Payment Kiosks
  pleasant and hassle-free as possible.

                                                                                                           15
How We Attract & Retain High Quality Tenants                      ®

                                                       NASDAQ: SELF

• Prioritize tenant quality in marketing and
  operational efforts.
• Focus on credit card payers, who rent for longer
  duration and accept greater rental rate increases.
• Referral marketing generates new tenant
  inquiries for high quality new tenants.
• Strong Internet & social media presence
  generate new tenant inquiries.
• Certain facilities offer referral discounts and
  complementary truck rental.
• As a result, average same-store tenant duration
  was ~3.1 years in Q1 2021.

                                                                  16
Key Competitive Factors vs. Public REIT Peers                                     ®

                                                                       NASDAQ: SELF

• Attract quality, long-staying tenants by incentivizing credit card
  auto-payers.
• Effective revenue rate management program:
    • Dynamic rate management through daily analysis of
      competitive rates.
    • Systematic rate increases per customers.
    • Self-service kiosks make rentals and payments convenient.
• Greater agility – allows innovation and faster response to
  market conditions and trends.
• Security is Our First PrioritySM – we provide high-end and highly
  secure facilities with security cameras.
• Positive reviews on Google and other platforms attract
  customers.

                                                                                  17
Our Outperformance of Other Publicly-Traded Self-Storage                                                                                                                                                   ®

REITs Reflects Our Focus on Secondary & Tertiary Markets                                                                                                                                        NASDAQ: SELF

                               Same-Store Revenue % Growth                                                                       Same-Store Net Operating Income (NOI) % Growth

12%

10%

8%

6%

4%

2%

0%
                 2016                     2017                     2018                     2019                     2020              2016             2017        2018        2019            2020
-2%

-4%
                          Global Self Storage                       CubeSmart                  National Storage Affiliates         Life Storage, Inc.    Extra Space Storage   Public Storage

Source: 2016 - 2020 reports on Form 10-K filed with the SEC by public self-storage REITs (SELF, PSA, EXR, LSI, NSA, and CUBE).                                                                             18
Strong Same-Store Metrics                                                                                                                                                                                                   ®

                                                                                                                                                                                                         NASDAQ: SELF

                     Annual Comps, % Change                                                                                     Quarterly Comps, % Change
                                                  $millions                                                                                                     $millions

                                              2019               2020                                                                                     Q1-20                      Q1-21

                                                                              340
                                                                           basis points
                                                                                           (3.2)%                                                                                          470
                                                                                                                                                                                        basis points
     0.7%

                                                                                   95.1%
                                                                                                                                                                                                          (0.6)%

                                                                           91.7%

                                                                                           $11.94
                                                                                                                4.7%

                                                                                                    $11.56

                                                                                                                                                                                                 96.1%
                                                                                                                                                                                         91.4%
            $7.4
  $7.4

                                                                                                                                                                                                          $11.95

                                                                                                                                                                                                                   $11.88
                                                          7.8%

                                                                                                                       $1.93
                                                                                                              $1.84
                                                                                                                                                                    2.7%
                                (8.8)%
                                                                  $4.6
                                                        $4.2

                                                                                                                                          7.6%

                                                                                                                                                                             $1.1
                                                                                                                                                                   $1.1
                             $3.2

                                       $2.9

                                                                                                                                                  $0.80
                                                                                                                                        $0.75
Revenues                  Cost of                     Net       Sq. Ft.   Revenue/                           Revenues                Cost of                     Net       Sq. Ft.   Revenue/
                         Operations                 Operating Occupancy Leased Sq. Ft.                                              Operations                 Operating Occupancy Leased Sq. Ft.
                                                  Income (NOI)                                                                                               Income (NOI)
Source: Company’s Form 10-K for December 31, 2020 as filed with the SEC.                                     Source: Company’s Form 10-Q for March 31, 2021 as filed with the SEC.                                          19
Publicly-Traded Self-Storage REIT                                                                                                                                                                                   ®

    Same-Store Comparison – Q1 2021                                                                                                                                                                          NASDAQ: SELF

                                        Revenue Growth                                                     NOI Growth                                         Occupancy Rate - EOQ           Dividend Yield ttm
            Global Self
                                                         4.7%                                      2.7%                                                                              96.1%                 4.1%
            Storage
         Nat. Storage
                                                                               8.1%                                              11.5%                            93.8%                            2.9%
         Affiliates
          Extra Space
                                                        4.6%                                                    6.5%                                                                95.7%        2.4%
          Storage

           CubeSmart                                                 6.7%                                               8.9%                                                94.4%                   3.0%

          Life Storage                                                     7.3%                                         8.6%                                        94.0%                          2.8%

     Public Storage                            3.4%                                                            6.7%                                                                  96.0%        2.7%

                        Global Self Storage Tops the Publicly-Traded Self-Storage REIT Industry in Occupancy & Dividend Yield

TTM = trailing twelve months; dividend yield based on closing price as of June 7, 2021.
EOQ = End of quarter
Note: Based on information obtained in reports on Form 10-Q as of March 31, 2021 as filed with the SEC by public self-storage REITs (SELF, PSA, EXR, LSI, NSA, and CUBE).                                               20
Publicly-Traded Self-Storage REIT                                                                                                                                                                               ®

     Same-Store Comparison – Full Year 2020                                                                                                                                                               NASDAQ: SELF

                                    Revenue Growth                                                         NOI Growth                                          Occupancy Rate - EOQ        Dividend Yield ttm

        Global Self Storage                                              0.7%                                                       7.8%                                           95.1%                4.1%

  Nat. Storage Affiliates                                                   1.7%                                            2.2%                                   91.8%                        2.9%

      Extra Space Storage                              -0.1%                                        -0.7%                                                                          94.8%      2.4%

                        CubeSmart                                      0.8%                                           0.1%                                                 93.4%                 3.0%

                      Life Storage                                         1.6%                                               2.3%                                      92.9%                    2.8%

                 Public Storage -1.0%                                                          -2.3%                                                                            94.2%           2.7%

       Global Self Storage Tops the Publicly-Traded Self-Storage REIT Industry in NOI Growth, Occupancy & Dividend Yield

TTM = trailing twelve months; dividend yield based on closing price as of June 7, 2021.
EOQ = End of quarter
Note: Based on information obtained in reports on Form 10-K as of Dec. 31, 2020 filed with the SEC by public self-storage REITs (SELF, PSA, EXR, LSI, NSA, and CUBE).                                                21
Same-Store NOI Growth Comps to Peers                                                                                                                                                                                                                                       ®

                                                                                                                                                                                                                                                                  NASDAQ: SELF

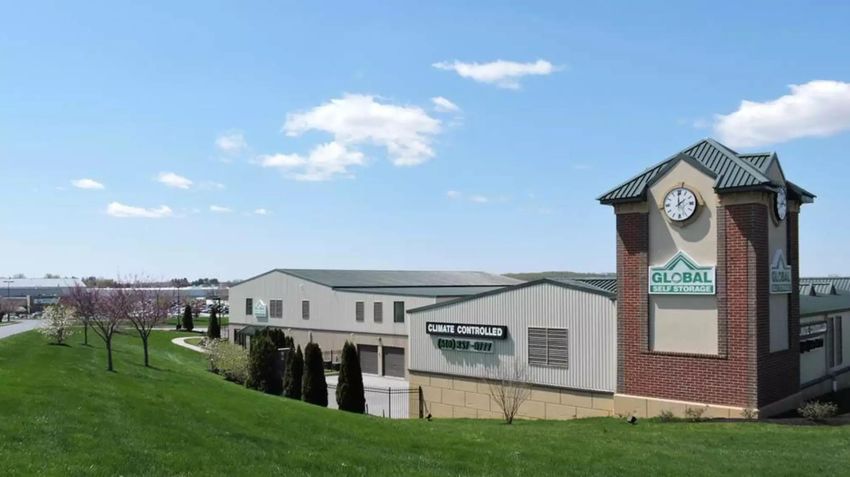
       Global Self Storage Among Top Publicly-Traded Self-Storage
       REITs for Net Operating Income Y/Y Growth
                                                                                                                                                                                                                                                     11.7%
           2018                  2019                  2020

                                                                                                                                                                                                                                                                       7.8%

                                                                                                                                                                      4.7% 5.0%
                                                                                     4.1%                                    4.0%                                                                                                                               4.2%
                                            3.3%                                                3.0%                                                                                                          3.4%
                                                                                                                                         2.9%
                                                                                                            2.3%                                                                             2.2%                         2.4%
    0.9%                                                1.1%
                0.2%                                               0.1%                                                                                                                                                              0.3%

                PSA                                    CUBE                                       LSI                                     EXR                                     NSA                                Peer Avg.¹                                 SELF
                                                                                                                                                   -0.7%
                          -2.3%

1) Average of public peers. Does not include Global Self Storage (SELF) in average. Presentation based on information obtained in Form 10-Ks as of December 31, 2020 as filed with the SEC by public self-storage REITs (SELF, PSA, EXR, LSI, NSA, and CUBE).                 22
Our Acquisition & Expansion Focus                                                                                                                                                                                  ®

                                                                                                                                                                                                     NASDAQ: SELF

• Targeting acquisitions where our professional
  management can add value:
           • Improve revenue rate management.                                                                                                                           Rochester, NY        Millbrook, NY
                                                                                                                                                                      W. Henrietta, NY
           • Increase occupancy rates.                                                                                                                                                             Clinton, CT
                                                                                                                                                    Bolingbrook, IL    Merrillville, IN       Sadsburyville, PA
           • Expand leasable sq. ft on existing property.                                                                                                Dolton, IL
                                                                                                                                                                              Lima, OH
           • Introduce new revenue streams, like insurance                                                                                                    Fishers, IN
             premiums for tenant-stored items.
• Target markets also present high barriers-to-entry for                                                                                             ⚫ Edmond, OK
                                                                                                                                                                                          Summerville I & II, SC
  new self-storage development due to difficult
  permitting. This can make acquisitions particularly
  attractive.
• Capital resources available at Mar. 31, 2021 totaled
  ~$8.9M, providing operational flexibility for self-storage                                                                                71% of U.S. self-storage
  property acquisitions, either directly or through joint                                                                                   properties are managed
  ventures, and expansions at our existing properties.1                                                                                                                        ⚫ Owned Properties
                                                                                                                                            by independent (mom &
                                                                                                                                                                               ⚫ 3rd Party Management Properties
1) Capital resources as of Mar. 31, 2021, totaling approximately $8.9 million, comprised of $1.9 million of cash, cash equivalents, and
                                                                                                                                            pop) operators.
   restricted cash, $2.1 million of marketable securities, and $4.9 million available for withdrawal under the revolving credit facility.                                                                          23
Expansion/Lease Up Case Study:                                                            ®
Millbrook, NY                                                                  NASDAQ: SELF

• February 2020, completed expansion of Millbrook, NY store
  that added 11,800 leasable sq. ft. of valuable climate-
  controlled units.
• Expansion increased non-occupied, available lease space
  from 11.3% to 54.5%.
• Tailored lease-up program increased occupancy to 95.6%
  by end of Mar. 2021 – much higher than before adding the
  new units and despite COVID-19.                              Millbrook, NY

• Strong lease up performance driven by:
    • Meeting pent-up demand for climate-controlled storage.
    • Increased migration to the suburbs.
    • Effective internet & digital marketing.
    • Attractive roadside signage and drive-by curb appeal.
                                                                                          24
Acquisition Case Study:                                                                                                     ®

481-unit Property in West Henrietta, NY                                                                          NASDAQ: SELF

• Nov. 2019, acquired Erie Station Storage for $6.2M.

• Located in West Henrietta, N.Y., a growing upstate suburban
  community of Rochester near the Rochester Institute of Technology.

• Seven buildings less than three years old.

• 55,550 net leasable sf.

• 481 storage units (230-climate controlled).

• Aug. 2020, completed property expansion adding 7,300 leasable sf.
  of drive-up storage units.
                                                                       Newly Acquired Storage Property in West Henrietta, NY
• Increased occupancy from 77.9% in Aug. 2020 to 84.8% in Mar.
  2021.

• Tailored lease-up programs produced better than expected results
  despite COVID-19.

• Benefits immediately from our effective management techniques.
                                                                                                                            25
Expansion/Upgrade Case Study:                                                                 ®
Converting to Climate-Controlled Units                                             NASDAQ: SELF

• June 2020, completed conversion of certain
  commercially-leased space to climate-controlled self
  storage units in McCordsville, Indiana.
• Added ~135 of all-climate-controlled units with 13,713
  sq. ft. of leasable space.
• Brought total at this location to 535 units and 76,360
  leasable sq. ft. of self storage space.
• Increased occupancy from 79.1% in June 2020 to 89.5%
  in Mar. 2021.
• As with all of our properties, we expect the new
  climate-controlled units to generate higher margins
  versus non-climate-controlled units.

                                                           McCordsville, Indiana              26
Third-Party Management Platform:                                                                                      ®
Global MaxManagement                       SM
                                                                                                           NASDAQ: SELF

                                                                 Global MaxManagement Example Property
• Third-party management platform launched in 2019.
• Multiple advantages and benefits:
  • Additional revenue stream through management fees
    and tenant insurance premiums.
  • Expands brand awareness.
  • Builds captive acquisition pipeline.
• Signed first self-storage client in Oct. 2019, located in
  Edmond, Oklahoma.
• Actively marketing the platform to:
    • Property developers.
    • Single-property self-storage operators.
    • Small-portfolio self-storage operators.                 • Self-Storage client property located in Edmond, Okla.
                                                              • 137,118-leasable sf.
                                                              • 618 climate-controlled & non-climate-controlled units 27
Growth Strategies                                                                                       ®

                                                                                             NASDAQ: SELF

Pursue expansion   Further enhance     Grow Global             Acquisitions that   Joint venture
opportunities      existing property   MaxManagementSM         could add wholly-   opportunities.
throughout our     performance         client base,            owned properties
portfolio.         utilizing our       recurring revenue       to our portfolio.
                   revenue rate        stream and captive
                   management          acquisition pipeline.
                   program.

                                                                                                        28
Update Related to COVID-19 Pandemic                                                                                                                                                           ®

                                                                                                                                                                                 NASDAQ: SELF

• Continued operations & provided tenant access at all stores and continued to
  protect tenants and employees by following applicable COVID-19 safety guidelines.
• Benefited from contactless technology deployed pre-COVID-19 that provides
  tenants online leasing and payment options, as well as on-site kiosks that facilitate
  contactless rentals, lock purchases & payments 24/7.
• Rent collections in Q1-21 have remained consistent year over year at 97%+,
  despite the COVID-19 pandemic.
• Pivoted to digital and print marketing for Global MaxManagement.
• Capital resources1 available at March 31, 2021 totaled ~$8.9M, providing
  operational flexibility for self-storage property acquisitions, either directly or
  through joint ventures, and expansions at our existing properties.
• Remaining cautious in 2021 due to the continuing uncertainty related to the
  impacts of the COVID-19 pandemic, including the potential for future stay-at-home
  orders, uncertain economic climate, and potential impact on rentals, vacates,
  pricing, receivables, auctions and existing customer rent increases.
                                                                                                                                                    We offer onsite kiosks available 24/7 at
                                                                                                                                                    every location. New tenants can rent a unit
                                                                                                                                                    or current tenants can pay their rent. Our
1) Capital resources as of Mar. 31, 2021 totaling approximately $8.9 million, comprised of $1.9 million of cash, cash equivalents, and restricted
   cash, $2.1 million of marketable securities, and $4.9 million available for withdrawal under the revolving credit facility.                      kiosks can even dispense locks.            29
Key Takeaways                                                                                                                                                                            ®

                                                                                                                                                                               NASDAQ: SELF

                                                                                                                                           Funds From Operations (FFO) &
• Peer-leading self-storage REIT with double-digit percentage
                                                                                                                                       Adjusted Funds From Operations (AFFO)2
  growth in FFO and AFFO driven by record same-store revenue
  and occupancy; highest dividend yield and occupancy vs.                                                                                               Q1-20   Q1-21
  peers.1
• Continued to demonstrate resiliency during COVID-19                                                                                                                      $634K
                                                                                                                                                     $602K
  pandemic.
• Unique focus on high-quality tenants in select markets
  supports higher occupancy rates, longer lengths of stay and
  revenue rate increases.                                                                                                                                       $388K
• Pursuing growth initiatives, including third-party                                                                                   $350K
  management, in existing and target markets with disciplined
  acquisition and expansion strategies.
• Capital resources provide operational flexibility for self-
  storage property acquisitions and expansions at our existing
  properties.
 1) Presentation based on information obtained in Form 10-Qs as of March 31, 2021 as filed with the SEC by public self-storage REITs
    (SELF, PSA, EXR, LSI, NSA, and CUBE). See definition of FFO & AFFO, both non-GAAP terms, in slide 3 of this presentation, and
    reconciliation to GAAP in the Appendix.
 2) See definition of FFO & AFFO, both non-GAAP terms, in slide 3 of this presentation, and reconciliation to GAAP in the Appendix.
                                                                                                                                               FFO                      AFFO
                                                                                                                                                                                          30
®

                                                                  NASDAQ: SELF

                                        ®

                         NASDAQ: SELF

                          Contact Us
Global Self Storage, Inc.               Investor Relations
Mark C. Winmill                         Ron Both or Grant Stude
President & CEO                         CMA Investor Relations
Tel (212) 785-0900 Ext 201              Tel (949) 432-7557
mwinmill@globalselfstorage.us           SELF@cma.team
ir.globalselfstorage.us

                                                                                 31
®

           NASDAQ: SELF

Appendix

                          32
Management Team                                                                                                                                                                                       ®

                                                                                                                                                                                        NASDAQ: SELF

 Mark C. Winmill           Thomas O’Malley              Donald Klimoski II            Robert J. Mathers            Gary Chatfield            Russell             Angelito Sarabia     Isabella Rahm
  CEO & President            CFO, Treasurer &             General Counsel,            Property Operations,       Customer Operations,      Kamerman                   Controller          Marketing
                              Vice President            Secretary, CCO & Vice            Vice President              Vice President        Asst. General                                  Consultant
Chief executive officer                                                                                                                                          Controller and
since company’s
                                                              President                                                                    Counsel, Asst.
                           Chief financial officer,                                   Vice president of          Vice president of                               accounting          Independent
inception in 2012.         chief accounting           General counsel, secretary,     property operations        customer operations    Secretary, Asst. CCO     coordinator since   marketing consultant
                           officer, treasurer and     chief compliance officer        since company’s            since 2020.              & Vice President       2013.               to the company since
37+ years of real
                           vice president since       and vice president since        inception in 2012.                                Assistant general                            June 2020.
estate investing                                                                                                 10+ years of self-                              15+ years of
                           company’s inception in     2017.                           30+ years of real estate                          counsel, assistant
experience.                                                                                                      storage operations                              combined            Previously served as
                           2012.                                                      property operations                               secretary, assistant
                                                      Previously, served as the                                  experience.                                     experience in       marketing
Led the acquisition,       31+ years of financial                                     management                                        chief compliance
                                                      associate general counsel                                                                                  financial and       coordinator of the
development and            and operating                                              experience.                                       officer and vice
                                                      of NASDAQ-listed                                                                                           management          company from
management of over         experience in the real                                                                                       president since
                                                      Commvault Systems from                                                                                     services.           August 2017 to June
50 projects valued at      estate, financial                                                                                            2014.
$300+ million since                                   2014 to 2017.                                                                                                                  2020.
                           services, and
1982, including over                                                                                                                    Previously, an                               Prior to joining the
                           investment                 Prior to leaving private
$65 million of self-                                                                                                                    associate at Fried,                          company, studied at
                           management sectors.        practice, was an associate
storage properties                                                                                                                      Frank, Harris, Shriver                       the University of
                                                      at Sullivan and Cromwell,
since 2012.                Previously served as                                                                                         & Jacobson LLP and
                                                      where his practice focused                                                                                                     Pennsylvania and
                           assistant controller of                                                                                      Kleinberg, Kaplan,
Previously founder                                    on mergers and                                                                                                                 graduated in May
                           the investment                                                                                               Wolff & Cohen,
and CEO of Bull &                                     acquisitions, securities law,                                                                                                  2017.
                           advisory, Reich &                                                                                            where his practice
Bear, a nationwide                                    corporate governance,
                           Tang. Earlier, was an                                                                                        focused on asset
discount broker, from                                 intellectual property and
                           audit manager at RSM.                                                                                        management,
1987 until its sale to                                related matters from 2008
                                                                                                                                        securities law,
the Royal Bank of          Certified public           to 2014
                                                                                                                                        compliance, and
Canada in 1999.            accountant.
                                                      Member of the New York                                                            other corporate
Trustee of two                                        and New Jersey State Bars,                                                        matters 2008 - 2014.
charitable                                            and U.S. Patent and
                                                                                                                                        Member of the New
foundations,                                          Trademark Office.
                                                                                                                                        York State Bar.
numerous family
trusts and a director of
two other companies.
                                                                                                                                                                                                        33
Self Storage Resiliency in COVID-19 Era                                                       ®

                                                                                   NASDAQ: SELF

During COVID-19 pandemic, Self Storage industry continued to demonstrate
resiliency to economic pauses and black swan events.
• After an abrupt slow-down in mid-March to mid-April, the Self Storage industry
  demonstrated its resiliency once again.
• New demand generators emerged: home office expansion, remote classrooms,
  relocation of remote workers, and contracting businesses.
    • Accelerated move-in activity during the summer, fall and winter.
    • Drove occupancies to all-time highs.

• Transaction activity resumed, as debt markets stabilized and promising
  operating performance attracted additional capital flow into the industry.
• Self-storage business model with these new demand generators demonstrated
  greater defensive investment opportunities compared to alternative property
  sectors.
                                                                                              34
Occupancy Rate Change by Facility                                                                                                                                     ®

                                                                                                                                                         NASDAQ: SELF

Same-Store Average Tenant Duration of Stay of ~3.1 Years                                                                      Leasable      Occupancy by Sq. Ft.1
                                                                                                 Year Acquired   Unit Count
@ March 31, 2021                                                                                                                 Sf.     @ 3/31/2021     @ 3/31/2020

Owned Stores
    Bolingbrook, IL                                                                                  2013           805       113,700      98.2%            93.0%
    Clinton, CT                                                                                      2016           182       30,408       95.5%            90.5%
    Dolton, IL                                                                                       2013           652       86,590       96.2%            91.6%
    Lima, OH                                                                                         2016           728       97,755       94.4%            91.9%
    Merrillville, IN                                                                                 2013           568       80,870       95.6%            90.3%
    Rochester, NY                                                                                    2012           640       68,101       96.4%            95.8%
    Sadsburyville, PA                                                                                2012           693       78,857       96.2%            92.4%
    Summerville I, SC                                                                                2013           563       76,560       96.0%            85.7%
    Summerville II, SC                                                                               2013           246       42,760       95.6%            89.5%
       Owned Same-Stores: Totals & Averages                                                                        5,077      675,601      96.1%            91.4%
    McCordsville, IN (non-same store due to conversion of commercial space)                          2016           536        76,360      89.5%            74.1%
    Millbrook, NY (non-same store due to unit expansion)                                             2016           260        24,472      95.6%            47.8%
    West Henrietta , NY (non-same store since acquired in Nov. 2019)                                 2019           479        55,550      84.8%            79.5%
         Owned Non-Same-Stores: Totals & Averages                                                                  1,275      156,382      88.8%            71.5%
    Owned Stores: Totals & Averages                                                                                6,352      831,982      94.8%           87.8%
Managed Stores
    Edmond, OK (Managed 3rd party location starting Oct. 2019)                                       2019           618       137,118      97.8%            87.6%
Grand Totals & Averages                                                                                            6,970      969,100      95.2%           87.8%
1) “Occupancy by square feet” includes the expansion and redevelopment projects at our stores.                                                                         35
GAAP Financial Results: 2020 vs. 2019                                                                             ®

                                                                                                        NASDAQ: SELF

                                                                Year Ended   Year Ended
                                                                 Dec. 31,     Dec. 31,    Change      % Change
                                                                   2020         2019

Total Revenues                                                  $9,196,524   $8,668,322   528,202      6.1%

Total Expenses                                                  $7,976,312   $7,267,498   708,814      9.8%

Operating Income                                                $1,220,212   $1,400,824   (180,612)   (12.9)%

Net Income (Loss)                                               $274,341     $590,619     (316,278)   (53.6)%

Net Income (Loss) Per Share                                       $0.03        $0.08       (0.05)         -

For further details, please refer to the Company’s 2020 10-K.                                                      36
GAAP Financial Results: Q1 2021 vs Q1 2020                                                                          ®

                                                                                                          NASDAQ: SELF

                                                                     Q1 2021    Q1 2020     Change      % Change

Total Revenues                                                    $2,442,188   $2,239,544   202,644       9.0%

Total Expenses                                                    $1,978,255   $2,123,880   (145,625)    (6.9)%

Operating Income                                                    $463,933   $115,664     348,269     301.1%

Net Income (Loss)                                                   $411,247   $(356,424)   767,671       N/A

Net Income (Loss) Per Share                                            $0.04    $(0.04)       0.08        N/A

For further details, please refer to the Company’s 10-Q for March 31, 2021.                                          37
Same-Store Properties: 2020 vs. 2019                                                                                ®

                                                                                                           NASDAQ: SELF

                                                                     Year Ended Dec. 31,

                                                                  2020             2019      Change      % Change

Revenues                                                        $7,429,913      $7,380,379    49,534       0.7%

Costs of Operations                                             $2,876,893      $3,155,142   (278,249)    (8.8)%

Net Operating Income                                            $4,553,893      $4,225,237   327,783       7.8%

Sq. Ft. Occupancy                                                 95.1%           91.7%       340 bp        -

Annual Revenue/Leased Sq. Ft.                                    $11.56           $11.94      $(0.38)     (3.2)%
For further details, please refer to the Company’s 2020 10-K.                                                         38
Same-Store Properties: Q1 2021 vs Q1 2020                                                                                         ®

                                                                                                                        NASDAQ: SELF

                                                                         Three Months Ended
                                                                    March 31,                   March 31,
                                                                                                            Change    % Change
                                                                     2021                        2020

Revenues                                                           $1,929,388                  $1,843,653   85,735      4.7%

Costs of Operations                                                  $802,636                   $746,007    56,629      7.6%

Net Operating Income                                               $1,126,752                  $1,097,646   29,106      2.7%

Sq. Ft. Occupancy                                                      96.1%                       91.4%    470 bp       -

Annualized Revenue/Leased Sq. Ft.                                      $11.88                     $11.95    $(0.07)    (0.6)%

For further details, please refer to the Company’s 10-Q for the quarter and year ended March 31, 2021.                             39
Industry Leading Growth Performance                                                           ®

                                                                                   NASDAQ: SELF

                 Self-Storage 2020 Same-Store Net Operating Income Public-Comps
           Company                  2020             2019          Change         % Change

Global Self Storage             $4,553,020       $4,225,237       372,783          7.8%

CubeSmart                      $407,702,000     $407,407,000       295,000          0.1%

National Storage Affiliates    $241,586,000     $236,483,000      5,103,000         2.2%

Life Storage                   $331,556,000     $324,020,000      7,536,000         2.3%

Extra Space Storage            $769,936,000     $775,273,000     (5,337,000)       (0.7)%

Public Storage                 $1,748,718,000   $1,790,466,000   (41,748,000)      (2.3)%

Source: 2020 10-K filings                                                                     40
Q1 2021 FFO and AFFO                                                                                                                                        ®

                                                                                                                                              NASDAQ: SELF

                                                                                                               For the Three Months Ended March 31,
                                                                                                              2021                             2020
Net income (loss)                                                                                         $         411,247        $                   (356,424)
Eliminate items excluded from FFO:
Unrealized (gain) loss on marketable equity securities                                                              (214,736)                          190,405
Depreciation and amortization                                                                                        405,615                           515,937
FFO attributable to common stockholders                                                                              602,126                           349,918
Adjustments:
Compensation expense related to stock-based awards                                                                   31,706                             29,162
Business development, capital raising, store acquisition, and third-party management marketing expenses                  —                               9,240
AFFO attributable to common stockholders                                                                  $         633,832        $                   388,320

Earnings per share attributable to common stockholders - basic                                            $             0.04       $                      (0.04)
Earnings per share attributable to common stockholders - diluted                                          $             0.04       $                      (0.04)
FFO per share - diluted                                                                                   $             0.06       $                       0.04
AFFO per share - diluted                                                                                  $             0.07       $                       0.04

Weighted average shares outstanding - basic                                                                       9,292,488                           9,262,811
Weighted average shares outstanding - diluted                                                                     9,309,287                           9,262,811

For further details, please refer to the Company’s 10-Q for the quarter ended March 31, 2021.                                                                 41
Reconciliation of GAAP Net Income to                                                                                                                 ®

   Same-Store Net Operating Income                                                                                                        NASDAQ: SELF

                                                                                                       For the Three Months Ended March 31,
                                                                                                    2021                                 2020
Net income (loss)                                                                               $           411,247        $                     (356,424)
Adjustments:
Management fees and other income                                                                            (18,197)                              (17,344)
General and administrative                                                                                  578,617                               682,623
Depreciation and amortization                                                                               405,615                               515,937
Business development                                                                                             —                                  9,240
Dividend, interest, and other income                                                                        (18,070)                              (24,100)
Unrealized (gain) loss on marketable equity securities                                                     (214,736)                              190,405
Interest expense                                                                                            285,492                               305,782
Non same-store revenues                                                                                    (494,603)                             (378,547)
Non same-store cost of operations                                                                           191,387                               170,074
Total same-store net operating income                                                           $         1,126,752        $                    1,097,646

                                                                                                       For the Three Months Ended March 31,
                                                                                                    2021                                 2020
Same-store revenues                                                                             $         1,929,388        $                    1,843,653
Same-store cost of operations                                                                               802,636                               746,007
Total same-store net operating income                                                           $         1,126,752        $                    1,097,646

For further details, please refer to the Company’s 10-Q for the quarter ended March 31, 2021.                                                           42
You can also read