HISTORY OF CHANGES TO GREATER SYDNEY'S WATER SUPPLY SYSTEM YIELD - September 2021
←
→
Page content transcription
If your browser does not render page correctly, please read the page content below
1

HISTORY OF CHANGES
TO GREATER SYDNEY’S
WATER SUPPLY SYSTEM
YIELD

September 2021
2

The Greater Sydney’s water supply system yield was re-calculated following the conclusion
of the recent drought (2017-2019), extending the historical hydrological records to December
2020. The last independent expert review recommended the use of varying climatic demand
factors instead of fixed seasonal demand factors to disaggregate annual demand to monthly
demands and to use harvesting node to overcome monthly – daily problem.

Water NSW has now completed an independent expert review of the model incorporating all
previous recommendations. The current yield in Run 36 estimated as 520 GL/a.

Re-calculated Greater Sydney’s water supply system yield is 520 GL/a

WaterNSW supplies raw water for treatment and distribution by its Greater Sydney
customers. The Sydney Desalination Plant (SDP) supplies treated water directly into the
potable water supply distribution system. The water supply system servicing Greater Sydney
is configured and operated to optimise yield, taking into account all sources of water.

BACKGROUND

What is yield?

The yield of the water supply system is the maximum amount of water that can be supplied
annually on a sustainable basis, taking into account the constraints of the water supply
system design criteria, and considering not just surface water but all sources of available
water including desalinated water and drought triggered supply sources.

Yield is the average annual demand for water that can be met sustainably over the
long term.

Yield is not static. It changes over time as inflows, infrastructure, demographics, the system
design criteria and the operating rules for the system change.
3

Figure 1: Greater Sydney water supply system
4
The surface water supply system
The WaterNSW water supply system for Greater Sydney is an integrated network of dams,
pipelines, canals, tunnels and rivers that has been designed, and is operated, to optimise
overall water supply outcomes. It includes:
the Warragamba system: comprising Warragamba Dam and the pipelines that
connect the dam to the Prospect Water Filtration Plant and Prospect Reservoir
the Shoalhaven system: comprising Tallowa Dam, Fitzroy Falls and Wingecarribee
reservoirs, pipelines, canals and pumping stations which supplies local communities
and Sydney via transfers either to the Warragamba system or the Upper Nepean
system
the Upper Nepean system: comprising Cataract, Cordeaux, Avon and Nepean dams,
two diversion weirs and the Upper Canal that delivers water into Prospect Water
Filtration Plant and/or Prospect Reservoir; this system supplies water to Sydney, the
Illawarra, Macarthur and surrounding villages of Picton, Bargo and Thirlmere
the Prospect system: comprising Prospect Reservoir and the Prospect Raw Water
Pumping Station that delivers water into the Prospect Water Filtration Plant
the Woronora system: comprising Woronora Dam, and supplies Sutherland and
adjacent villages
the Blue Mountains system: comprising the Cascades (x3), Greaves Creek and
Medlow dams that supply the upper Blue Mountains. Water can also be transferred
to the upper Blue Mountains from the Fish River Water Supply Scheme, which
originates at Duckmaloi Weir.
All of the systems in the network contribute to WaterNSW’s capacity to supply water, and
any changes to the system infrastructure, or the operating rules that apply in any part of the
system, affect the overall system yield.
Sydney Desalination Plant
When operating at full capacity, Sydney’s desalination plant at Kurnell can produce 91
giga-litres of water a year, enough to supply up to 17 percent of greater Sydney’s current
(2017) potable water needs.
Water from the desalination plant can be distributed to approximately 1.5 million people
across the Sydney CBD, inner west, eastern suburbs, southern Sydney and parts of the
Sutherland shire, and at times as far west as Auburn.
The desalination plant was commissioned in January 2010. The plant will be brought into
operation at full production capacity (250 ML/d) 8 months from the total dam storage level is
below 60 percent capacity and, once operational, will continue to do so until the total dam
storage level reaches 70 percent (2017 MWP).
Contingency Drought Measures
The 2006 Metropolitan Water Plan (MWP) identified that if Sydney entered severe drought,
several bore-fields could be built to tap into underground water sources (groundwater).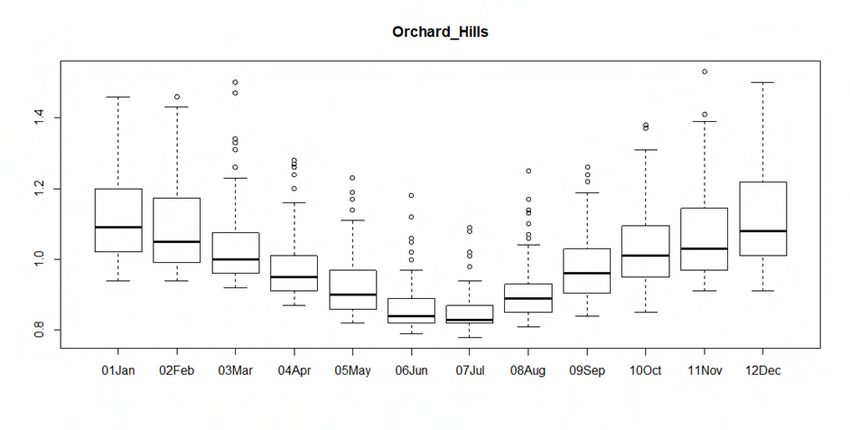
5
Groundwater investigations were undertaken at Kangaloon and Wallacia/Leonay, but the
plan to use groundwater was shelved in 2008 as the dams recovered at the end of the
drought. The 2010 MWP reaffirmed that a decision to extract groundwater would be made in
the event that Sydney’s total dam storage falls to a level consistent with severe drought and
with regard to seasonal weather outlooks and demand at the time.
2017 MWP does not include use of groundwater as a drought measure. However, it has
identified a number of possible drought measures including temporary desalination plants.
Water supply system design criteria
The system design criteria used to determine the yield define the minimum ‘standards of
service’, and are built into the model that estimates the likelihood of running out of water, or
facing water restrictions.
The design criteria for Greater Sydney reflect the length and frequency of water restrictions
that is regarded as ‘acceptable’, as well as ensuring that water supplies are not depleted.
They are:
Security - storages should not approach emptiness (defined as 5% of water in the
storage) more often than 0.001% of the time, or one chance in 100,000 in any one
month.
Robustness – imposed water restrictions should not occur more often than once in
every ten years on average. That is, restrictions should not be too frequent.
Reliability – imposed water restrictions should not last longer than 3% of the time on
average, or 3 months in 100 months.
The maximum volume of water that can be extracted from the water supply system when all
three system design criteria are satisfied is the system yield - the average annual demand
for water that can be sustainably met over the long term.
Estimates of yield are based on assumptions about the likelihood of severe droughts
occurring, as well as the historic experience with the water supply system and its hydrology.
Yield is a long-term construct, however, and periods of low inflows (droughts) may see the
design criteria temporarily exceeded.
While relaxing the design criteria increases the system’s yield, it also increases the
frequency or duration of water restrictions and/or increases the risk of water storages
emptying. Whenever water restrictions are introduced, they too influence the system yield.
For this reason, modelling work incorporates assumptions regarding the expected reductions
in demand for water that can be achieved from the imposition of water restrictions.
The regulatory context
The 2017-2022 Operating Licence requires WaterNSW to report changes to the water
supply system yield, the assumptions and inputs used to calculate yield, and the reasons for
any changes to the yield or those assumptions and inputs.
Additionally, the Operating Licence requires WaterNSW to re-calculate and report any
changes to its estimate of the yield when any of the following occur: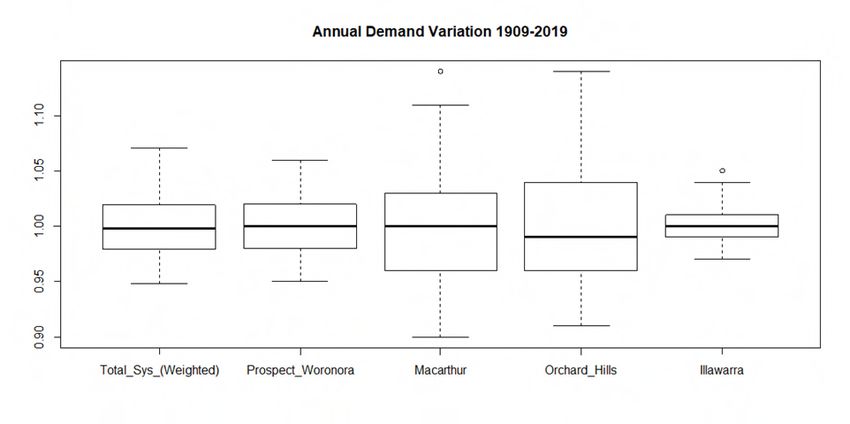
6
the conclusion of any drought event;
the commencement of any major modification or augmentation to the water supply
infrastructure that would have a significant impact on the supply of water; and
any material change to the operating rules of the water supply infrastructure,
including any changes to the availability of desalinated water.
WATER SUPPLY PLANNING TOOLS
Use of Modelling in water supply planning
WaterNSW uses the Water Headworks Network (WATHNET5) software package to simulate
the operation of the water supply system.
WATHNET5 draws on 111 years of inflow data (1909-2019), and then replicates these flows
by stochastic modelling to provide 10,000 synthetic inflow sequences each containing 111
years of inflows in order to estimate the system yield meeting the design criteria. The
modelling incorporates all water sources: surface water data, and desalinated water. All
water recycling initiatives are treated by the model as ‘negative demands’ on the water
supply system; in other words, these volumes are subtracted from the estimated water use
(or demand).
This modelling allows WaterNSW to plan the optimal use of the water supply system based
on a wider range of scenarios than the historical data alone. For example, it allows
WaterNSW to plan how to manage the water supply system during droughts that are more
severe than any on historical record (the worst drought occurred in the period 1934-1942).
WaterNSW is also using this modelling capacity to participate in research that aims to
assess the potential impacts of climate change on hydrology and system yield.
WATHNET5 also incorporates economic modelling capabilities. The software can optimise
system parameters for a range of outcomes. WaterNSW developed MetroNet, a ‘lumped’
model based on WATHNET5, to improve computational efficiency for the screening and
optimisation of alternative supply options and operating rules, identified as part of the
metropolitan water planning process. The differences in the output between the MetroNet
model and the detailed system model were compared and found to be minimal.
Yield calculation
The calculation of yield is based on the design criteria and the characteristics of the water
supply system, and is based on 1,110,000 years (10,000 replicates x 111 years) of
synthetically generated inflows.
Analysing yield
Yield analysis can be used as a planning tool to help investigate a range of options for
providing future water needs. For example, yield analysis can be used to assess the
potential impacts of climate change or to investigate a range of possible management
changes, including for example:
implications of different desalination plant operating rules and staging;
impacts of introducing environmental flows;
7 short to medium term drought response measures; system optimisation (operating rules); asset reliability impacts; characterisation of floods and droughts; determination of dam depletion rates. WaterNSW reports to IPART any gap between system yield and the demand projected by Sydney Water, so that this can inform planning decisions being taken as part of the NSW Metropolitan Water Planning process, and enable actions to redress any imbalance between system yield and demand. System demand should not exceed system yield for too long, because eventually the system will run out of water or have water restrictions in place too often or for too long. The water supply network model provides the capability to investigate the performance of the system and to determine the best way to meet current and future needs, both in the long and short term. Review of the water supply system modelling capability Through the use of the WATHNET5 model, and in conjunction with industry experts, WaterNSW has developed a capability that enables assessment of water supply system performance (hydrologic and economic) under current and any future system configurations, in both the short and long term. Its value is dependent on the WATHNET5 model itself and the underlying data used, both needing to be robust. For this reason, the Operating Licence requires a detailed independent review of the model during the term of each Licence. Historically, this review has suggested the need for additional research and development which has resulted in continuous improvements to the model’s capability. The model was independently reviewed by IPART in June 2003, and found to be an accurate representation of the supply system. The design criteria were also reviewed by IPART in July 2003. Fine tuning of the model was undertaken as an outcome of the review. In 2010, the model was again comprehensively externally reviewed. The review tested the robustness of the model and confirmed the correctness of the model configuration and input data. The last independent review was carried out in 2016. The assumptions of the model were subject to expert panel peer review. An internal review of the capability of the model is also undertaken between independent expert reviews. This internal review identifies any corrections/modifications, and also allows for other incremental improvements to the model. Improving modelling capabilities The 2010 review suggested the incorporation of economic modelling capabilities into the modelling software in order to reduce reworking data through separate economic models. The economic modelling functionality was successfully applied to the optimisation of the Blue Mountains water supply system. Examples of other modifications made to WATHNET5 in the past include:
8
Improved representation of environmental, riparian and Warragamba Hydro Electric
Power Station (HEPS) flow releases
Replacement of the Shoalhaven and Woronora catchments inflows using
hydrological (rainfall-runoff) modelling techniques
A number of modifications to the water restriction regime and the predicted demand
reductions
Inclusion of deep water access at Warragamba and Nepean dams
Adjustment of water restrictions trigger levels for revised total storage volume (due to
deep water access)
Revised operating rules for Tallowa Dam
Inclusion of the desalination plant and its operating rules
Emergency drought measures
Inclusion of updated reservoir capacity tables post bathymetric surveys.
Warragamba Dam environmental flow replacement facility at St Marys
Emerging trends in demand in different parts of Sydney and the Illawarra
Synthetic generation improvements to account for the limited period of hydrology
Revised assumptions about the likely savings from future water restrictions (as a
consequence of the introduction of Water Wise rules)
Incorporation of releases from Warragamba Dam required under Greater
Metropolitan Water Sharing Plan (GMWSP) for the dilution of Wallacia Sewage
Treatment plant effluent (5 ML/d) and for Sydney Water extractions at North
Richmond (17 ML/d and 25 ML/d).
Adjustment for Shoalhaven pumping to account for the impact of using monthly time
step in the yield model (as recommended by 2016 independent review).
Improved representation of the behaviour of individual reservoirs
2017 MWP operating rules.
More recent changes have included:
Revised (post dam) inflows from 2008 using Pan to lake evaporation factors
recommended in 2010 yield review.
Hydrology extension to Dec. 2019
Increase in number of synthetic replicates used from 2000 to 10000.
Varying seasonal demand factors (as recommended in previous independent expert
reviews)
Inclusion of harvest node methodology to account for daily operation in a monthly
model for environmental flow and Shoalhaven transfers. Yield estimates with this
method showed negligible difference to previous method using the equations.
Therefore, it is recommended not to use the harvest node method.
Improvement to the representation of Wingecarribee Reservoir (operating window for
Shoalhaven transfers, inclusion of deep storage, and the revised bathymetry
information).
Warragamba Storage is kept below 0.3m from FSL to prevent potential wave action
from affecting the drum gate ‘hunting’. This represents 21745 ML, being not available
for supply. Therefore, effective operating storage is taken as 2069162-21745 =
2047417 ML
Tallowa and Fitzroy Falls Lake Area Updated9
Using harvesting node
UNCERTAINTIES THAT AFFECT YIELD
Any action that delays the imposition of water restrictions, or enables the lifting of water
restrictions, will have a POSITIVE effect on Reliability Yield (e.g. earlier pumping from the
Shoalhaven System).
Any action which increases the rate of depletion of the dams, and brings on water
restrictions sooner, will have a NEGATIVE effect on Reliability Yield (e.g. increased E-flows).
Any action which slows the rate of depletion of the dams in the latter stages of a drought will
have a POSITIVE effect on Security Yield (e.g. supply from Stage 2 of the Sydney
Desalination Plant).
Any action which accelerates the rate of depletion of the dams in the latter stages of a
drought will have a NEGATIVE effect on Security Yield (e.g. less effective water restrictions).
Major uncertainties that affect the yield estimate include:
The assumption that the past hydrology will be representative of the future (Climate
Change).
Relatively short hydrological record.
Future decisions that could affect yield include:
Release of environmental flows from Warragamba Dam
Changes to the Desalination Plant operating regime, and the timing of any
augmentation
Changes in restriction regimes
Flood Mitigation proposals which see an alteration to the FSL of Warragamba Dam
The table below summarises the changes to Yield (Reliability and Security) over the past
twenty (20) years due to various initiatives.
Changes to Yield Since 2000
Situation in year 2000: Yield = 600 GL/a (limited by Reliability)
Situation in year 2021: Yield = 520 GL/a (limited by Security)
The incremental changes to the system yield are shown below in Table 1, and expressed as
a series of computer model “runs”. The resulting yield at any point in the table represents the
estimated yield taking into account the cumulative effect of all the factors considered in that
and previous model runs (see Table 2). Descriptions of each run are provided in Table 2.10
Table 1: Summary of the latest yield estimates
Simulation Change Description Yield Limiting Reliability Security
criterion Yield Yield
(GL/a)
(GL/a) (GL/a)
Run 34 - extension of hydrology from
(June 2020 Jan 2017 to Dec 2019; and 535 Security 570 535
yield update) - minor model improvements.
Run 34 with varying climatic
Run 35 515 Security 555 515
demand factors
Run 36 Run 35 with harvesting node 520 Security 560 520
Current Sydney water supply system yield
The supply system yield is now 520 GL/a, and which is limited by security criterion as
illustrated in Run 36 of Table 1 above.11
Table 2 - Summary of model runs since 2000
Simulation Description Yield Limiting Reliability Security
(GL/a) criterion Yield Yield
Run 1 System Model-2000 600 Reliability 600 650
Run 2 Improved representation of environmental, riparian and HEPS
590 Reliability 590 660
releases
Run 3 Extension of hydrology for 1999-2004 565 Reliability 565 645
Run 3A Extension for Shoalhaven by catchment HSPF model 565 Reliability 565 600
Run 4 Modification of water restriction regime 500 Security 570 500
Run 5 Implementation of deep water access at Warragamba and
540 Security 565 540
Nepean dams
Run 6 Trigger levels for restrictions revised to total storage levels 532 Security 593 532
Run 7 Minimum operating level for Tallowa Dam raised from –5.2m to –
528 Security 585 528
3m below FSL
Run 8 500ML/d Desalination Plant to commence production at 15%
585 Reliability 585 594
storage (until 30%)
Run 9 2 borefields yielding 30GL/a of groundwater for 3 years
585 Reliability 585 600
commencing at 35% storage
Run 10 Modification of restriction regime 565 Security 585 565
Run 11 3 borefields yielding 45GL/a of groundwater for 3 years
570 Security 585 570
commencing at 35% storage
Run 12 Extension of hydrology for 2005-2008 550 Reliability 550 580
Run 13 Refinements of modelling dam depletion, and geographical
545 Reliability 545 565
distribution of demand
Run 14 Commencement of environmental flow regime (80/20) from
Tallowa Dam 525 Both 525 525
Run 15 New trigger for transfers from Shoalhaven to Sydney (pump mark
75% of total system storage to commence pumping and 80% to 535 Security 555 535
stop pumping)
Run 16 Model & hydrology updates, & extension of hydrology to 2009.
Revised drawdown rules & inclusion of Prospect Reservoir, 520 Security 545 520
corrected evaporation, demand distribution.12
Run 17 Minimum operating level for Tallowa Dam raised from -3m to -1m
515 Security 535 515
below FSL (decrease of 14GL in available storage)
Run 18 Operating rules for desalination plant modified from 500ML/d
when storage falls to 15%, and off at 30% to 250ML/day from
when storage falls to 70% until storage reaches 80% (stage 1) or 585 Security 595 585
to 250ML/day from when storage falls to 20% until storage
reaches 80% (stage 2)
Run 19 Environmental flow regime for metropolitan dams 80:20; release
560 Security 565 560
same as inflow when inflows are lower.
Run 20 Modification of water restrictions regime. 555 Security 610 555
Run 21 Emergency drought measure 1 (Tallowa minimum operating level
560 Security 605 560
changed from -1m to -3m at 35% storage)
Run 22 Emergency drought measure 2 (halve environmental flow
580 Security 605 580
releases from dams when storage reaches 25%)
Run 23 Emergency drought measure 3 (voluntary water usage reduction
605 Reliability 605 630
to 22% at 25% storage)
Run 24 Warragamba environmental flow replacement (environmental and
riparian flows replaced by Western Sydney recycling plant. 5ML/d
620 Reliability 620 645
released from Warragamba Dam to dilute Wallacia STP effluent
releases)
Run 25 Releases for North Richmond Water Filtration Plant 610 Reliability 610 640
Run 26 Inclusion of hydrology 2010-2012 620 Reliability 620 660
Run 27 Inclusion of the 8 month delay in commencement of production of
600 Reliability 600 660
desalinated water from notification to operation.
Run 28 New restriction savings based on Sydney Water demand forecast
595 Reliability 595 620
in March 2015
Run 29 Revised Bathymetry for Warragamba storage 605 Reliability 605 630
Run 30 Release of HEPS storage allocation above FSL -1.0 615 Reliability 615 630
Run 31 Metro Water Plan 2017 (SDP Stage 1 supply trigger, SDP Stage
2 Plan/Construct Triggers, Removal of groundwater, inclusion of 575 Security 590 575
temporary desalination)
Run 32 Inclusion of hydrology 2013-2016 and model refinements. 570 Security 600 570
Run 33 Extension of hydrology from Jan 2017 to Dec 2019; and
535 Security 570 535
10,000 replicates.13 Run 34 Minor model improvements. 535 Security 570 535 Run 35 Varying climatic demand factors 515 Security 555 515 Run 36 Harvesting node 520 Security 560 520 Explanation of each modelling run: Run 1 Purpose Undertaken to confirm the previous yield estimate. In 2000 the system yield was estimated at about 600 GL/a, based on the hydrology of the period 1909 to 1998. Operating Rule When the total operating volume of the storages falls below 60%, water is transferred from the Shoalhaven system. At 55% of total system storage, water restrictions are introduced to progressively reduce demand for water through 5 levels of restrictions (Level 5 restriction achieving 50% demand reduction). Results The system yield was confirmed, and the limiting criterion was the reliability criterion. Run 2 Purpose Undertaken to resolve model misrepresentations, and to incorporate improved representation of environmental, riparian and Hydro-electric Power Station (HEPS) releases. Modification
14

The WATHNET model gave priority to water supply allocation over environmental flow releases during extreme droughts. This resulted in
modelled environmental releases not meeting regulatory requirements specified in the Water Management Licence. Accurate representation of
HEPS releases made the water supply system less vulnerable to emptying, hence the modest increase in security yield.

Results

The system yield was reduced by 10 GL/a, limited by the reliability criterion.

Run 3

Purpose

Undertaken to include hydrology for 1999-2004. Accuracy of estimates of dam inflows, losses and transfers has a significant impact on yield
estimates.

Modification

Extension of the hydrological data by including the inflows from 1999 to 2004 resulted in a drop of about 6% on average annual flows.

Results

System yield was reduced by 25 GL/a, attributable to the current drought; again the yield was limited by reliability.

Run 3A

Purpose

Undertaken to incorporate stream flow records for Shoalhaven River system for a limited period of 1978-2004. A monthly regression model was
previously used to extend the data for the period of 1909 to 1977.

Modification

A daily Hydrological Simulation Program-Fortran (HSPF) catchment model was developed for the Shoalhaven catchment to enable a more
accurate estimation of inflows. This catchment model predicted annual average flows 20% less than the previous estimates. This result
reasonably reflects the reduced rainfall during the first half of the 20th century.
15

Results

Revised Shoalhaven flows have a significant impact on the security of yield, due to its reduced contribution during droughts. System yield for
security was reduced by 45 GL/a as a result of this revision. System yield remains limited by reliability criterion.

Run 4

Purpose

Undertaken to incorporate a modified water restriction regime which reduced five levels of restrictions to three. Water savings through
mandatory water restrictions slow the rate of storage depletion during droughts and serve as an important guard against the dams emptying.
When restrictions are less severe, system yield is reduced (and limited by security as shown by the results of this run).

Modification

Level 1 – at least 7% demand reduction, not more than 3% of the time
Level 2 – at least 12% demand reduction, not more than 1% of the time
Level 3 – at least 20% demand reduction, not more than 0.5% of the time
Level 4 – at least 30% demand reduction, not more than 0.3% of the time
Level 5 – at least 50% demand reduction, not more than 0.05% of the time

The above were modified to:

Level 1 introduced at 55% Total Storage: achieves a 7% reduction
Level 2 introduced at 45% Total Storage: achieves a 17% reduction
Level 3 introduced at 40% Total Storage: achieves a 19% reduction

Results

The adoption of the revised restrictions regime resulted in a 65 GL/a loss of security yield and 5 GL/a increase in reliability yield.

Run 5
16

Purpose

Incorporation of deep water storages as a result of projects at Warragamba and Nepean dams. For this run, triggers for pumping and
restrictions are adjusted to the equivalent levels after deep storage is appended.

Modification

An extra 200 GL added to total storage volumes.

Pump mark and demand restriction levels revised for same depletion storage volumes. Deep storage is appended below to the current
minimum operating level.

Based on percentages of new total storage volumes:
      Pump mark 63%
      Water restrictions:
      Level 1 introduced at 59% Total Storage: achieves a 7% reduction
      Level 2 introduced at 51% Total Storage: achieves a 17% reduction
      Level 3 introduced at 45% Total Storage: achieves a 19% reduction

A minimum of 100 ML/d maintained in Upper Canal when deep water accessed.

Results

The 40 GL/a increase in yield is due to the availability of additional water during long droughts. There was a slight reduction in Reliability Yield
due to the earlier onset of restrictions (this is corrected in Run 6).

Run 6

Purpose

Following commissioning of deep storage access at Warragamba and Nepean dams, the water restrictions regime was recalculated on the
basis of new total storage volume. Triggers for restrictions remain at 55%, 45% and 40%, however application of these percentages to the
larger storage capacity means that restrictions commence later in a drought.

Modification
17 Pump mark and demand restriction levels revised based on percentages of new total storage volumes: Pump mark 60% Level 1 introduced at 55% Total Storage: achieves a 7% reduction Level 2 introduced at 45% Total Storage: achieves a 17% reduction Level 3 introduced at 40% Total Storage: achieves a 19% reduction Results This run increased the reliability yield by 28 GL/a, but reduced security yield by 8 GL/a, because there was less opportunity to reduce demand for water through restrictions. System yield decreased by 8 GL/a. Run 7 Purpose The initial operating rules for the Shoalhaven Scheme allowed the transfer water from Tallowa Dam to supply Sydney whenever the level in the dam was higher than 5.2m below full storage level. In order to protect the Shoalhaven and Kangaroo rivers and to maintain levels in Tallowa Dam, operating limits for transfers were restricted to the top 3m from FSL. Modification The minimum operating level (MOL) for Tallowa Dam was raised from -5.2m below FSL to -3m below FSL. Results Reducing the amount of water that can be accessed from Tallowa Dam reduces the reliability yield by 8 GL/a and the security yield by 4 GL/a. System yield is reduced by 4 GL/a. Run 8 Purpose Initial planning to allow for the desalination plant for Sydney if the drought continued. The plant would produce 500 ML/d commencing when storage levels in the dams fell to 15% total operating capacity, and continue production until storages recovered to 30%.
18

Modification

500 ML/d desalination plant constructed
Desalination commences production at 15% of total storage
Desalination ceases production at 30% of total storage

Results

Availability of this additional supply source improved security yield by 66 GL/a as this supply is available during extreme drought and is not
impacted by inflows. Reliability yield does not change as desalination does not commence until after all 3 levels of restrictions have been
implemented. The significant increase in security yield means that the system yield, which has increased by 57 GL/a, is now limited by the
reliability criterion.

Run 9

Purpose

Undertaken to incorporate access to groundwater resources.

Modification

Availability of groundwater at two bore-fields would enable an additional 30 GL/a to be accessed for a period of three years during drought,
after which it is estimated that this groundwater source would naturally recharge within 7 years.

Results

As this supply source is not implemented until storages deplete to 35%, groundwater does not improve reliability, but increases security by an
additional 6 GL/a.

Run 10

Purpose

Undertaken to incorporate revised demand modelling by Sydney Water. Experience during the drought suggested that estimates of demand
reductions that could be achieved through restrictions should be lower.
19

Modification

Restrictions:
Level 1 introduced at 55% Total Storage: achieves a 7% reduction
Level 2 introduced at 45% Total Storage: achieves a 11% reduction
Level 3 introduced at 40% Total Storage: achieves a 12% reduction

Results

Reducing the estimated demand reduction does not affect the duration of restrictions, so reliability yield is not affected. Security yield is reduced
by 35 GL/a as storages will approach emptiness more quickly if demand is not reduced significantly by water restrictions. System yield reduces
by 20 GL/a, and security is now the limiting criterion.

Run 11

Purpose

Incorporating estimates of the flow that could be achieved from additional groundwater resources.

Modification

Availability of a third bore-field means that a total of 45 GL/a is available for 3 years during drought. Groundwater production will commence
when storages deplete to 35% and continue for 3 years followed by a 7 year recharge period.

Results

The availability of this additional supply during severe drought improves system yield, and security yield, by 5 GL/a but does not affect reliability
yield.

Run 12

Purpose

Undertaken to incorporate hydrological data for 2005 to 2008, resulting in a drop of about 3% on average annual flows.
20

Modification

Stream flow data extended from 2005-2008 using monthly flow estimates based on mass balance. HSPF model used to estimate flows to
Woronora for period 1909-2004.

The inflows for the period 2005 to 2008 included flow volumes that were less than the average inflow but were still high enough to increase or
at least maintain the current level of storage. As a result, the generated inflows shifted more towards droughts of longer duration but of less
severity. This resulted in a reduction in reliability due to an increase in the time the system is in drought but as the droughts were not quite as
severe, the risk of running out of water was lessened thus the corresponding increase in system security. These changes show that the length
of hydrology data set is inadequate to fully capture extreme drought conditions.

Results

System yield was reduced by 20 GL/a, and again limited by reliability. It was very interesting to note that the criteria determining the yield
changed from security to reliability as a result of the incorporation of this data. Security increased by 10 GL/a, whereas Reliability decreased by
35 GL/a.

Run 13

Purpose

Undertaken to update WATHNET model drawdown rules - minor refinements of modelling dam depletion and geographical distribution of
demand.

The operating rules are converted to drawdown charts and used by operational planning team on a day to day basis to select the supply
storage. The drawdown chart is modified to include the new Nepean deep water pumping station. The nodal distribution of demand has also
changed, increasing demand at critical sources and resulted in overall reduction of yield.

Modification

                New Distribution of Demand Zone                       Old        New
 Warragamba Township                                               0.3%        0.2%
 Orchard Hills and Blue Mountains                                  4.0%        5.2%
 Prospect                                                          77.3%       79.5%
21
Helensburgh + Woronora 2.3% 0.8%
Macarthur 6.0% 6.7%
Picton and Bargo 0.6% 0.6%
Wingecarribee and Goulburn 0.7% 0.9%
Illawara 8.8% 6.1%
Total: 100.0%
Results
Refinements in modelling resulted in a decrease in system yield by 5 GL/a, and a reduction in security yield by 15 GL/a.
Run 14
Purpose
Undertaken to incorporate a modified environmental flow regime for Tallowa Dam. The regime was modified to mimic the inflow pattern: 20% of
inflows released when inflows exceed the 80th percentile flow; release same as inflow when inflows are lower.
Modification
Tallowa environmental release changed from 2,736 ML/month (90 ML/day) or total inflow if inflow is less than 2,736 ML/month (90 ML/day) to
7,436 ML/month on average or total inflow if inflow is less than 7,436 ML/month on average + 20% of the difference between inflow and
7,436 ML/Month.
Results
The increase in environmental flows from Tallowa decreases system yield. The yield drops approximately 20 GL/a as a result of the
introduction of an 80%ile transparent, 20%ile translucent flow release. The environmental releases for Tallowa Dam have a greater impact on
system security than system reliability when the transfer pump mark is at 60%. At higher transfer pump marks the Shoalhaven System
contributes mostly to reliability, as shown in Run 15.
Run 15
Purpose22 Undertaken to incorporate a new trigger for commencing transfers from Shoalhaven to Sydney. Modification Revision of trigger for commencement of pumping from the Shoalhaven (new pump mark is 75% of total system storage to commence pumping and 80% of total system storage to stop pumping). Results When the pump mark is increased from 60% of total system storage to 75% of total system storage, it provides increased opportunity to transfer water from the Shoalhaven system to the Sydney system, helping to maintain the total storage. This reduces the frequency of the storage dropping below restriction triggers, resulting in a significant increase in reliability yield (30 GL/a) and some increase in both system yield and security yield (10 GL/a). Run 16 Purpose Incorporates improvements identified in 2009/2010 water supply system yield review. Modification Updates including: - WATHNET model update and refinements including: revised drawdown rules; and Inclusion of Prospect Reservoir and inflow & evaporation losses from the reservoir); - corrected evaporation; - demand distribution based on Sydney Water Demand Projection of 20 May 2009, however the changes are minimal; - inflow hydrology extended to 2009; - Improvement to synthetic generation methodology. Results
23

Some modifications had a positive impact on the yield, some had a negative impact, while others had no impact. For example, the evaporation
correction had positive impact, incorporation of more uncertainty in synthetic generation had negative impact, whereas the introduction of
Prospect Reservoir no impact on yield. Overall it resulted in a reduction in system yield of 15 GL/a.

Run 17

Purpose

Undertaken to incorporate new operating rules for transfers from Tallowa Dam.

Modification

Minimum operating level for Tallowa Dam moved from –3m to –1m. This results in a decrease of 14 GL in available storage for transfers to the
Sydney system due to the changes from 22 GL at MOL -3m to 8 GL at MOL -1m.

Results

Reducing the volume of the pumping pool from Tallowa Dam from –3m to -1m results in a decrease in contribution from the Shoalhaven
transfer scheme. The result is a decrease in the volume of water available for transfers, which has the effect of reducing the yield by 5 GL/a.

Run 18

Purpose

Revision of desalination plant operating rules.

Modification

Desalination plant operation modified from 500 ML/d on at 15%, off at 30% to Stage 1 – 250 ML/d at 70% storage until storage levels reach
80%. Stage 2 – 250 ML/d at 20% storage until storage levels reach 80%.

Results

Increasing the desalination triggers increases both reliability and security yields. System yield increases by 70 GL/a but is still security
constrained.
24

Run 19

Purpose

Introduction of modified environmental flow regime from Metropolitan dams to mimic the inflow pattern.

Modification

80/20 Environmental flow release rules implemented at Nepean, Avon, Cordeaux, Cataract and Woronora dams. Under the new regime: if
inflow is less than 80th percentile flow all inflow is released; if inflow is greater than 80th percentile flow then 80th percentile flow and 20% of the
flow above 80th percentile flow is released.

Results

The increase in environmental flows released from the metropolitan storages results in a reduction in system yield by 25 GL/a with security
yield still being the limiting criterion.

Run 20

Purpose

Undertaken to incorporate revised water restrictions regime.

Modification

Restrictions:

Level 1 at 50% storage achieves a 10% reduction.

Level 2 at 40% storage achieve an 11% reduction.

Results
25

Revised restriction regime increases reliability yield by 45 GL/a because the restrictions are introduced later in the drought. However, it reduces
security yield by 5 GL/a because it increases the risk of the dams emptying. The system yield is reduced by 5 GL/a.

Run 21

Purpose

Incorporation of Emergency drought measure 1.

Modification

Tallowa Dam minimum operating level (MOL) lowered to -3 m at 35% storage.

Results

Accessing increased storage from Tallowa Dam during droughts increases the security yield by 5 GL/a. The system yield is increased by
5 GL/a.

Run 22

Purpose

Incorporation of Emergency drought measure 2.

Modification

Halve environmental flow releases from dams when storage reaches 25%.

Results

Halving environmental flow releases from all dams during severe droughts has a significant positive impact on security yield (+20 GL/a), and
also on system yield. This is because it reduces the demand on the dams and therefore reduces the risk of dams emptying, providing more
time for inflows to the dams. However there is no change in reliability yield as this measure comes late in the drought. The system is still
security constrained.
26

Run 23

Purpose

Incorporation of Emergency drought measure 3.

Modification

Voluntary water usage reduction to 22% at 25% storage.

Results

Voluntary water usage reduction during a severe drought increases the security yield considerably by reducing the draw on the dams. However
there is no change in reliability yield as this measure comes late in the drought. It is obviously very critical that the additional 11% reduction in
demand (over and above Level 2 restrictions) is achieved, otherwise yield will remain somewhere between 580 and 600 GL/a. Assuming the
22% reduction in demand is achieved, the resulting system yield is increased by 25 GL/a, and the system becomes constrained by the
reliability criterion.

Run 24

Purpose

Warragamba environmental flow replacement.

Modification

Warragamba environmental and riparian flows replaced by Western Sydney recycling plant.

Maximum of 5 ML/d released from Warragamba Dam to dilute Wallacia STP effluent releases.

Results
27

Reducing the current environmental and riparian flows from Warragamba Dam from 43.3 ML/d to 5 ML/d results in 15 GL/a increase in both
security and reliability yields. The resulting system yield is increased by 15 GL/a, and remains limited by the reliability criterion.

Run 25

Purpose

Incorporate releases for North Richmond water filtration plant

Modification

Incorporate flow releases from Warragamba Dam to meet requirements of the Greater Metropolitan Water Sharing Plan under clause 35(1) and
35(2). The SCA is required to make the following daily releases from Warragamba Dam for supply to Nth Richmond WFP:
           - 17 ML/d during 1 April to 31 October; and
           - 25 ML/d during 1 November to 31 March.

Results

System yield is reduced by 10 GL/a, and remains constrained by reliability.

Run 26

Purpose

Inclusion of hydrology 2010-2012

Modification

The hydrological data of 1907-2009 was used previously in the model. This has been extended to include inflows for year 2010, 2011 and
2012. A new set of 2,000 synthetic hydrological sequences were generated and used in the model.

Results
28 System yield is increased by 10 GL/a, and is constrained by reliability. The inflow for year 2012 was 3,615 GL/a which is well above average inflow (2,629 GL/a). The supply system yield showed some recovery from the shock of millennium drought. The result also highlighted that 104 years’ hydrological records is insufficient to capture the extreme variability observed. Run 27 Purpose Include an allowance for the start-up period from deep shutdown for the commencement of Sydney Desalination Plant (Stage 1) at 250 ML/d. Modification The MWP 2010 current supply configuration includes the availability of 250 ML/d capacity of Stage 1 desalination at 70% of total storage and Stage 2 capacity of 250 ML/d at 20% of total storage. An 8 month time period for start-up from deep shut down as per the IPART price determination has been modelled from the starting trigger of 70% of total storage. Results As a result of the 8 month delay, the long term average desalination production is reduced from 15.7 GL/a to 10.0 GL/a. This reduces yield by 20 GL/a, with reliability again constraining system yield. Run 28 Purpose New water restriction savings based on SWC demand forecast in March 2015. Modification SWC updated its forecasted demand for 5, 15 and 50 year time frames. The demand forecast also included an assessment of impact of water restrictions. The reduced demand due to restrictions is considered as demand savings. The previous yield evaluation in 2012 used demand
29

savings of 10%, 11%, 22% respectively for restrictions of Level 1, Level 2 and Voluntary Targets. The restriction savings varied over time and
also in scenarios.
The next 10 year average and reference case scenario for yield impact analysis will be used as it is being used for developing the 2017 MWP.
The demand savings are modified as advised in the model to 3.7%, 7.8% and 13.7% for Level 1 and Level 2 and Voluntary Targets (Level 3)
respectively.

Results

The 40 GL/a reduction in security yield is due to the reduction of demand savings under Voluntary Targets (Level 3). However, reliability yield is
only reduced by 5 GL/a and remains the constraining factor.

Run 29

Purpose

Revised bathymetry for Warragamba and Woronora storages

Modification

Warragamba Dam storage volume increased by 37 GL and Woronora Dam storage volume reduced by 3 GL to reflect the results of the latest
bathymetry survey.

Results

System yield is increased by 10 GL/a, and remains constrained by reliability.

Run 30

Purpose

The Hydro Electric Power Station (HEPS) at Warragamba Dam was handed over from Eraring Energy. The storage above FSL -1.0m had been
allocated for power generation. Now it cannot be used, resulting in access to top metre (pending operational needs) for water supply purposes.

Modification
30
Release of HEPS storage allocation above FSL -1.0m for water supply.
Results
System yield is increased by 10 GL/a, and remains constrained by reliability.
Run 31
Purpose
In March 2017 NSW Government released the updated Metropolitan Water Plan 2017. The Plan outlines the new rules for the operation of
Sydney’s bulk supply system.
Modification
a) Sydney Desalination Plant:
i. Stage 1: Desalination Plant 250 M L/d (DS1)
ON - when Total Storage is less than 60% (Note: eight month transition to start during which time the plant does not supply).
OFF – when Total Storage exceeds 70% ( Note: will operate for at least a minimum of 12 months after starting irrespective of storage level).
ii. Stage 2: Desalination Plant 250 ML/d (DS2)
Details for the Stage 2 Desalination Plant are provided in the Table below:
Storage Trigger (%) Duration (months) Shelving Period (month)
Preliminary Planning 50 4 18
Detailed Planning 45 14 48
Construction 35 24 -
b) Removal of drought supply from groundwater and inclusion of drought supply from Temporary Desalination Plants (48 ML/d)
Trigger for construction when Total Storage is less than 25%.
12 month implementation time for supplying at 50% of capacity.31
24 months implementation time for supplying at 100% of capacity.
ON when Total Storage is less than 40%.
OFF when Total Storage is less than 85%.
Results
Security yield dropped by 55 GL/a and reliability yield dropped by 25 GL/a. System yield is decreased by 40 GL/a, and now constrained by
security.
Run 32
Purpose
Inclusion of hydrology 2013-2016 and model refinements.
Modification
1) Model refinements include:
- Prospect evaporation and inflow were removed since they have no impact
- Fitzroy Falls deep storage was made available for evaporation (this was required to avoid the model crashing)
- operating storage 10,000 ML
- full storage 20,000 ML (23,500 ML)
- Fitzroy Falls e-flow modelled
- FF inflow is 4.4 times Wilds Meadow Inflow
- FF E-flow is 5/3 of Wilds Meadow Inflow
- FF E-flow is 0.4 of FF inflow
- Avon deep storage was made available for evaporation (this was required to avoid the model crashing)
- operating storage 146,700 ML32
- full storage 214,000 ML
- Adjustment for Shoalhaven pumping to account for impact of monthly time-step (as recommended by 2016 independent yield review)
o Actual operation is daily; during an inflow event daily inflows can vary significantly (resulting in spill during some days in a month mainly due to
very small operating storage at Tallowa). When monthly time step is considered, due to averaging, some inflow events may not spill and make
more water available for pumping, resulting in more pumping in a monthly model compared to daily model.
o In the graph below monthly Shoalhaven pumping volumes using daily and monthly time steps:
It can be seen that above 30,000 ML/month the monthly model overestimate the volume pumped compared to daily model.
Recommended to limit the monthly transfer capacity to a maximum of 30,000 ML (based on daily capacity monthly capacity =
1500*30.4=45,600 ML)
Further the monthly transfer from daily model is about 10% less than the monthly transfer from the monthly model.
Recommended to apply a factor of 0.9 to in the monthly model for Shoalhaven pumping from Tallowa to Fitzroy Falls.
2) Historical inflow was extended from 2012 to 2016 and 2000 synthetic inflow replicates were generated using parameter uncertainty.
Results33
Security yield dropped by 5 GL/a, and reliability yield increased by 10 GL/a. System yield is decreased by 5 GL/a, and remains constrained by
security.
Run 33
Purpose
Inclusion of inflows from 2017 to 2019 (inclusion of the last drought);
Use 10,000 synthetic replicates instead of 2000.
Modification
1) Historical inflow extension from 2016 to 2019 (total number of years is now 111).
a. Graph below shows the simulated and observed ‘Total Storage’ from Jan 2018 to March 2020.34 b. Annual historical inflows from 1909 to 2019 are shown in the graph below.
35

           c. 2018 & 2019 experienced the lowest two-year inflow within the instrumental records – are they within statistics or an outlier?
              Tukey’s method is used to determine whether 2018-2019 two-year inflow is an outlier:
                   Tukey’s makes no distributional assumptions nor does it depend on a mean or standard deviation. Outliers in this study are
                   defined as values outside of [Q1-1.5*IQR, Q3+1.5*IQR], in which Q1 (the lower quartile) is the 25th percentile, and Q3 (the
                   upper quartile) is the 75th percentile of the data. The inter-quartile range (IQR) is defined as the interval between Q1 and
                   Q3. Using this method 2018-2019 2-year inflow is not found to be an outlier based on Tukey’s method.
                                                                      References: Tukey, JW. Exploratory data analysis. Addison-Wesely, 1977
   2) 2000 synthetic replicates have been used in the past for yield estimation. There have been a concern that when the yield is limited by
      security criterion the number of replicates with severe droughts was not enough (only a few replicates, out of 2000, determined the
      yield), increasing the uncertainty in the yield estimates. To avoid this, it has been decided to use 10,000 synthetic replicates in the
      future.

Results

Yield dropped by 35 GL/a (Security limited).

Run 34

Purpose

Minor model refinements including minor refinement of inflow estimates from 2008-2016.

Modification

       1) Improvement to the representation of Wingecarribee Reservoir (operating window for Shoalhaven transfers, inclusion of deep
          storage, and the revised bathymetry information).
36
2) Warragamba Storage is kept below 0.3m from FSL to prevent potential wave action from affecting the drum gate ‘hunting’. This
represents 21745 ML, being not available for supply. Therefore, effective operating storage is taken as 2069162-21745 = 2047417
ML
3) Tallowa and Fitzroy Falls Lake Area Updated
Tallowa Lake Area Updated
Vol (ML) Area – old (km2) Area – new (km2)
90,000 7.710 8.31
81,000 7.185 7.67
72,000 6.630 7.02
63,000 6.050 6.42
54,000 5.450 5.81
Fitzroy Falls Lake Area Updated
Vol (ML) Area (km2)
22920 4.8337
20017 4.69
18018 4.60
16023 4.44
14039 4.18
12,014 3.90
10,019 3.62
8,015 3.29
6,015 2.94
4,015 2.46
2,010 1.72
0 0
4) Spatial demand distribution factors based on Sydney Water’s Feb 2020 demand projection. 2020 to 2025 projections are used in the
revised distribution
The new Spatial demand distribution is based on Sydney Water’s Feb 2020 demand projection. 2020 to 2025 projections are
used in this distribution.
Demand Zone Old New
Warragamba Township 0.0016 0.0019
Orchard Hills and Lower Blue Mountains 0.0480 0.0484
Prospect North / Ryde 0.3000 0.3882
Sydney East 0.4770 0.3882
Sutherland 0.0314 0.0348
Helensburgh 0.0080 0.0080
Macarthur 0.0680 0.0603
Picton and Bargo 0.0080 0.0070
Wingecarribee (Bowral) and Goulburn 0.0100 0.0105
Illawara 0.0480 0.0527
Total: 1.000038
5) Fixed seasonal (monthly) demand factors to disaggregate annual demand into monthly demand based on Sydney Water’s Feb 2020
average demand projection.
2020 to 2025 projections are used in the revised seasonal (monthly) demand factors. Previously (before 2020), only one set
of demand factors were used for all demand centres. In this review four sets of demand factors, representing key supply
zones, are used as shown in the table and figure below.
Supply Zone
All Sydney including Prospect
Woronora (4)
Illawarra Illawarra
Macarthur Macarthur
Southern Highlands
Picton/Bargo
Orchard Hills Orchard Hills
Warragamba Town
6) Refinement of inflow estimates from 2008-2016
Some inconsistencies in the historical inflow estimates (CMCR) between 2008 and 2016 were identified, particularly the
treatment of Pan to Lake evaporation and rainfall on lake (pre-dam/post dam). These inconsistencies is significant during
very low flow periods (eg. 2017-2019 drought inflows).
The inconsistencies were in the evaporation data used to calculate lake evaporations. In 2010 independent yield review,
SKM reviewed lake evaporations and recommended Pan to Lake factors to use with Prospect Pan evaporation. These
factors with Prospect Pan evaporation have been used in the updated inflows.
Results
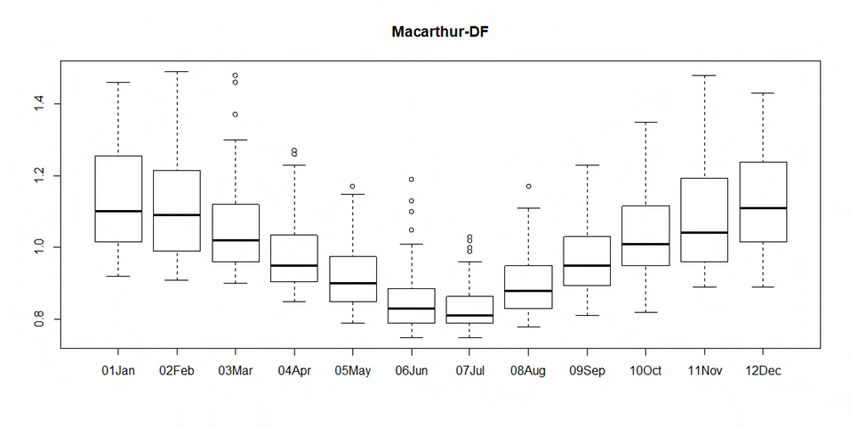
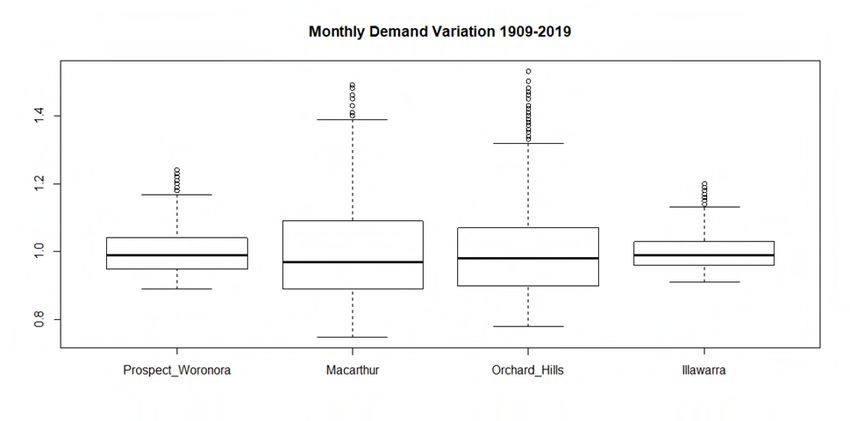
No change in yield.39 Run 35 Purpose Use seasonally varying monthly demand factors instead of fixed monthly demand factors (please refer to Run 34 (5) above). Water NSW has been using a constant annual demand in calculating the yield with fixed seasonal (monthly) demand factors to account for seasonal variations in consumption. In this method the annual demand is the same for hot dry years and cold wet years. It was identified in the independent expert review that this method can over-estimate the system yield. With the varying climatic demand factors, yield is estimated based on a constant average demand over the simulation period, but the demand can vary year to year based on climate. Modification In this update varying climatic demand factors developed by Hydrology and Risk Consulting (HARC) for the period from 1909 to 2019, are used. Plots below show statistics of the varying climatic demand factors. Demand factors are corelated to inflows and synthetically generated together with the inflows. Figure below shows the comparison for previous factor and range of new variable factors for supply nodes. Results were presented to SW and agreed. All recommendations in the last model review are implemented with the implementation of this update.
40

Results

Yield dropped by 20 GL/a (Security limited).

Run 36
41

The yield for Run 36 was 520 GL/year, an increase of 5 GL/year over Run 36. This becomes the new yield estimate for the system. This due to
including harvesting node (as recommended in 2016 Review).
You can also read