Levels and Distribution of Organophosphate Esters (OPEs) in Typical Megacity Wetland Park Landscape Water Bodies in Southwest China
←
→
Page content transcription
If your browser does not render page correctly, please read the page content below
Levels and Distribution of Organophosphate Esters (OPEs) in Typical Megacity Wetland Park Landscape Water Bodies in Southwest China Hongling Yin ( belling15@126.com ) Chengdu University of Information Technology https://orcid.org/0000-0002-1662-4673 Liya Liu Chengdu University of Information Technology Qin Liu Chengdu University of Information Technology Jiaojiao Song Chengdu University of Information Technology Shuhong Fang Chengdu University of Information Technology Xiaowen Liu Chengdu University of Information Technology Research Article Keywords: Human activities, organophosphate esters (OPEs), suspended particulate matter (SPM), tris-(2- chloroethyl)-phosphate (TCEP) and trichloropropyl phosphate (TCIPP) Posted Date: June 30th, 2021 DOI: https://doi.org/10.21203/rs.3.rs-649375/v1 License: This work is licensed under a Creative Commons Attribution 4.0 International License. Read Full License
1 Levels and distribution of organophosphate esters (OPEs) in typical megacity wetland park
2 landscape water bodies in Southwest China
3 Hongling Yin, Liya Liu, Qin Liu, Jiaojiao Song, Shuhong Fang, Xiaowen Liu
4 Abstract
5 Human activities have led to the release of organophosphate esters (OPEs) into the environment. This
6 study aims to investigate the levels and partitioning of OPEs in surface water, suspended particulate
7 matter (SPM) and sediments of landscape waters across eleven parks in the city of Chengdu, a
8 megacity in Southwest China. The average concentration of Σ6OPEs in the SPM samples (median:
9 2.94×10³ ng/L, 6.88×10⁴ ng/g dw) was 1-3 orders of magnitude higher than that in the surface water
10 (median: 359 ng/L) and sediment (median: 82.8 ng/g) samples. Tri-n-butyl phosphate (TnBP), tris-(2-
11 chloroethyl)-phosphate (TCEP) and trichloropropyl phosphate (TCIPP) were the primary OPE
12 pollutants in the surface water and SPM samples, while TnBP, tris-(2-butoxyethyl) phosphate (TBEP)
13 and tris-(2-ethylhexyl) phosphate (TEHP) predominated the sediment samples. The higher log Koc
14 values of OPEs in park landscape water bodies than other studies in the present study could be
15 explained by the OPE properties (foc, Kow, degradability) and the environmental conditions (the input
16 sources and the hydraulic retention time, etc.).
Hongling Yin
yhl@cuit.edu.cn
College of Resources and Environment, Chengdu University of Information Technology,
Cheng Du, China
117 Graphical abstract
Wetland park landscape water bodies
7000 wate r(ng/L)
sediment(ng/g)
Σ6 OPEs Concentrations
6000 SPM(ng/L)
5000 Water
4000
3000 OPEs OPEs
Kow
2000
Koc
1000
0 Sediment SPM
1# 2# 3# 4# 5# 6# 7# 8# 9# 10#11# OPEs
18
219 As substitutes for brominated flame retardants, organophosphate esters (OPEs) are important
20 organophosphorus flame retardants. In recent years, due to the large-scale production and use of OPEs
21 worldwide, the accompanying environmental issues have also become increasingly concerning. Some
22 OPEs have been confirmed to have obvious neurotoxicity, reproductive toxicity, carcinogenicity and
23 genotoxicity (Van and Boer, 2012; Du et al. 2015). At present, the occurrence of OPEs has been
24 reported in the air (Takigami et al. 2009; Stapleton et al. 2009; Clark et al. 2017; Yin et al. 2020),
25 wastewater and sludge (Bester et al. 2005; Gao et al. 2016), surface water (Reemtsma et al. 2008;
26 Regnery and Püttmann, 2010; Guo et al. 2017a), sediments (Cao et al. 2012; Cheng et al. 2014; Giulivo
27 et al. 2017), soils (Mihajlovic et al. 2011; Matsukami et al. 2015; Wan et al. 2016; Cui et al. 2017;
28 Deng et al. 2019) and humans (Shah et al. 2006; Schindler et al. 2009), even in remote areas
29 (McDonough et al. 2018). OPEs have become recognized global organic pollutants. As contaminants
30 of emerging concern, OPEs are gradually becoming of research interest to the scientific community. In
31 this paper, alkyl OPEs (TnBP, TBEP, TEHP), chlorinated OPEs (TCEP and TCIPP) and phenyl OPEs
32 (TPhP) were selected because they are widely used in industry and previous studies have shown that
33 their concentrations in all environmental media are relatively high (Bacaloni et al. 2008; Shi et al. 2016;
34 van der Veen and de Boer, 2012; Zhang et al. 2018).
35 After entering aquatic environments, OPEs endure a series of migration, transformation and
36 bioconcentration related processes. The structural differences among OPEs lead to a variety of
37 chemical and physical properties that result in differences in environmental behaviors. OPEs have only
38 anthropogenic sources as opposed to natural sources, so cities with large populations are potential high-
39 risk areas for OPE pollution in which water bodies are an essential sink of OPEs. Previous studies have
340 focused on the occurrence of OPEs in rivers and sediments (Bacaloni et al. 2008; Rodil et al. 2012;
41 Giulivo et al. 2017; Guo et al. 2017a; Hou et al. 2019; Wu et al. 2019; Zeng et al. 2021), but almost no
42 attention has been paid to urban landscape water bodies. Compared with rivers, urban landscape water
43 has a relatively low flow rate and long water exchange time. The residence time of a relatively open
44 water body ranges from approximately minutes to hours, and the residence time of a semiclosed water
45 body can be hours to days depending on the water temperature. Closed water bodies have limited water
46 exchange, and its retention time is the longest, resulting in its OPE pollution characteristics can reflect
47 emissions from local sources. Therefore, the OPE pollution characteristics and its partitioning behavior
48 in different types of landscape water bodies is of great interest.
49 The city of Chengdu, located in the middle reaches of the Minjiang River Basin, is the capital of
50 the Sichuan Province and the only megacity (16.33 million people in 2018) in Southwest China.
51 However, there have been few studies on OPEs in this region. To date, there are 25 parks in Chengdu
52 city, and the landscape water for urban parks covers an area of 6.50×10 5 m2. This study aims to 1)
53 investigate the pollution levels and characteristics of OPEs in water, suspended particulate matter
54 (SPM) and sediments of representative park landscape waters; 2) analyze the distribution behavior of
55 OPEs in different water bodies; and 3) reveal the relationship between the OPE distribution and its
56 influencing factors. The results can fill knowledge gaps regarding OPE pollution in different phases in
57 the park landscape waters of Southwest China and shed light on their partition behavior, which is of
58 great significance for OPE pollution prevention and control.
59 Materials and Methods
60 Chemicals
461 The main reagents, including ethyl acetate, acetone, hexane and acetonitrile, were high-
62 performance liquid chromatography (HPLC) grade (Kelon Chemical, China). The standard solutions
63 including tri-n-butyl phosphate (TnBP, 97%) (Cas NO.: 126-73-8), tris-(2-ethylhexyl) phosphate
64 (TEHP, 97%) (Cas NO.: 78-42-2), tris-(2-butoxyethyl) phosphate (TBEP, 94%) (Cas NO.: 78-51-3),
65 triphenyl phosphate (TPhP) (Cas NO.: 115-86-6), tris-(2-chloroethyl)-phosphate (TCEP) (Cas NO.:
66 115-96-8) and Tris-(2-chloroisopropyl) phosphate (TCIPP) (Cas NO.: 13674-84-5) and internal
67 standard (triphenyl phosphate-d15 (TPhP-d15)) (Cas NO.:1173020-30-8) were all purchased from
68 Sigma-aldrich Corp., USA. Copper, aluminium oxide, silica gel, Na 2SO4 and other chemicals were
69 purchased from Kelon Chemical Corp., China. Deionized water was supplied from a Milli-Q
70 equipment.
71 Sample Collection
72 In April of 2017, samples were collected from 11 parks in Chengdu city. There was no rainfall
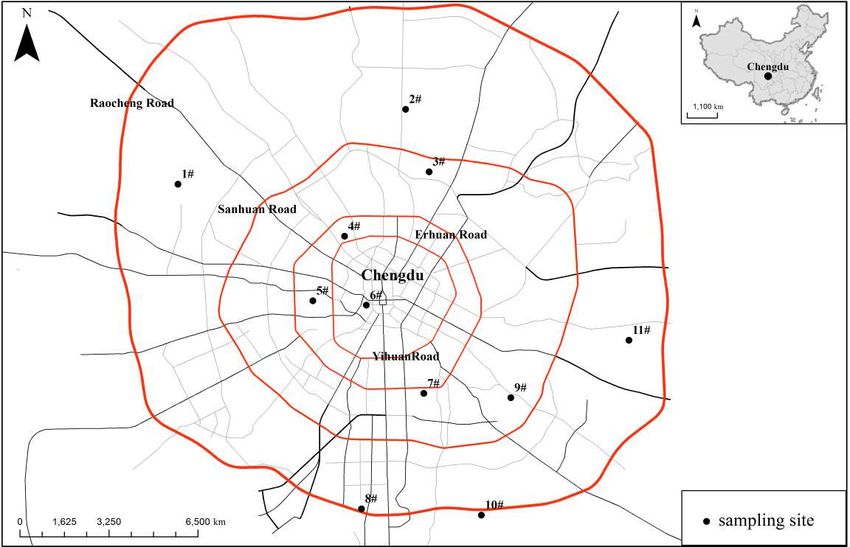
73 during sample collection period. Geographic information on all 11 sampling sites is shown in table 1
74 and the spatial distribution of sampling locations is shown in Fig. 1. Due to the layout of cities in
75 different directions, their population density, industrial development and environmental conditions vary.
76 The main roads in Chengdu include the 1st ring road (Yihuan road), 2nd ring road (Erhuan road), 3rd
77 ring road (Sanhuan road), and fouth ring road (Raocheng road), spreading from the downtown center to
78 the outskirts with a radial pattern. Site 6# (People's Park) was located in the first ring, two sites
79 including 4# (Jinghu Park) and 5# (Huanhuaxi Park) were located in the second ring, three sampling
80 sites including 3# (Shahe Park), 7# (East Lake Park) and 9# (Daguanyan) were located in the third ring,
81 and five sampling sites including 1# (Lianghe City Park), 2# (Fenghuangshan Park), 8# (Jincheng
582 Park), 10# (Bailu Bay Wetland Park) and 11# (Qinglong Lake Wetland Park) were located in the fourth
83 ring. The number of sampling sites is positively correlated with the area of the ring (p < 0.05).
84 Moreover, the sampling sites covered different types of landscape water bodies (relatively open: 5#, 7#,
85 8#; semiclosed: 3#, 10# and closed water bodies: 1#, 2#, 4#, 6#, 9#, 11#). Therefore, all samples are
86 representative and typical. The aera of the 11wetland parks ranges from 0.11 km2 to 20 km2 (Table 1).
87 The surface water was sampled at 0.5 m below the water surface. The water samples collected
88 from multiple sampling sites were mixed into one water sample, and parallel samples were obtained. A
89 shovel immersed in the water body was used to collect sediment samples near the shore. The sediment
90 samples were wrapped with aluminum foil, sealed in a seal bag, transported to the laboratory as soon as
91 possible and stored in a refrigerator at -20 ℃.
92 Sample Preparation and Analysis
93 The procedures for extraction and clean-up of the water and sediment samples followed a
94 previously described method with minor modifications (Wu et al. 2019; Yin et al. 2021). Each sample
95 was pretreated after spiking with a surrogate standard (100 ng of triphenyl phosphate-d15 (TPhP-d15)).
96 1L of surface water sample was passed through a 0.45 μm quartz filter to obtain SPM and water
97 samples. The water samples were clear and transparent, indicating that the algae content was low.
98 Solid-phase extraction with a C18 column was used to enrich the target substances in the water samples.
99 The C18 column was eluted with 10 mL hexane for removal of impurities and then with 10 mL ethyl
100 acetate/acetone (v/v, 4/3) for elution of the target substances. The eluent was concentrated and the final
101 volume was adjusted to 100 μL for gas chromatography-mass spectrometry (GC-MS) analysis.
102 The SPM samples were freeze-dried, soaked in 20 mL ethyl acetate/acetone (v: v, 3:2) for 12
6103 hours, and ultrasonically extracted twice for 30 minutes. Then, they were concentrated to
104 approximately 1 mL with vacuum-condensing equipment and loaded onto an activated aluminum
105 oxide/silica gel (v: v, 3:1) column. The column was first eluted with 20 mL hexane to remove
106 impurities, then with 20 mL ethyl acetate/acetone (v: v, 3:2), and the eluate (ethyl acetate/acetone) was
107 collected. The solvent extracts were concentrated to 100 μL for GC-MS analysis.
108 By measuring the content of OPEs in surface water, SPM and sediments, as well as the content of
109 organic matter in SPM and sediments, the water-SPM and water-sediment distribution coefficients
110 were calculated. The distribution coefficients were calculated as follows:
111 Ka Csed / Cw 1000 (1)
112 K b Cspm / Cw 1000 (2)
113 Ka: equilibrium coefficient between water and SPM (cm3/g),
114 Kb: equilibrium coefficient between water and sediment (cm3/g),
115 Csed: the content of OPEs in sediment at equilibrium (ng/g),
116 Cspm: the content of OPEs in SPM at equilibrium (ng/g),
117 Cw: the content of OPEs in surface water at equilibrium (ng/L).
118 Koc Ka(or b) 100 / f oc (3)
119 Koc:standardized partition coefficient of organic carbon (cm3/g);
120 foc:content of organic carbon in sediment/suspended particulate matter (%)
121 Total organic carbon was determined by potassium dichromate titration.
122 Detailed analytical parameters were similar with those in Wu et al. 2019 and Yin et al. 2021. The
123 GC was equipped with SH-Rxi-5Sil MS capillary column (30 m × 0.25 µm × 0.25 mm, Shimadzu,
7124 Japan) and operated with a 280 °C inlet temperature using splitless injection. The MS source was
125 electron impact (EI), and it was operated in selected ion monitoring (SIM) mode. The GC oven
126 temperature was held at 50 °C for 1 minute, increased to 200 °C at 15 °C min -1 and held for 1 minute,
127 increased to 250 °C at 4.00 °C min-1, and then increased to 300 °C at 20 °C min-1 and held for 4
128 minutes. The interface temperature was 280 °C, and the ion source temperature was 200 °C.
129 Quality Assurance and Quality Control (QA/QC)
130 Thorough QA/QC procedures for OPEs analysis were conducted to ensure data quality. To
131 evaluate the recovery efficiencies of analytical procedures, internal standard (TPhP-d15) was added in
132 all samples, and the accuracy was evaluated via their recoveries. The concentrations of the 6 OPEs
133 were determined by an external standard method. The correlation coefficients of the standard curves of
134 the six OPE compounds (0.05-2.00 mg/L) were all higher than 0.99. The recoveries of the 6 OPEs were
135 determined, ranged from 75% to 126% (Table 2). Procedural contamination from the analytical steps
136 aforementioned was evaluated via running a matrix blank with every batch of 10 samples. Only TnBP
137 and TCEP were detected in the blanks, and the levels were < 5% of the concentrations measured in all
138 samples, which meant that they were negligible. The detection limit of the instrument (LODs) (S/N = 3)
139 ranged from 0.02 mg/L to 0.04 mg/L and the instrument precision was 3%-7%.
140 Statistical Analysis
141 Data analysis was performed using the IBM SPSS 22.0. software. Before statistical analysis, data
142 were tested for normality through Kolmogorov-Smirnoff and Shapiro-Wilk test which showed normal
143 distribution of the data (p > 0.05 for all). Analysis of variance (ANOVA) was used to investigate
8144 significant differences in individual OPEs concentrations in different matrix. Correlations between the
145 three environmental phases were analyzed by Pearson’s correlation coefficients. For the calculation of
146 OPEs, non-detectable compounds and concentrations below the method detection limit (MDL) were
147 treated as zero. Statistical significance was set as p < 0.05.
148 Results and Discussion
149 Occurrence and Levels of OPEs in Surface Water, SPM and Sediments
150 All OPE compounds had detection rates of 100% for all SPM samples, while all OPE compounds
151 had an over 50% detection rate for all water and sediment samples. Although the TCIPP and TPhP had
152 detection rates of 91% for all water samples, TCIPP (73%), TBEP (64%) and TPhP (55%) had
153 moderate detection rates for sediment samples, and other OPE compounds had detection rates of 100%.
154 High detection rates of OPEs in the aqueous environment indicated that OPE pollution was ubiquitous
155 in the investigated area.
156 The concentrations of Σ6OPEs in the water samples were in the range of 213-658 ng/L, with a
157 median value of 359 ng/L. Compared with OPEs in other lakes and reservoirs, the concentrations of
158 OPEs in the present study were higher than those found in volcanic lakes (average: 165 ng/L)
159 (Bacaloni et al. 2008) and the Great Lakes (7.3-96 ng/L) (Venier et al. 2014), but two times lower than
160 those in the Pearl River Delta (median concentration: 837 ng/L) (Zhang et al. 2018) and one order of
161 magnitude lower than those in found freshwater from Germany (average: 2.06×10³ ng/L) (Ernst, 1988)
162 and Spain (average: 1.98×10³ ng/L) (Cristale et al. 2013).
9163 The concentrations of Σ6OPEs in sediment samples were in the range of 49.2-482 ng/g, with a
164 median value of 82.8 ng/g. The highest concentration of OPEs appeared at site 4#, followed by site 3#,
165 which was highly related to the high density of human activities. The Σ6OPE level in sediment samples
166 is comparable with those from the Pearl River Delta (8.3-470 ng/g) (Tan et al. 2016) in China and the
167 Adige River basin in Italy (11.5-549 ng/g), higher than those in the Evrotas River basin in Greece
168 (10.5-248 ng/g), the Sava River basin in Slovenia (0.31-310 ng/g) (Giulivo et al. 2017), Bui Dau in
169 Vietnam (5-300 ng/g) (Giulivo et al. 2017), Austria (5.74 ng/g) (Matsukami et al. 2016) and Norway
170 (4.98 ng/g) (Martínez-Carballo et al. 2007), but lower than those in the Flanders Rivers in Belgium
171 (673 ng/g) (Green et al. 2008) and the Llobregat River basin in Spain (n.d.- 2.42×10³ ng/g) (Santín et al.
172 2016).
173 The concentrations of Σ6OPEs in SPM varied from 468 to 6.74×10 3 ng/L (2.22×10⁴-7.08×10⁵ ng/g
174 dw), with a median of 2.94 ×10³ ng/L (6.88×10⁴ ng/g dw). The highest concentration of OPEs in SPM
175 was observed at site 8#. Site 8# is in a new wetland park with low population density. However, it is
176 located in a high-tech zone with electronic industry and a large number of new company buildings and
177 industrial parks, which was the cause of high emissions of TnBP and TBEP. Compared with the
178 concentration of traditional brominated flame retardants, the levels of OPEs in SPM in our study were
179 three to five orders of magnitude higher than those in PBDEs found in seawater near Hong Kong (Wurl
180 et al. 2006). A similar trend was found in Dongjiang industrial water (Ruan et al. 2014). The
181 concentration of brominated flame retardants in water was lower than that of OPEs, indicating that
182 OPEs, as substitutes for brominated flame retardants, result in a higher concentration in some
183 environmental media at present. Other researchers have found similar results in which the
10184 concentrations of OPEs were higher than those of brominated flame retardants in the 40 rivers flowing
185 into Bohai (Wang et al. 2015).
186 In general, the concentrations of OPEs in surface water and sediments of landscape waters in the
187 present study were at the middle/low levels compared to other waters. However, the average
188 concentration of OPEs in SPM was one to three orders of magnitude higher than that in surface water
189 and sediments, indicating that SPM is more easily enriched with OPEs than water and sediments.
190 Consequently, urgent attention should be given to OPE contamination in SPM.
191 In the surface water samples, TnBP (range: 104-227 ng/L, median: 146 ng/L, 39% of Σ6OPEs) and
192 TCIPP (n.d.-285 ng/L, 125 ng/L, 35% of Σ6OPEs) were the predominant chemicals of OPEs. There
193 were significant differences between the concentrations of individual OPEs in the aqueous phase (p <
194 0.01). The concentrations of TnBP and TCIPP were 1-2 orders of magnitude higher than those of
195 TEHP and TPhP. The concentrations of the major pollutants in surface water was relatively low
196 compared to the global lake waters (Bacaloni et al. 2008; Shi et al. 2006; Venier et al. 2014).
197 The main components of OPEs in sediments were TnBP (range: 16.2-439 ng/g, median: 61.7 ng/g,
198 67% of Σ6OPEs), TBEP (n.d.-128 ng/g, 11.5 ng/g, 13% of Σ6OPEs) and TEHP (8.6-32.6 ng/g, 8.64
199 ng/g, 8% of Σ6OPEs). Significant differences were also found between the concentrations of individual
200 OPEs in the sediment samples (p < 0.01). The concentrations of dominant OPEs in the sediments were
201 higher than those in TaiHu (TBEP: 1.03-5.00 ng/g) (Cao et al. 2012) and the Pearl River Delta (TBEP:
202 5.8-46 ng/g, TEHP: 6.2-44 ng/g) (Tan et al. 2016).
203 All OPE compounds were detected in the SPM samples, with TnBP (1.06×10 4-5.42×10⁵ ng/g,
204 median: 3.26×10⁴ ng/g, 76% of Σ6OPEs), TBEP (1.82×10³-7.74×10⁴ ng/g, 7.72×10³ ng/g, 7% of
11205 Σ6OPEs), TCIPP (1.29×10³-1.03×10⁵ ng/g, 3.91×10³ ng/g, 7% of Σ6OPEs) and TCEP (1.07×10³-
206 6.36×10⁴ ng/g, 3.40×10³ ng/g, 7% of Σ6OPEs) being the dominant components. TnBP has a
207 significantly higher concentration than the other compounds (p < 0.01). Compared with the main
208 pollutants of TnBP (median: 21.5 ng/g, 38% of ΣOPEs) and TCEP (median: 10.7 ng/g, 32% of ΣOPEs)
209 in the Pearl River Delta, the concentrations of individual OPEs in the SPM of the scenic water in this
210 study were approximately 2-4 orders of magnitude higher (Zhang et al. 2018).
211 In general, the distribution patterns of OPEs in the aqueous phase and SPM were similar, and
212 Σ(TnBP+TCIPP+TCEP) accounted for 82% and 91% of the Σ6OPEs in the aqueous phase and SPM,
213 respectively. Regarding the sediment samples, TnBP, TBEP and TEHP were the dominant compounds
214 found at all sampling sites, and Σ(TnBP+TBEP+TEHP) accounted for 86% of the Σ 6OPEs. The
215 different patterns of OPEs could be attributed to differences in their accumulation features and
216 degradability due to varying physicochemical properties, as well as differences in their production and
217 usage (Wang et al. 2015).
218 To further elucidate the OPE patterns in surface water, sediments and SPM, OPEs were divided
219 into alkyl OPEs (TnBP, TBEP, TEHP), chlorinated OPEs (TCEP and TCIPP) and phenyl OPEs (TPhP).
220 Alkyl OPEs dominated the profile in three phases (water, sediments and SPM), and their percentage in
221 the latter two phases was greater than 85%. Chlorinated OPEs accounted for 43% of Σ6OPEs in the
222 water, but 10% and 14% of Σ6OPEs in the SPM and sediment samples, respectively.
223 Based on the specific water environment, the 11 sampling sites were divided into relatively open,
224 closed and semiclosed water body categories. 7# (Donghu Park) and 8# (Jincheng Park) are relatively
225 open water bodies that converge with the Fuhe River and Xiaojia River, respectively. Continuous
12226 emission input, complex hydrodynamic conditions and frequent resuspension of OPEs in sediments
227 results in high concentrations of OPEs in SPM and low concentrations in sediments. Sites 3# and 10#
228 are typical semiclosed water bodies. Although these two sampling sites have inflows from other
229 tributaries, they could be seen as closed water bodies as a whole. These sites showed higher OPE
230 pollution in the water phases, whereas the concentrations of OPEs in SPM were low. The other sites (1-
231 2#, 4#, 6#, 10-11#) are typical closed water bodies. As typical representative closed water body, sites
232 2# and 4# have the highest concentrations of OPEs in water and sediment samples respectively, which
233 have almost no water exchange, coupled with a long history of pollution and a high density of human
234 activities, resulting in the highest concentrations of OPEs in water and sediments and but low
235 concentrations in SPM.
236 Distribution of OPEs Between Surface Water, SPM and Sediments
237 Distribution of OPEs Between Surface Water and SPM
238 Correlation analyses were performed between the concentration of Σ 6OPEs in water, sediment and
239 SPM samples and significant correlations were observed in different matrix (Table S1). A strong
240 positive correlation was found between log Ka and log Kb (R2 = 0.80, p < 0.05) (Fig. S1), which
241 suggested that it was meaningful to study the partition behavior between different matrix (Wang et al.
242 2018). The calculated log Koc value between water and SPM was shown in Table 3.
243 The log Ka values of TCIPP (R = 0.654, p < 0.05) and TPhP (R = 0.662, p < 0.05) were
244 significantly and positively correlated with foc. The same results reported that only the log Ka of TnBP
245 (R = 0.677, p < 0.05) and TCIPP (R = 0.669, p < 0.05) was significantly and positively correlated with
13246 foc (Zhang et al. 2018). This suggests that the partitioning of most OPEs between the water and SPM
247 was not mediated by foc.
248 As shown in Fig. 2, no significant correlation was observed between log Koc and log Kow. These
249 results differed from the research of Zhang et al (2018) who reported that the significant correlation
250 was found between log Koc and log Kow in Pearl River Delta from China. Noticeably, the calculated log
251 Koc value of most of OPE compounds in the present study was higher than the data reported by Zhang
252 et al (2018) and the predicted log Koc using EPI Suite software (US EPA, 2012). Therefore, the
253 partition behaviors of OPEs in wetland park landscape water bodies were different from lakes and
254 rivers.
255 Distribution of OPEs Between Surface Water and Sediments
256 The correlation between log Kb and foc of the sediment samples showed that the log Kb of TnBP
257 was highly correlated with foc (R= 0.809, p < 0.01), and TnBP was the most abundant component in the
258 water (39% of Σ6OPEs) and sediment (67% of Σ6OPEs) samples. This result indicated that organic
259 carbon was one of the most critical factors affecting the distribution of OPEs in water and sediments.
260 According to the correlation analysis between log Koc and log Kow of OPEs in the water and
261 sediment samples, a significant positive linear correlation between log Koc and log Kow was only found
262 at site 10# (R = 0.839, p < 0.05) (Fig. 3 and Fig. 4), suggesting that the partition was dominated by
263 hydrophobic interactions at this site, which was similar to the results from Taihu Lake (Wang et al.
264 2018). Except for TEHP, the calculated log Koc values between water and sediment samples were
265 higher than the values reported by Wang et al (2018).
14266 Overall, the calculated log Koc value in the present study was markedly higher than those from
267 previous studies both in water-SPM and water -sediment phase. The higher log Koc values could be
268 partly explained by the compositions of organic matters in SPM and the sorption kinetics of chemicals
269 (Cao et al. 2017). Additionally, the landscape water bodies brought in the fresh discharges of OPEs.
270 The spontaneously migration of OPEs in the sediment and SPM samples to the aqueous phase could
271 not be ignored. These differed from the river or lakes in which the partitioning process was
272 significantly influenced by the contributions of ongoing emissions from the water phase.
273 Conclusions
274 Generally, the concentration of OPEs in the surface water and sediment of landscape water in the
275 megacity in Southwest China was at the middle/low level. The Σ6OPE concentration in the SPM was 1-
276 3 orders of magnitude higher than that in the surface water and sediments. This phenomenon needs
277 additional attention.
278 In terms of OPE profiles, TnBP, TCIPP and TCEP were the main OPE pollutants in surface water
279 and SPM, while TnBP, TBEP and TEHP were dominant in sediments. Alkyl phosphates were the
280 dominant pollutants in the three phases.
281 The calculated log Koc in the park landscape water bodies were higher than the rivers reported by
282 the previous studies. Differed from the lakes and rivers, the OPE properties (foc, Kow, degradability) and
283 the environmental conditions (the input sources and the hydraulic retention time, etc.) mainly influence
284 the partitioning processes of OPEs in different matrix in the park landscape water bodies. Especially,
285 Kow can partly explain the partitioning process of OPEs between water and sediment samples. The OPE
15286 pollution prevention should be based on the consideration on the changing of the main influencing
287 environmental factors except for the control of the source emissions.
288
289 Declaration of Interests The authors declare that they have no known competing financial interests or
290 personal relationships that could have appeared to influence the work reported in this paper.
291
292 Acknowledgements This work was financially supported by the National Natural Science Fund of
293 China (No.41773072, No.21407014)
16294 References 295 Bacaloni A, Cucci F, Guarino C, Nazzari M, Samperi R, Laganà A (2008) Occurrence of 296 organophosphorus flame retardant and plasticizers in three volcanic lakes of central Italy. Environ 297 Sci Technol 42(6):1898–1903. https://doi.org/10.1021/es702549g 298 Bester K (2005) Comparison of TCIPP concentrations in sludge and wastewater in a typical German 299 sewage treatment plant-comparison of sewage sludge from 20 plants. J Environ Monit 7(5):509– 300 513. https://pubs.rsc.org/. https://doi.org/10.1039/b502318a 301 Cao S, Zeng X, Song H, Li H, Yu Z, Sheng G, Fu J (2012) Levels and distributions of organophosphate 302 flame retardants and plasticizers in sediment from Taihu Lake, China. Environ Toxicol Chem 303 31(7):1478–1484. https://doi.org/10.1002/etc.1872 304 Cao D D, Guo J H, Wang Y W, Li Z N, Liang K, Corcoran M B, Hosseini S, Bonina S M C, Rockne K 305 J, Sturchio N C, Giesy J P, Liu J F, Li A (2017) Organophosphate Esters in Sediment of the Great 306 Lakes. Environ Sci Technol 51(3):1441–1449. https://doi.org/10.1021/acs.est.6b05484 307 Cheng D, Liu X, Wang L, Gong W, Liu G, Fu W, Cheng M (2014) Seasonal variation and sediment- 308 water exchange of antibiotics in a shallower large lake in North China. Sci Total Environ 309 476(1):266–275. https://doi.org/10.1016/j.scitotenv.2014.01.010 310 Clark A E, Yoon S, Sheesley R J, Usenko S (2017) Spatial and temporal distributions of organophosph 311 -ate ester concentrations from atmospheric particulate matter samples collected across Houston, T 312 X. Environ Sci Technol 51(8):4239–4247. https://doi.org/10.1021/acs.est.7b00115 313 Cristale J, García V A, Barata C, Lacorte S (2013) Priority and emerging flame retardants in rivers: 314 occurrence in water and sediment, Daphnia magna toxicity and risk assessment. Environ Int 315 59:232–243. https://doi.org/10.1016/j.envint.2013.06.011 316 Cui K, Wen J, Zeng F, Li S, Zhou X, Zeng Z (2017) Occurrence and distribution of organophosphate 317 esters in urban soils of the subtropical city, Guangzhou, China. Chemosphere 175:514–520. 318 https://doi.org/10.1016/j.chemosphere.2017.02.070 319 Deng X, Yin H L, He W L, Luo Y, Wu D, Luo L, Chen J (2019) Distribution and migration of 320 organophosphate in soil and crops in Chengdu City/suburb profile. Environ Chem 38(03):679–685. 321 https://doi.org/10.7524/j.issn.0254-6108.2018042803 322 Du Z, Wang G, Gao S, Wang Z (2015) Aryl organophosphate flame retardants induced cardiotoxicity 323 during zebrafish embryogenesis: by disturbing expression of the transcriptional regulators. Aquat 324 Toxicol 161:25–32. https://doi.org/10.1016/j.aquatox.2015.01.027 325 Gao L, Shi Y, Li W, Liu J, Cai Y (2016) Occurrence and distribution of organophosphate triesters and 326 diesters in sludge from sewage treatment plants of Beijing, China. Sci Total Environ 544:143–149. 327 https://doi.org/10.1016/j.scitotenv.2015.11.094 328 Giulivo M, Capri E, Kalogianni E, Milacic R, Majone B, Ferrari F, Barceló D (2017) Occurrence of hal 329 -ogenated and organophosphate flame retardants in sediment and fish samples from three Europea 330 n river basins. Sci Total Environ 586:782–791. https://doi.org/10.1016/j.scitotenv.2017.02.056 331 Green N, Schlabach M, Bakke T, Brevik E M, Dye C, Herzke D, Huber S, Plosz B, Remberger M, 332 Schoyen M, Uggerud H T, Vogelsang C (2008) Screening of selected metals and new organic 333 contaminants. Norwegian Pollution Control Agency. https://www.researchgate.net/publication
334   Guo J, Romank K, Westenbroek S, Hites R A, Venier M (2017a) Current use flame retardants in the w-
335       ater of Lake Michigan tributaries. Environ Sci Technol 51(17):9960–9969. https://doi.org/10.1021
336       /acs.est.7b01294
337   Hou L, Jiang J, Gan Z, Dai Y Y, Yang P, Yan Y, Ding S, Su S J, Bao X M (2019) Spatial distribution o
338       -f organophosphorus and brominated flame retardants in surface water, sediment, groundwater, an
339       d wild fish in Chengdu, China. Arch Environ Contam Toxicol 77:279–290. https://doi.org/10.1007
340       /s00244-019-00624-x
341   Martínez-Carballo E, González-Barreiro C, Sitka A, Scharf S, Gans O (2007) Determination of
342       selected organophosphate esters in the aquatic environment of Austria. Sci Total Environ
343       388(1):290–299. https://doi.org/10.1016/j.scitotenv.2007.08.005
344   Matsukami H, Tue N, Suzuki G, Someya M, Tuyen L H, Viet P H, Takahashi S, Tanabe S, Takigami H
345       (2015) Flame retardant emission from e-waste recycling operation in northern Vietnam:
346       environmental occurrence of emerging organophosphorus esters used as alternatives for PBDEs.
347       Sci Total Environ 514:492–499. https://doi.org/10.1016/j.scitotenv.2015.02.008
348   Matsukami H, Suzuki G, Tue N M, Tuyenle H, Viet P H, Takahashi S, Tanabe S, Takigami H (2016)
349       Analysis of monomeric and oligomeric organophosphorus flame retardants in fish muscle tissues
350       using liquid chromatograph electrospray ionization tandem mass spectrometry: application to Nile
351       tilapia (Oreochromis niloticus) from an e-waste processing area in northern Vietnam. Emerg
352       Contam 2(2):89–97. https://doi.org/10.1016/j.emcon.2016.03.004
353   McDonough C A, De Silva A O, Sun C, Cabrerizo A, Adelman D, Soltwedel T, Bauerfeind E, Muir D
354       C G, Lohmann R (2018) Dissolved organophosphate esters and polybrominated diphenyl ethers in
355       remote marine environments: Arctic surface water distributions and net transport through Fram
356       Strait. Environ Sci Technol 52(11):6208–6216. https://doi.org/10.1021/acs.est.8b01127
357   Mihajlovic ´I, Miloradov M V, Fries E (2011) Application of Twisselmann extraction, SPME, and GC-
358       MS to assess input sources for organophosphate esters into soil. Environ Sci Technol 45(6):2264–
359       2269. https://doi.org/10.1021/es103870f
360   Reemtsma T, Quintana J B, Rodil R, Garcı´a-Lo´pez M, Rodrı´guez I (2008) Organophosphorus flame
361       retardants and plasticizers in water and air I. Occurrence and fate. Trends Analyt Chem
362       27(9):727–737. https://doi.org/10.1016/j.trac.2008.07.002
363   Regnery J, Püttmann W (2010) Seasonal fluctuations of organophosphate concentrations in precipitatio
364       -n and storm water runoff. Chemosphere 78(8):958–964. https://doi.org/10.1016/j.chemosphere.20
365       09.12.027
366   Rodil R, Quintana J B, Concha-Graña E, López-Mahía P, Muniategui-Lorenzo S, Prada-Rodríguez D
367       (2012) Emerging pollutants in sewage, surface and drinking water in Galicia (NW Spain).
368       Chemosphere 86(10):1040–1049. https://doi.org/10.1016/j.chemosphere.2011.11.053
369   Ruan W, Tan X, Luo X (2014) Organophosphorus flame retardants in surface sediments of Dongjiang
370       River. China environmental science 34:2394–2400. https://doi.org/10.3969/j.issn.1000-6923.2014.
371       09.042
372   Santín G, Eljarrat E, Barceló D (2016) Simultaneous determination of 16 organophosphorus flame
373       retardants and plasticizers in fish by liquid chromatography-tandem mass spectrometry. J
374       Chromatogr A 1441:34–43. https://doi.org/10.1016/j.chroma.2016.02.058
375   Schindler B K, FÖrster K, Angerer J (2009) Determination of human urinary organophosphate flame
376       retardant metabolites by solid-phase extraction and gas chromatography-tandem mass
377       spectrometry. J Chromatogr B 877(4):375–381. https://doi.org/10.1016/j.jchromb.2008.12.030
378   Shah M, Meija J, Cabovska B, Caruso J A (2006) Determination of phosphoric acid triesters in human
379       plasma using solid-phase microextraction and gas chromatography coupled to inductively coupled
380        plasma mass spectrometry. J Chromatogr A 1103(2):329–336. https://doi.org/10.1016/j.chroma.2
381       005.11.042
382   Shi Y, Gao L, Li W (2016) Occurrence distribution and seasonal variation of organophosphate flame
383       retardants and plasticizers in urban surface water in Beijing, China. Environ Pollut 209:1–10.
384       https://doi.org/10.1016/j.envpol.2015.11.008
385   Stapleton H M, Klosterhaus S, Eagle S, Fuh J, Meeker J D, Blum A, Webster T F (2009) Detection of
386       organophosphate flame retardants in furniture foam and U.S. house dust. Environ Sci Technol
387       43(19):7490–7495. https://doi.org/10.1021/es9014019
388   Takigami H, Suzuki G, Hirai Y, Ishikawa Y, Sunami M, Sakai S I (2009) Flame retardants in indoor du
389       st and air of a hotel in Japan. Environ Int 35(4):688–693. https://doi.org/10.1016/j.envint.2008.12.
390       007
391   Tan X X, Luo X J, Zheng X B, Li Z R, Sun R X, Mai B X (2016) Distribution of organophosphorus
392       flame retardants in sediments from the Pearl River Delta in South China. Sci Total Environ
393       544:77–84. https://doi.org/10.1016/j.scitotenv.2015.11.089
394   US EPA (2012) Estimation Programs Interface Suite for Microsoft Windows, v. U. S. E. P. A,
395       Washington, DC, USA.
396   Van der Veen I, de Boer D (2012) Phosphorus flame retardants: properties, production,environmental o
397       -ccurrence, toxicity and analysis. Chemosphere 88(10):1119–1153. https://doi.org/10.1016/j.chem
398       osphere.2012.03.067
399   Venier M, Dove A, Romanak K, Backus S, Hites R (2014) Flame retardants and legacy chemicals in
400       Great Lakes' water. Environ Sci Technol 48(16):9563–9572. https://doi.org/10.1021/es501509r
401   Wan W, Zhang S, Huang H, Wu T (2016) Occurrence and distribution of organophosphorus esters in
402       soils and wheat plants in a plastic waste treatment area in China. Environ Pollut 214:349–353.
403       https://doi.org/10.1016/j.envpol.2016.04.038
404   Wang R, Tang J, Xie Z, Mi W, Chen Y, Wolschke H, Ebinghaus R (2015) Occurrence and spatial distri
405       -bution of organophosphate ester flame retardants and plasticizers in 40 rivers draining into the Bo
406       -hai Sea, north China. Environ Pollut 198:172–178. https://doi.org/10.1016/j.envpol.2014.12.037
407   Wang T, Ding N, Wang T, Chen S J, Luo X J, Mai B X (2018) Organophosphorus esters (OPEs) in
408       PM2.5 in urban and e-waste recycling regions in southern China: concentrations, sources, and
409       emissions. Environ Res 167:437–444. https://doi.org/10.1016/j.envres.2018.08.015
410   Wang X, Zhu L, Zhong W, Yang L (2018) Partition and source identification of organophosphate
411       esters in the water and sediment of Taihu Lake, China. J Hazard Mater 360:43–50.
412       https://doi.org/10.1016/j.jhazmat.2018.07.082
413   Wu D, Yin H L, Li S P, Wang Z W, Deng X, Luo Y, Luo L (2019) Pollution characteristics of
414       organophosphates in surface water and sediment of Jinjiang River in Chengdu. Environ Sci
415       40(3):1245–1251. https://doi.org/10.13227/j.hjkx.201808038
416   Wurl O, Lam P K S, Obbard J P (2006) Occurrence and distribution of polybrominated diphenyl ethers
417       (PBDEs) in the dissolved and suspended phases of the sea-surface microlayer and seawater in Hon
418       -g Kong, China. Chemosphere 65(9):1660–1666. https://doi.org/10.1016/j.chemosphere.2006.02.0
419       24
420   Wurl O, Obbard J P, Lam P K S (2006) Distribution of organochlorines in the dissolved and suspended
421       phase of the sea-surface microlayer and seawater in Hong Kong, China. Mar Pollut Bull
422       52(7):768–777. https://doi.org/10.1016/j.marpolbul.2005.11.024
423   Yin H L, Liang J F, Wu D, Li S P, Luo Y, Deng X (2020) Measurement report: seasonal, distribution
424       and sources of organophosphate esters in PM2.5 from an inland urban city in southwest China.
425       Atmos Chem Phys 20(23):14933–14945. https://doi.org/10.5194/acp-20-14933-2020
426   Yin H L, Liu Q, Deng X, Liu X W, Fang S H, Xiong Y M, Song J J (2021) Organophosphates (OPEs)
427       in water, suspended particulate matter (SPM) and sediments of the Minjiang River. China Chinese
428       Chemical Letters. https://doi.org/10.1016/j.cclet.2021.02.023
429   Zeng J M, Zhong S H, Qian W, Yuan S W, Zhu X S (2021) Pollution status and biological toxicity of o
430       -rganophosphate in water environment. Environ Sci. https://doi.org/10.19674/j.cnki.issn1000-692
431       3.20210324.004
432   Zhang Y, Zheng X, Wei L, Sun R, Guo H, Liu X, Mai B (2018) The distribution and accumulation of
433       phosphate flame retardants (PFRs) in water environment. Sci Total Environ 630:164–170.
434       https://doi.org/10.1016/j.scitotenv.2018.02.215
435     Table captions:
436     Table 1 Information about the sampling sites.
437     Table 2 Recoveries of OPEs in each medium.
438     Table 3 The obtained log Koc between water-SPM and water-sediment.
439
440     Table 1 Information about the sampling sites.
                                                 Latitude and                             Water type         Aera(km2)
      Number               Location                                    Position
                                                  longitude
                                                   30°41′55″N                               Closed                 4.44
        1#        Lianghe City Park                                 Northwest
                                                   104°02′54″E
                      Fenghuangshan                30°75′20″N                               Closed                 10
        2#                                                             North
                          Park                     104°08′72″E
                                                   30°42′58″N                            Semiclosed                 --
        3#              Shahe Park                                     North
                                                   104°04′10″E
                  Jinghu, Southwest                                                         Closed                  --
                                                  30°39′35″N
        4#             Jiaotong                                        North
                                                  104°03′10″E
                      University
                                                  30°39′38″N                       Relatively open                 0.32
        5#            Huanhuaxi Park                                   Center
                                                  104°01′43″E
                                                  30°39′31″N                                Closed                 0.11
        6#        The people's Park                                    Center
                                                  104°03′19″E
                                                  30°37′14″N                           Relatively open             1.52
        7#            East Lake Park                                   Southeast
                                                  104°05′02″E
                                                  30°34′15″N                       Relatively open                 1.6
        8#            Jincheng Park                                    South
                                                  104°03′10″E
                                                  30°37′07″N                                Closed                  --
        9#              Daguanyan                                      Southeast
                                                  104°07′38″E
                        Bailu Bay                 30°34′05″N                             Semiclosed                 2
       10#                                                             Southeast
                      Wetland Park                104°07′45″E
                      Qinglong Lake               30°38′36″N                                Closed                 20
       11#                                                             Southeast
                      Wetland Park                104°11′10″E
441
442     Table 2 Recoveries of OPEs in each medium.
               compounds                 Water                   SPM                      Sediments

               TnBP                      90~111%                 82~130%                  89~112%
               TCEP                      81~102%                 90~112%                  83~108%
               TCIPP                     75~91%                  81~115%                  84~99%
               TDCPP                     90~116%                 85~120%                  103~119%
               TPhP                      83~99%                  96~110%                  76~117%
               TBEP                      92~108%                 82~109%                  80~103%
               TEHP                      91~114%                 75~98%                   89~126%

443

444     Table 3 The obtained log Koc between water-SPM and water-sediment.

                                                    Log Koc between water and SPM
                   1#        2#         3#        4#     5#       6#      7#     8#        9#        10#    11#
         TnBP     6.21      5.80       5.74      6.70   6.41     6.07    6.74   7.11      5.17       5.00   5.34
         TCEP     5.69      5.57       5.23      6.45   5.95     5.44    5.99   6.78      4.72       4.66   5.79
         TCPP     5.07      4.55       4.81      5.33   4.55     4.69    6.19   5.83       --        4.35   4.92
TPhP 5.59 5.12 5.30 5.69 5.26 5.27 5.57 6.21 -- 5.31 5.35
TBEP 5.57 5.86 5.73 5.96 5.65 5.49 5.68 7.03 5.28 5.74 5.78
TEHP 5.56 5.40 5.44 5.80 5.21 5.27 5.72 6.53 5.24 5.33 5.40
mean 5.62 5.38 5.38 5.99 5.51 5.37 5.98 6.58 5.10 5.07 5.43
Log Koc between water and sediment
1# 2# 3# 4# 5# 6# 7# 8# 9# 10# 11#
TnBP 4.61 4.98 4.41 4.80 4.42 4.50 4.22 4.69 4.15 4.55 5.04
TCEP 3.70 4.08 3.92 3.84 3.48 3.92 4.27 5.18 4.42 4.32 4.46
TCPP 3.77 3.89 -- 3.13 3.49 4.22 4.28 -- -- 4.34 4.10
TPhP 4.51 -- 3.99 4.08 -- 5.00 4.90 -- -- 5.14 --
TBEP -- -- 5.08 3.91 -- 4.96 4.88 -- 4.15 5.07 4.71
TEHP 4.54 4.82 4.51 3.90 4.36 4.94 4.61 5.42 4.23 5.42 4.68
mean 4.23 4.44 4.38 3.94 3.94 4.59 4.53 5.10 4.24 4.81 4.60
445446 Figure captions: 447 Fig. 1 Map of sampling sites. 448 Fig. 2 Correlations between the log Koc values of OPEs and their log Kow in water and SPM (black 449 square: the present study; blue squre: the study of Zhang et al. 2018). 450 Fig. 3 Correlations between the log Koc values of OPEs and their log Kow in water and sediments (black 451 squre: the present study; pink squre: the study of Wang et al. 2018). 452 Fig. 4 Correlations between the log Koc values of OPEs and their log Kow in water and sediments (only 453 for site 10#). 454 455 456 Fig. 1 Map of sampling sites.
7.0
                          Water-SPM
                                                       TnBP
                6.5                       TBEP                             y=-1.1970x+5.5541
                                                                           R2=1.7078
                6.0

                                                                                            TEHP
                5.5
                                                              TPhP
      logKoc

                5.0
                            TCEP
                4.5
                                     TCPP
                4.0                                      TPhP
                                                TnBP
                                                                          y=0.2802x+2.8386
                3.5                      TCPP
                             TCEP                                         R2=0.7128
                3.0
                      0              2             4                 6          8           10

457                                                       logKow
458   Fig. 2 Correlations between the log Koc values of OPEs and their log Kow in water and SPM (black
459   square: the present study; blue squre: the study of Zhang et al. 2018).
460
                7.0
                          Water-Sediment                                                TEHP
                6.5
                           y=0.0706x+4.1450
                6.0        R2=0.3463

                5.5
                                                   TnBP
       logKoc

                                            TBEP                                        TEHP
                5.0                                       TPhP
                              TCEP
                4.5                      TCPP

                                                          TPhP
                4.0
                                                   TBEP

                3.5                                    TnBP              y=0.4895x+2.0803
                                                                         R2=0.9527
                           TCEP             TCPP
                3.0
                      0              2             4                 6         8        10
                                                          logKow
461
462   Fig. 3 Correlations between the log Koc values of OPEs and their log Kow in water and sediments (black
463   squre: the present study; pink squre: the study of Wang et al. 2018).
Water-Sediment
5.2
(only for site 10#) TPhP
TEHP
5.0
TBEP
logKoc
4.8 y=0.1403x+4.2022
R2=0.7034
TnBP
p<0.05
4.6
4.4
TCEP
TCEP
4.2
0 2 4 6 8 10
464 logKow
465 Fig. 4 Correlations between the log Koc values of OPEs and their log Kow in water and sediments (only
466 for site 10#).
467
468 Supplementary Table and Figure
469 Table S1 Correlations between water, sediments and SPM.
470 Fig. S1 Correlation between the log Ka and log Kb.
471
472 Table S1 Correlations between water, sediments and SPM.
water sediment SPM water sediment SPM
water 1 .873* .880* water 1 .689 .690
1# sediment .873* 1 .990** 4# sediment .689 1 .998**
SPM .880* .990** 1 SPM .690 .998** 1
water 1 .549 .459 water 1 .633 .552
2# sediment .549 1 .975** 5# sediment .633 1 .983**
SPM .459 .975** 1 SPM .552 .983** 1
water 1 .197 .597 water 1 .881* .877*
3# sediment .197 1 .778 6# sediment .881* 1 .948**
SPM .597 .778 1 SPM .877* .948** 1
water sediment SPM water sediment SPM
water 1 .551 .895* water 1 .823* .250
7# sediment .551 1 .572 10# sediment .823* 1 .659
SPM .895* .572 1 SPM .250 .659 1
water 1 .241 .775 water 1 .822* .679
8# sediment .241 1 .457 11# sediment .822* 1 .875*
SPM .775 .457 1 SPM .679 .875* 1
9# water 1 .981** .894* Total water 1 .685 .735sediment .981** 1 .850* sediment .685 1 .991**
SPM .894* .850* 1 SPM .735 .991** 1
473 **. p < 0.01 (2-tailed)
474 *. p < 0.05 (2-tailed)
475
5.6
y=0.9780x+2.6671
TBEP
5.4 R2=0.8015
TnBP
5.2
TCEP TPhP
5.0 TEHP
logKa
4.8
4.6
4.4
TCPP
4.2
1.8 2.0 2.2 2.4 2.6 2.8
logKb
476
477 Fig. S1 Correlation between the log Ka and log Kb.Supplementary Files
This is a list of supplementary les associated with this preprint. Click to download.
SupplementaryTableandFigure.docx
Supplementaldata.xlsx
1.jpgYou can also read