The Supply Chain for Electric Vehicle Batteries - USITC
←
→
Page content transcription
If your browser does not render page correctly, please read the page content below
United States International Trade Commission
               Journal of International Commerce and Economics
                                                                                                     December 2018

                           The Supply Chain for
                          Electric Vehicle Batteries
                                     David Coffin and Jeff Horowitz

         Abstract
         Electric vehicles (EVs) are a growing part of the passenger vehicle industry due to
         improved technology, customer interest in reducing carbon footprints, and policy
         incentives. EV batteries are the key determinant of both the range and cost of the
         vehicle. This paper explains the importance of EV batteries, describes the
         structure of the EV battery supply chain, examines current limitations in trade
         data for EV batteries, and estimates the value added to EV batteries for EVs sold
         in the United States.

Keywords: motor vehicles, cars, passenger vehicles, electric vehicles, vehicle batteries, lithium-
ion batteries, supply chain, value chain.

Suggested citation: Coffin, David, and Jeff Horowitz. “The Supply Chain for Electric Vehicle Batteries.”
Journal of International Commerce and Economics, December 2018. https://www.usitc.gov/journals.

This article is the result of the ongoing professional research of USITC staff and is solely meant to represent the
opinions and professional research of the authors. It is not meant to represent in any way the views of the U.S.
International Trade Commission, any of its individual Commissioners, or the United States Government. Please
direct all correspondence to David Coffin and Jeff Horowitz, Office of Industries, U.S. International Trade
Commission, 500 E Street SW, Washington, DC 20436, or by email to David.Coffin@usitc.gov and
Jeffrey.Horowitz@usitc.gov.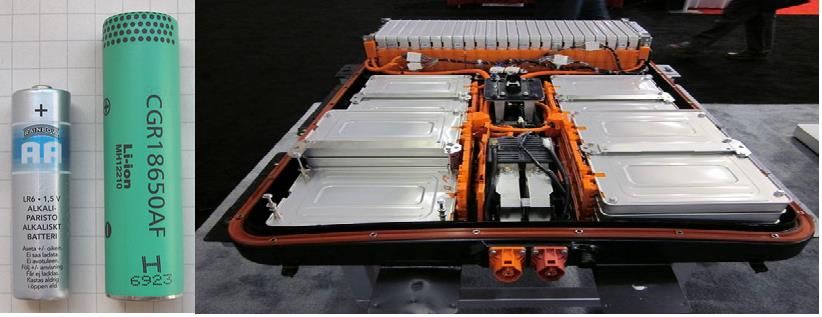
The Supply Chain for Electric Vehicle Batteries

                                                  Introduction
Supply chains spreading across countries have added complexity to tracking international trade
flows and calculating the value each country receives from a particular good. This article
explores the supply chain of one such good, the lithium-ion battery powering an electric
passenger vehicle.1

Electric vehicles (EVs) are becoming an increasingly important part of the automotive landscape.
According to a 2018 Morning Consult survey, only 23 percent of adults believe gasoline will
power a majority of motor vehicles in the year 2050, while 44 percent believe the majority will
be powered by electricity.2 EV sales rose sharply from 2013 to 2017, and these sales will likely
grow further as EV investment and government support increase and EV costs decline.
According to the 2018 IEA Global Electric Vehicle Outlook, new registrations of EVs increased
from 111,320 in 2013 to 750,490 in 2017, a 575-percent increase. Still, they accounted for only
0.8 percent of global vehicle sales in 2017.3 At the same time, EV prices have fallen
significantly. Analysts predict that some sizes of EVs will achieve cost parity with internal-
combustion-engine (ICE) vehicles by 2024 or 2025, and all EVs will do so by 2030 (assuming
no significant increases in material prices).4 For these reasons, as well as the availability of tax
incentives and other policy inducements, passenger vehicle manufacturers have invested
substantially in EVs, spending billions of dollars on related research and development and
offering new models.

While two Tesla models (the Model S and Model X) accounted for nearly one-half of all U.S.
EV sales in 2017, many other brands compete as well. Table 1 lists the 10 models with the most
sales in 2017. These 10 models accounted for 94 percent of 2017 U.S. EV sales. The table also
lists the assembly location of each model as well as the battery size, battery manufacturer,
location of battery pack assembly, and location of cell production. Six of the 10 models are
assembled in the United States, as are 7 of the 10 batteries that power the vehicles. But only four
of the batteries’ cells are produced in the United States.

 1 This article looks exclusively at passenger vehicles, which includes all vehicles under heading 8703 of the Harmonized Tariff
 Schedule of the United States (2018). This article does not include electric buses, or any vehicle designed for the transport of
 goods. For more information, see https://hts.usitc.gov/.
 2 Morning Consult, “How People View the Future of Mobility,” January 24, 2018, slide 16.
 3 IEA, Global EV Outlook 2018, Table A.5, 113; OICA, “2017 Production Statistics,” 2017.
 4 Soulopolous, “When Will Electric Vehicles Be Cheaper?” April 12, 2017; Ewing, “What Needs to Happen Before Electric

 Cars Take Over the World,” December 18, 2017.

                                                         Journal of International Commerce and Economics | 2
The Supply Chain for Electric Vehicle Batteries
Table 1: Major electric vehicle models as of 2017
Battery pack Battery cell
Range Assembly Battery Battery assembly production
Manufacturer Model (miles) location size (kWh) manufacturer location location
Tesla Model S 259–335 United States 75 or 100 Panasonic/ United States Japan
Teslaa
Tesla Model X 295 United States 75 or 100 Panasonic/ United States Japan
Teslaa
Tesla Model 3 220–310 United States 50−74 Panasonic/ United States United States
Teslaa
Chevrolet Bolt EV 238 United States 60 LG Chem United states South Korea
Nissan Leaf 151 United States 30 Automotive United States United States
Energy Supply
Corp.
Fiat 500e 84 Mexico 24 SB LiMotive United States United States
VW e-Golf 126 Germany 35.8 Samsung SDI Hungary South Korea
Ford Focus 118 United States 33.5 LG Chem United States United States
Electric
BMW i3 114 Germany 22−33 Samsung SDI Hungary South Korea
Kia Soul EV 111 South Korea 27 SK innovation South Korea South Korea
Sources: Ayre, “LG Chem,” February 21, 2017; BMW, “The BMW i3 and All-New BMW i3s” (accessed March 8, 2018);
Bosch, “Bosch Is One-stop Supplier,” June 2013; Burke and Silke Carly, “Tesla’s Real Capacity Problem?” June 14, 2017;
Chevrolet, “Bolt EV” (accessed March 8, 2018); EV Sales, “World Top 20,” January 31, 2017; Fiat, “2017 Fiat 500e” (accessed
March 8, 2018); Ford, “2018 Focus Electric” (accessed March 8, 2018); Herron, “Tesla Motors Battery Suppliers,” September
25, 2015; Kia Motors America, “2018 Soul EV” (accessed March 8, 2018); Lee, “Expansion In European Market,” March 30,
2017; McCarthy, “Tesla Dominates,” August 14, 2017; Nissan, “2018 Nissan Leaf” (accessed March 8, 2018); Pfanner and
Landers, “Nissan Considers Shift,” July 26, 2015; Reuters, “Samsung SDI, Bosch,” November 7, 2010; Tesla, “Model S”
(accessed January 10, 2018); Tesla, “Model S and Model 3 Comparison” (accessed March 8, 2018); Tesla, “Model X, The Best
SUV” (accessed March 8, 2018); Volkswagen, “e-Golf: Give the City a Jolt” (accessed March 8, 2018).
Note: kWh = kilowatt-hours.
a For all three Tesla vehicles, the battery cells are manufactured by Panasonic, and the battery modules and packs are
manufactured by Tesla. The battery cells for the Tesla Model 3 are manufactured in the United States, while the battery cells for
the other two models are produced in Japan.
The EV supply chain is similar to the ICE passenger vehicle supply chain. However, instead of
competing based on the engine and transmission, EVs compete based on their batteries. Lithium-
ion batteries power all EVs sold in the United States and have many different material
compositions. For example, lithium-nickel-manganese-cobalt oxide (Li(NiMnCo)O2 or NMC) is
the most common composition used in EVs, but lithium-nickel-cobalt-aluminum oxide
(Li(NiCoAl)O2 or NCA) is used in the best-selling EVs in the United States (Tesla Models S, X,
and 3).5
This paper is divided into five parts. The first part explains why understanding the EV battery
supply chain is important. The second part breaks down the different stages of the EV supply
chain and describes the inputs necessary at each stage. The third section discusses major battery
manufacturers supplying the U.S. market. The fourth section examines the available international
trade data, and describes (to the extent possible) international trends in EV battery trade, along
5For more information on types of lithium-ion batteries, see Battery University, “BU-205: Types of Lithium-ion” (accessed
January 10, 2018), and Battery University, “BU-1003: Electric Vehicles (EV)” (accessed January 10, 2018).
Journal of International Commerce and Economics | 3The Supply Chain for Electric Vehicle Batteries
with major U.S. import sources and export destinations for lithium-ion batteries and parts. The
final section offers a rough estimate of value added by country to batteries for EVs sold in the
United States.
The Importance of Batteries
Batteries are the key differentiator between the various EV manufacturers. The amount of energy
stored in the battery determines the range of the EV, thought to be a major limitation on EV
sales. Consumers tend to worry that an EV with a range of 80 to 250 miles on a single charge
would be inconvenient for long trips due to the time it takes to recharge the battery.
Manufacturers have spent millions to improve the availability and efficacy of EV chargers, and
as a result the fastest ones today take no more than 15 minutes to recharge a vehicle. However,
not many of those are available; most users plug their vehicles into “slow chargers,” which can
take much longer.6 Long charging times are likely why most EVs are charged at work or in the
home.7
The lithium-ion battery is also important in EVs because it makes EVs more expensive than
comparable vehicles with ICEs.8 Battery costs per kilowatt-hour (kWh) declined from roughly
$1,000 per kWh in 2010 to $227 in 2016,9 but EV prices (due to high battery costs) may not fall
to the level of ICEs in the larger vehicle segments until 2025 or 2030.10
Bloomberg New Energy Finance (BNEF) predicts that annual EV sales will increase from 1.1
million in 2017, to 11 million in 2025, and 30 million in 2030.11 If this is the case, demand for
the EV batteries will also surge. Lithium-ion batteries made up 70 percent of the rechargeable
battery market in 2016; since then, EV-driven demand for lithium-ion batteries has risen, and
will likely continue to rise as long as lithium-ion batteries are the primary power source for
EVs.12 BNEF projects that global production capacity for lithium-ion batteries will increase from
103 gigawatt-hours (GWh) in the first quarter of 2017 to 273 GWh by 2021.13
EV batteries, like many high-technology goods, have a complex supply chain in which
production can be separated into stages, and those stages can be completed in different locations.
This next section describes the current structure of the EV battery supply chain.
6 For example, to fully charge a Tesla Model S 100D using a 120V charger would take about four days. Yamauchi, “Tesla
Charging,” (accessed October 1, 2018).
7 IEA, Global EV Outlook 2017, 2017, 33.
8 A replacement battery for a 2011 to 2015 Nissan Leaf costs consumers $5,499, but the cost to Nissan may actually be higher.
Voelcker, “Nissan Leaf $5,500 Battery Replacement Loses Money,” July 24, 2014; McKinsey & Company, Electrifying
Insights, January 2017, 10.
9 McKinsey & Company, Electrifying Insights, January 2017, 10.
10 McKinsey & Company, Electrifying Insights, January 2017, 13.
11 Bloomberg New Energy Finance, “Electric Vehicle Outlook 2018,” 2018.
12 Desjardins, “Here Are the Raw Materials We Need,” October 27, 2016.
13 Curry, “Lithium-ion Battery Costs and Market,” July 5, 2017, 5.
Journal of International Commerce and Economics | 4The Supply Chain for Electric Vehicle Batteries
Structure of the Electric Vehicle Battery Supply Chain
The battery manufacturing supply chain has three main parts: cell manufacturing, module
manufacturing, and pack assembly (figure 1). These three stages can be conducted in the same
place, or broken up into two or (theoretically) three locations. For example, the Automotive
Energy Supply Corporation (AESC) plant in Sunderland, England, produces battery cells and
modules, and assembles packs for the Nissan Leaf.14 However, AESC also sends modules to
Spain, where they are put into packs for electric vans. Tesla produces its own modules and packs
at both its “Gigafactory,” which opened in Nevada in 2017, and at its vehicle assembly plant in
Fremont, California. Tesla’s battery packs for the Model 3 use cells from the Gigafactory, while
cells for the Model S and Model X are produced by Panasonic in Japan.15 Pack assembly tends to
occur near the vehicle assembly location because of the cost of transporting battery packs, which
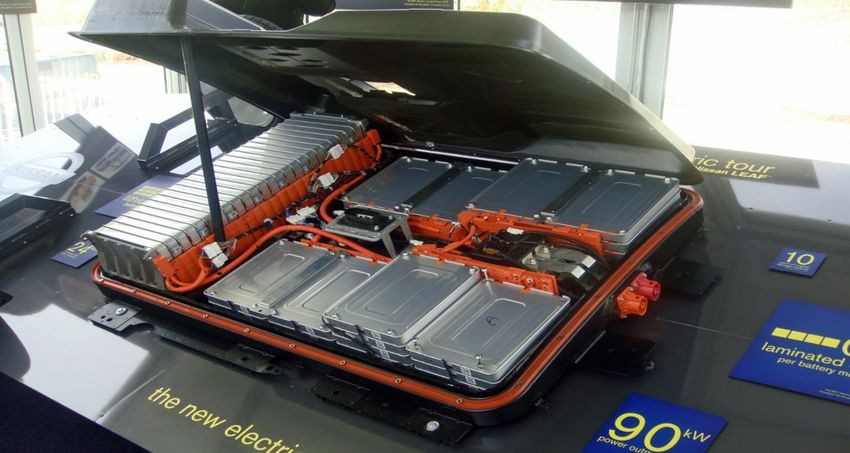
are larger and heavier than cells or modules (figure 2).
Figure 1: The three stages of electric vehicle battery production
Source: Compiled from industry representative, interview with USITC staff, Washington DC, November 14, 2018; industry
representative, telephone interview with USITC staff, June 12, 2018.
14 Gordon-Bloomfield, “How Nissan Makes Its Electric Car Battery Packs,” December 2, 2014.
15 Tesla, “Panasonic and Tesla Sign Agreement for the Gigafactory,” July 30, 2014.
Journal of International Commerce and Economics | 5The Supply Chain for Electric Vehicle Batteries
Figure 2: Alkaline AA battery cell, Tesla lithium-ion battery cell, and Nissan battery modules
and pack
Sources: Wikimedia Commons, “Li-ion-18650-AA-battery,” July 2011, https://commons.wikimedia.org/wiki/File:Liion-18650-
AA-battery.jpg; Meyer, “Battery-pack of the Nissan Leaf,” December 8, 2010, https://commons.wikimedia.org/wiki/File:Battery-
Pack-Leaf.jpg.
Battery Cell Composition and Manufacturing
The smallest, but most important, component of the lithium-ion batteries that power EVs is the
electrochemical cell, which consists of three major parts: a cathode and an anode separated
physically but connected electrically by an electrolyte.16 A battery’s discharge results from the
diffusion of lithium ions from the anode to the cathode through the electrolyte, as shown in
figure 3.
16 Daniel, “Materials and Processing for Lithium-ion Batteries,” September 2008.
Journal of International Commerce and Economics | 6The Supply Chain for Electric Vehicle Batteries
Figure 3: The structure of a lithium-ion battery cell
Source: Daniel, “Materials and Processing for Lithium-ion Batteries,” September 2008.
The anode is typically made of graphite, while the electrolyte typically consists of organic
carbonate solvents with dissolved lithium salts (often lithium hexafluorophosphate, LiPF6). The
anode is physically and electronically isolated from the cathode by a separator, often a thin
porous plastic film through which the liquid electrolyte permeates. The cathode has the most
variation in its different forms.17 Table 2 lists the chemical compositions for a few different
lithium-ion vehicle battery cell cathodes. The relatively low cost of manganese has helped
Nissan keep the cost of its battery down, allowing it to produce one of the least expensive EVs
for the U.S. market. Globally, BYD, based in Shenzhen, China, produces a cheaper lithium-ion
battery, but does not currently sell passenger vehicles in the United States. Based on recent
estimates, about 20 percent of the total cost of a finished lithium-ion battery pack comes from the
cell stage of production.18
Table 2: Cathode component of battery cells in various electric vehicles
Cathode type Car model example Notable differences in cathode composition
Lithium-nickel-cobalt-aluminum oxide (NCA) Tesla models No manganese present
Lithium-manganese oxide (LMO) Nissan Leaf Other than lithium and oxygen, made up
entirely of manganese
Lithium-nickel-manganese-cobalt oxide (NMC) BMW i3 Various compositions which include different
ratios of the four metals, with nickel normally
being the most abundant
Sources: Desjardins, “Here Are the Raw Materials We Need,” October 27, 2016; Lima, “LG Chem Will Introduce NCM 811
Battery Cells,” September 8, 2017.
17 Desjardins, “Here Are the Raw Materials We Need.” October 27, 2016.
18 Argonne National Laboratory, “BatPaC,” June 28, 2018.
Journal of International Commerce and Economics | 7The Supply Chain for Electric Vehicle Batteries
Cells are assembled only as an intermediate good as part of the larger battery assembly process,
for insertion into both EV batteries and batteries for other uses.19 According to Argonne National
Laboratory, cells make up 75 percent of the cost of a battery pack, on average.20 Different cell
producers list slightly different specifications and components in their battery cell assemblies,
but the general ideas remain the same. Tesla uses cylindrical small-format Panasonic 18650 and
2170 battery cells (similar to laptop batteries) to reduce cost, while other vehicle manufacturers
have worked with suppliers to create larger prismatic “automotive-grade” battery cells to reduce
complexity and increase reliability.21
Cells are classified under statistical reporting number 8507.90.8000 (battery parts) of the
Harmonized Tariff System of the United States (HTSUS or HTS).22 Most cells for lithium-ion
batteries in EVs in the United States tend to be imported, but U.S. cell production will increase
as Tesla’s Gigafactory continues to come online.23 Although Japan and South Korea are major
cell manufacturers, 84 percent of lithium-ion cell production will be in the United States or
China by 2020, which would be a 20-percent increase from 2016, based on announced
production expansions in the United States and China.24
Battery Modules
Multiple cells in a case with terminals attached form a module.25 The number of cells per module
varies by manufacturer and cell type. For example, AESC uses four cells in the modules it
produces for battery packs used by the Nissan Leaf, but Samsung SDI puts 12 cells into its
modules.26 Modules feature less value added than cells or pack assembly. Based on recent
estimates, about 11 percent of the total cost of a finished lithium-ion battery pack comes from the
module stage of production.27 Modules can be used in battery packs for different vehicles. For
example, AESC’s Sunderland plant produces modules for Nissan Leafs (for which it assembles
the packs on site) and for Nissan’s compact cargo van, the NV200.28 Battery modules are
classified under the same HTS statistical reporting number as cells (8507.90.8000). However,
since most modules are made in the same facility as the battery pack, there is less trade in this
19 Most battery manufacturers indicate that, for safety reasons, battery cells cannot be sold separately or individually. See
Panasonic, “Overview: Lithium Ion Batteries,” June 2007, for features:
https://industrial.panasonic.com/ww/products/batteries/secondary-batteries/lithium-ion.
20 Argonne National Laboratory, “BatPaC,” June 28, 2018.
21 Deutsche Bank. Lithium 101, May 9, 2016, 19.
22 CBP, “Classification of the Battery Management System,” June 22, 2011.
23 Tesla, “Battery Cell Production Begins at the Gigafactory,” January 4, 2017.
24 Dougher, “Breaking Down the Lithium-ion Cell Manufacturing Supply Chain,” April 23, 2018; Sanderson, Hancock, and
Lewis, “Electric Cars,” March 5, 2017.
25 AESC. “Cell, Module, and Pack for EV Applications” (accessed November 6, 2017).
26 AESC, “Cell, Module, and Pack for EV Applications” (accessed November 6, 2017); Samsung SDI, “The Composition of
EV Batteries: Cells? Modules? Packs?” September 25, 2017.
27 Argonne National Laboratory, “BatPaC,” June 28, 2018.
28 Gordon-Bloomfield, “How Nissan Makes Its Electric Car Battery Packs,” December 2, 2014.
Journal of International Commerce and Economics | 8The Supply Chain for Electric Vehicle Batteries
component of the supply chain. Modules are assembled using cells that were either imported or
produced on site.
Battery Packs
EV battery packs are the final stage of EV battery production. Battery packs consist of battery
modules, electrical connections, and cooling equipment. Manufacturers can assemble them by
hand or by using automated equipment. Based on recent estimates, about 14 percent of the total
cost of a finished lithium-ion battery pack comes from the pack stage of production.29
Battery manufacturers design EV battery packs for specific vehicle models, and tend to assemble
them near the vehicle assembly plant. For example, AESC assembles battery packs in Tennessee
and Sunderland, England relatively close to the plants that assemble Nissan Leafs (figure 4).
Battery packs, unlike cells and modules, are classified in the international Harmonized
Commodity Description and Coding System (HS) under tariff-classification subheading 8507.60,
along with all other lithium-ion batteries.30 The United States has a specific statistical reporting
number for imports of lithium-ion batteries for use in vehicles (HTS 8507.60.0010), but imports
under that classification may also include modules and packs.
Figure 4: Nissan Leaf battery pack
Source: Wikimedia, “Nissan Leaf Battery Pack DC 03 2011 1629.jpg,”
https://commons.wikimedia.org/wiki/File:Nissan_Leaf_battery_pack_DC_03_2011_1629.jpg (accessed December 7, 2017).
29Argonne National Laboratory, “BatPaC,” June 28, 2018.
30HS headings that include six digits, such as this one, are called “HS-6” headings; those with eight digits are “HS-8,” etc.
Classification for battery components is complex and is described in more detail in the “Trade in Batteries” section below.
Journal of International Commerce and Economics | 9The Supply Chain for Electric Vehicle Batteries
Lithium-ion Batteries: Chemistry and Sources of Materials
In addition to lithium, lithium-ion batteries tend to contain aluminum, cobalt, graphite,
manganese, and nickel. Based on recent estimates, more than one-half of the cost of a finished
lithium-ion battery pack is the cost of these materials.31 Among the common materials, lithium,
graphite, and cobalt face supply constraints, while the other metals do not face similar issues.
Aluminum, manganese, and nickel have larger end-use markets outside of lithium-ion batteries.32
On average, cobalt made up about 30 percent of a lithium-ion battery cathode in 2017, but
experts expect cobalt content to decline as batteries become more energy dense.33 Cobalt
supplies are limited and, moreover, are concentrated in only a few countries. The Democratic
Republic of the Congo produced more than one-half of worldwide cobalt mining in 2016,
followed by China and Canada with less than 6 percent each.34 China is also the main source of
cobalt refining, which is necessary before the cobalt is suitable for battery production. Due to
cobalt’s relative scarcity, some predict a 20-percent gap between supply and demand in 2025.35
Cobalt prices increased by 120 percent in 2017; Benchmark Mineral Intelligence’s Caspar
Rawles expects prices to rise at a slower pace in 2018–25 as EV manufacturers use long-term
supply contracts to stabilize prices.36
Graphite is used in the anode of many EVs.37 Benchmark Mineral Intelligence expects that the
market for graphite in battery anodes will increase from 80,000 metric tons in 2015 to 250,000
metric tons in 2020, thereby driving up the price.38 Graphite prices did not increase as rapidly in
2017 as other inputs in EV batteries, but could rise rapidly in future years.39 Nearly two-thirds of
natural graphite is mined in China.40
According to Deutsche Bank, lithium-ion batteries for EVs accounted for 14 percent of lithium
demand in 2015 (and demand has risen since then).41 The bank predicts that EVs will generate
38 percent of lithium demand by 2025.42 Some have predicted a shortfall of 100,000 metric tons
for lithium by 2025.43 This scarcity could drive up the lithium’s price and thus the price of
battery packs. From January 2016 to January 2018, the price of lithium carbonate in South
31 Argonne National Laboratory, “BatPaC,” June 28, 2018. A forthcoming paper by the USITC staff in the Natural Resources
and Energy Division of the Office of Industries, on the global value chain for lithium-ion batteries cell materials trade, will
examine the resources portion of the battery value chain in greater detail.
32 Desjardins, “Here Are the Raw Materials We Need,” October 27, 2016.
33 Lex, “Electric Vehicles: Assault with Battery,” July 26, 2017.
34 Bochove, “The Canadian Ghost Town,” October 31, 2017.
35 Bochove, “The Canadian Ghost Town,” October 31, 2017.
36 Barrera, “Cobalt Outlook 2018,” December 13, 2017.
37 For example, the battery anode of the Tesla Model S has 54 kilograms of graphite. Desjardins, “Here Are the Raw Materials
We Need,” October 27, 2016.
38
Desjardins, “Here Are the Raw Materials We Need,” October 27, 2016.
39 Shaw, “Graphite Outlook 2018,” December 12, 2017.
40 Desjardins, “Here Are the Raw Materials We Need,” October 27, 2016.
41 Deutsche Bank, Lithium 101, May 9, 2016, 23.
42 Deutsche Bank, Lithium 101, May 9, 2016, 23.
43 Jenkins, “Is This the Future of Lithium Mining?” April 1, 2018.
Journal of International Commerce and Economics | 10The Supply Chain for Electric Vehicle Batteries
America (one of the major sources) more than doubled.44 Chile and Argentina are the top two
global exporters of lithium carbonate.45
Battery Manufacturing Competition
Several battery manufacturers assemble battery packs for vehicles sold in the United States.
More vehicles in the United States were sold with Tesla battery packs installed in them than
those of any other battery pack assembler (table 3). While Tesla historically assembled its battery
packs using cells from Japan supplied by Panasonic, its new Gigafactory in Nevada has begun
producing cells in cooperation with Panasonic for use in Tesla vehicles.46 LG Chem batteries
were the second-most common brand of batteries among vehicles sold in the United States in
2017 (table 3). LG Chem assembles packs in Michigan and South Korea for Ford, General
Motors, and Chrysler using Korean or U.S.-made cells, depending on the model.47 AESC has
assembled cells, modules, and packs for the Nissan Leaf and NV200 in Tennessee and
Sunderland, England.48 Samsung SDI produces cells and assembles packs for BMW and
Volkswagen at a plant in Hungary.49 Those packs are then installed in vehicles in Germany.
Bosch assembles batteries in Michigan for Fiats produced in Mexico.50
Table 3: Battery pack assembly and cell production locations for vehicles sold in the United
States
Number of battery packs
Battery pack manufacturer installed in U.S. vehicles, 2017 Pack assembly location Cell production location
Tesla/Panasonic 50,147 United States United States and Japan
LG Chem 26,113 United States United States and South Korea
AESC 11,230 United Statesa United States
Samsung SDI 9,810 Hungary South Korea
Bosch (formerly SB 5,380 United States United States
LiMotive)
SK innovation 2,157 South Korea South Korea
Sources: Ayre, “LG Chem,” February 21, 2017; BMW, “The BMW i3 and All-New BMW i3s” (accessed March 8, 2018);
Bosch, “Bosch Is One-stop Supplier,” June 2013; Burke and Silke Carly, “Tesla's Real Capacity Problem?” June 14, 2017;
Chevrolet, “Bolt EV” (accessed March 8, 2018); EV Sales, “World Top 20,” January 31, 2017; Fiat, “2017 Fiat 500e,” (accessed
March 8, 2018); Ford, “2018 Focus Electric” (accessed March 8, 2018); Herron, “Tesla Motors Battery Suppliers,” September
25, 2015; Kia Motors America, “2018 Soul EV” (accessed March 8, 2018); Lee, “Expansion In European Market,” March 30,
2017; McCarthy, “Tesla Dominates,” August 14, 2017; Nissan, “2018 Nissan Leaf” (accessed March 8, 2018); Pfanner and
Landers, “Nissan Considers Shift,” July 26, 2015; Reuters, “Samsung SDI, Bosch,” November 7, 2010; Tesla, “Model S”
(accessed January 10, 2018); Tesla, “Model S and Model 3 Comparison” (accessed March 8, 2018); Tesla, “Model X, The Best
SUV” (accessed March 8, 2018); Volkswagen, “e-Golf: Give the City a Jolt of Energy” (accessed March 8, 2018).
a While AESC produces cells and packs in Tennessee and Sutherland, this paper assumes that vehicles produced in Tennessee for
the U.S. market use cells and packs produced in Tennessee and not from Sutherland.
44 Sanderson, “Sale of $5bn Lithium Stake,” February 17, 2018.
45 IHS Markit, Global Trade Atlas database (accessed July 25, 2018).
46 Tesla, “Battery Cell Production Begins at the Gigafactory,” January 4, 2017.
47 Ayre, “LG Chem,” February 21, 2017.
48 Pfanner and Landers, “Nissan Considers Shift,” July 26, 2015.
49 Reuters, “Samsung SDI, Bosch,” November 7, 2010.
50 Reuters, “Samsung SDI, Bosch,” November 7, 2010.
Journal of International Commerce and Economics | 11The Supply Chain for Electric Vehicle Batteries
International Trade in Batteries51
Because of the lithium-ion battery’s complex supply chain, international trade data are a
complicated puzzle to understand. Lithium-ion batteries for EVs are categorized in an HS 6-digit
subheading (8507.60) that includes lithium-ion batteries for all uses, with separate statistical
suffixes for batteries for EVs versus all other uses. But different stages of the lithium-ion battery
supply chain seem to be imported under both statistical suffixes, as well as an additional HTS 8-
digit subheading (8507.90.80). This section explores the available trade data.
By value, China (not including Hong Kong) reported the highest amount of imported lithium-ion
batteries from 2013 to 2017, followed by the United States, Hong Kong, and Germany (table 4).
During this period, though, Chinese lithium-ion battery imports declined, possibly owing to
increased Chinese lithium-ion battery production. Moreover, it is difficult to know what portion
of imports under this HS subheading were batteries for EVs versus lithium-ion batteries for some
other purpose, with the HTS subheadings don’t differentiate on an international level.
Table 4: Imports of lithium-ion batteries by country, 2013–17 (million $)
Importer 2013 2014 2015 2016 2017
China 3,314 3,421 3,298 3,055 3,262
United States 1,673 1,691 1,674 1,954 2,527
Germany 684 988 1,314 1,614 2,244
Hong Kong 1,558 1,501 1,629 1,747 2,078
Japan 653 537 633 748 808
Subtotal 7,882 8,138 8,548 9,118 10,919
Other 3,539 4,712 5,132 6,058 7,254
Total 11,421 12,851 13,680 15,176 18,173
Source: IHS Markit, Global Trade Atlas (HS 8507.60; accessed June 4, 2018).
China also exported the most lithium-ion batteries (and components) of every country during
2013–17 (table 5). China’s increased lithium-ion battery exports also suggest increased Chinese
production of lithium-ion batteries, implying that the high volume of its imports may be more
cells and modules (components) than packs (finished products).
Table 5: Exports of lithium-ion batteries by country, 2013–17 (million $)
Exporter 2013 2014 2015 2016 2017
China 4,800 5,475 6,494 6,780 7,987
South Korea 2,265 2,268 2,030 2,328 3,518
Japan 2,052 2,032 2,034 2,615 2,572
Hong Kong 1,480 1,394 1,429 1,512 2,174
United States 660 765 797 1,114 1,289
Subtotal 11,257 11,935 12,784 14,348 17,540
Other 1,963 2,344 2,706 3,130 4,400
Total 13,220 14,279 15,490 17,799 21,940
Source: IHS Markit, Global Trade Atlas (HS 8507.60; accessed June 4, 2018).
51This section discusses trade in lithium-ion batteries for all uses, because there are no globally harmonized EV battery-
specific classifications.
Journal of International Commerce and Economics | 12The Supply Chain for Electric Vehicle Batteries
For U.S.-specific trade data, the picture is somewhat clearer. For imports, the HTSUS breaks out
HS 8507.60 into two 10-digit statistical reporting numbers, 8507.60.0010 and 8507.60.0020, to
separate lithium-ion batteries for EVs from lithium-ion batteries for all other uses. Since only
battery packs are supposed to be classified under 8507.60 as previously discussed, we know that
only U.S. imports of EV battery packs should enter under HTS 8507.60.0010. As mentioned
above, battery cells and modules enter under HTS 8507.90.8000 (battery parts). Figure 5 reports
the leading U.S. import sources for lithium-ion battery components under these three
classifications, and the composition of each.
Figure 5: U.S. Imports of lithium-ion batteries and components, 2017 (million $)
1212
45
110
987
59
440 519
359
12
92 54 64
JAPAN CHINA SOUTH KOREA REST OF WORLD
Li-Ion Batteries for EVs Li-Ion Batteries for Non-EVs Parts of Batteries
Source: USITC, DataWeb (accessed February 13, 2018).
Note: HTS 8507.60.00.10 denotes lithium-ion batteries for use in EVs, HTS 8507.60.00.20 denotes lithium-ion batteries for all
other uses, and HTS 8507.90.80.00 denotes parts of batteries.
Based on these data, the United States appears to import almost all of its battery parts (some of
which are lithium-ion cells and modules) from Japan. It seems to import a high number of
lithium-ion battery components not specifically intended for EVs (some of which may be cells
and/or modules) from China, South Korea, and Japan, and imports relatively few completed EV
battery packs. This supports the table-3 list, which shows that the majority of pack assembly for
U.S.-sold EVs occurs in the United States.
As for U.S. exports, separate subheadings for lithium-ion batteries used in EVs do not exist, but
in some cases, it appears that the trade flow is EV-related. Tesla likely exports batteries (or
modules) to support its EV plant in the Netherlands (opened in 2013), which may be the reason
that the Netherlands is the leading destination for U.S. lithium-ion battery exports (figure 6).52
52 Tesla, “Tesla Motors Opens Assembly Plant in Tilburg, Netherlands,” August 27, 2013.
Journal of International Commerce and Economics | 13The Supply Chain for Electric Vehicle Batteries
Similarly, the Fiat 500e is assembled in Mexico (table 1), so a significant share of exports of
lithium-ion batteries to Mexico likely supports that production. For the limited battery parts that
the United States does export, it is impossible to know what share of these are lithium-ion cells,
and what share are parts of batteries for other uses.
Figure 6: U.S. Exports of lithium-ion batteries and components, 2017 (million $)
41
1
26
384
358
290 10
55
133 52
78
46
NETHERLANDS MEXICO CANADA UNITED KINGDOM JAPAN REST OF WORLD
Li-Ion Batteries Parts of Batteries
Source: USITC, DataWeb (accessed February 13, 2018).
Note: HTS 8507.60 denotes lithium-ion batteries and HTS 8507.90.80.00 denotes parts of batteries.
Electric Vehicle Battery Value Chain Estimation
This section estimates the value that has been added at the country level for the manufacture of
EV batteries used in EVs sold in the United States. The authors rely on company-specific
information, because the trade data do not offer enough specificity, as detailed earlier. Instead,
the authors used publicly available company-specific data, as well as estimated values for the
two most important stages of EV battery production. The data collected included U.S. 2017 EV
sales by model, the size of the battery in the EV, the battery pack assembly location, and the cell
manufacturing location (table 6). Combining this information with information on the U.S. dollar
cost per kWh in battery packs allowed the authors to estimate battery value-added by country.
Journal of International Commerce and Economics | 14The Supply Chain for Electric Vehicle Batteries
Table 6: Data used to estimate value added by country for the manufacture of batteries used in
electric vehicles sold in the United States
2017 unit Battery Battery pack Cell Battery cost Total value added
Vehicle model sales size assembly manufacturing per vehicle ($) ($)d
Tesla Model S 27,060 75.0 United States Japan 14,250 a 6,413
Tesla Model 3 1,772 50.0 United States United States 9,500 a 4,275
Tesla Model X 21,315 75.0 United States Japan 14,250 a 6,413
Ford Focus Electric 1,817 33.5 United States United States 7,002 b 3,151
Chevy Bolt 23,297 60.0 United States South Korea 12,500 c 5,625
Fiat 500e 5,380 24.0 United States United States 5,016 b 2,257
VW e-Golf 3,534 35.8 Hungary South Korea 7,482 b 3,367
BMW i3 6,276 22.0 Hungary South Korea 4,598 b 2,069
Nissan Leaf 11,230 26.0 United States United States 5,434 b 2,445
Kia Soul EV 2,157 27.0 South Korea South Korea 5,643 b 2,539
Sources: Field, “UBS Analyst Dubs Model 3 Unprofitable, Tesla Responds with Battery Pricing,” April 27, 2016; Zart, “Batteries
Keep Getting Cheaper,” December 11, 2017; EV Sales, “World Top 20,” January 31, 2017; Argonne National Laboratory,
“BatPaC,” June 28, 2018.
a Authors’ calculations based on $190 per kWh from reports of the cost for Tesla battery packs.
b Authors’ calculations based on $209 per kWh, which was the average price in 2017 according to a Bloomberg report.
c Authors’ calculations based on $12,500 for the price of the pack, as reported in a UBS breakdown.
d Total value added is the cost of the battery less the cost of materials.
Combining this data with BatPaC cost estimate data from the Argonne National Laboratory, the
authors estimate that 57 percent of the total value added53 of batteries used in EVs sold in the
United States originates in the United States (26 percent of total cost, which includes raw
materials), followed by Japan (12 percent of value added) (figure 7). Manufacturers assemble 7
of the 10 battery packs in the United States, and of those 7, 4 also use cells manufactured in the
United States.
Figure 7: Total value added for batteries in U.S. electric vehicles by country, 2017 (million $)
298
138
75
14
UNITED STATES JAPAN SOUTH KOREA HUNGARY
Source: Authors’ estimates based on data from table 1 and table 7 above.
Note: Total value added is the cost of the battery less the cost of materials.
53 Total value-added is the cost of the battery less the cost of materials.
Journal of International Commerce and Economics | 15The Supply Chain for Electric Vehicle Batteries
Conclusions
It is possible that some other battery type that packs more energy per pound will be developed in
the future, but until then, lithium-ion batteries will be the most important part of an EV. As EVs
take an increasing share of motor vehicle sales, the battery supply chain will become
increasingly important. Understanding the supply chain can help businesses and governments
understand how trade flows and resources will be affected by increased demand for EVs and
thus, their inputs.
China and the United States appear to be the largest suppliers of lithium-ion battery cells in the
future, with competition from Japan and South Korea.54 Moreover, since cells are more easily
imported/exported longer distances, they are likely to continue to be internationally traded.
Conversely, due to the higher cost of transporting battery packs, international trade in EV battery
packs is likely to remain low compared to trade in battery cells. Vehicle manufacturers’
decisions about where to produce EVs (and in what quantities) are likely to be the primary
determinants in lithium-ion battery module and pack production locations.
Due mostly to the lack of more detailed international trade data for lithium-ion batteries, it is
challenging to separate out information from components of the battery supply chain. However,
based on the authors’ estimates, the United States and Japan appear to provide the most value-
added to lithium-ion batteries used in EVs sold in the United States. Much of the estimated U.S.
value comes from pack assembly. Based on this research, due to China’s high level of sales of
domestically produced EVs with domestically produced batteries and cells, China likely accounts
for the vast majority of the value added from lithium-ion batteries in Chinese EV sales and is
likely the world leader in value added for EV batteries.
54 Dougher,“Breaking Down the Lithium-ion Cell Manufacturing Supply Chain,” April 23, 2018; Sanderson, Hancock, and
Lewis, “Electric Cars,” March 5, 2017.
Journal of International Commerce and Economics | 16The Supply Chain for Electric Vehicle Batteries
Bibliography
Argonne National Laboratory. “BatPaC.” Version 3.1, June 28, 2018.
http://www.cse.anl.gov/batpac/.
Automotive Energy Supply Corporation (AESC). “Cell, Module, and Pack for EV Applications.”
http://www.eco-aesc-lb.com/en/product/liion_ev/ (accessed November 6, 2017).
Ayre, James. “LG Chem to Expand Battery Cell Manufacturing in the U.S. and China.” Clean
Technica, February 21, 2017. https://cleantechnica.com/2017/02/21/lg-chem-expand-
battery-cell-manufacturing-us-china/.
Barrera, Priscila. “Cobalt Outlook 2018: Another Strong Year Ahead?” Investing News,
December 13, 2017. https://investingnews.com/daily/resource-investing/critical-metals-
investing/cobalt-investing/cobalt-outlook/.
Battery University. “BU-205: Types of Lithium-ion.”
http://batteryuniversity.com/learn/article/types_of_lithium_ion (accessed January 10,
2018).
Battery University. “BU-1003: Electric Vehicles (EV).”
http://batteryuniversity.com/learn/article/electric_vehicle_ev (accessed January 10,
2018).
Bloomberg New Energy Finance. “Electric Vehicle Outlook 2018,” 2018.
https://about.bnef.com/electric-vehicle-outlook/.
BMW Company Web Site. “The BMW i3 and All-New BMW i3s.”
https://www.bmwusa.com/vehicles/bmwi/i3/sedan/overview.html. (accessed March 8,
2018).
Bochove, Danielle. “The Canadian Ghost Town That Tesla Is Bringing Back to Life.”
Bloomberg, October 31, 2017. https://www.bloomberg.com/news/features/2017-10-
31/the-canadian-ghost-town-that-tesla-is-bringing-back-to-life.
Bosch. “Bosch Is One-stop Supplier for Electric Drives.” Press release, June 2013.
http://www.bosch.co.jp/en/press/group-1306-08.asp.
Burke, Emily, and Sharon Silke Carly. “Tesla's Real Capacity Problem? Too Many Employees.”
Autoweek, June 14, 2017. http://autoweek.com/article/green-cars/teslas-fremont-plant-
doesnt-have-enough-parking-employees-because-plant-so.
Chevrolet Company Website. “Bolt EV.” https://www.chevrolet.com/electric/bolt-ev-electric-
car. (accessed March 8, 2018).
Curry, Claire. “Lithium-ion Battery Costs and Market.” Bloomberg New Energy Finance, July 5,
2017. https://data.bloomberglp.com/bnef/sites/14/2017/07/BNEF-Lithium-ion-battery-
costs-and-market.pdf.
Journal of International Commerce and Economics | 17The Supply Chain for Electric Vehicle Batteries
Daniel, Claus. “Materials and Processing for Lithium-ion Batteries.” Member Journal of the
Minerals, Metals & Materials Society, September 2008, 43–48.
http://www.tms.org/pubs/journals/JOM/0809/daniel-0809.html.
Desjardins, Jeff. “Here Are the Raw Materials We Need to Fuel the Electric Car Boom.”
Business Insider, October 27, 2016. http://www.businessinsider.com/materials-needed-to-
fuel-electric-car-boom-2016-10.
Deutsche Bank. Lithium 101. Deutsche Bank Market Research industry report, May 9, 2016.
https://www.slideshare.net/Tehama/welcome-to-the-lithium-ion-age-lithium-101-
deutsche-bank-may-9-2016?qid=7df4664f-129c-4871-a63a-
cdcbd7145b9f&v=&b=&from_search=1.
Dougher, Timothy. “Breaking Down the Lithium-ion Cell Manufacturing Supply Chain.”
Master’s Thesis (Duke University), April 23, 2018.
https://dukespace.lib.duke.edu/dspace/bitstream/handle/10161/16600/US%20Lithium%2
0Ion%20Cell%20Manufacturing%20Supply%20Chain.pdf?sequence=1.
Ewing, Jack. “What Needs to Happen Before Electric Cars Take Over the World.” New York
Times, December 18, 2017. https://www.nytimes.com/2017/12/18/business/electric-car-
adoption.html.
EV Sales (blog). “World Top 20 December 2016,” January 31, 2017. http://ev-
sales.blogspot.com/2017/01/world-top-20-december-2016.html.
Fiat. “2017 Fiat 500e Overview.” https://www.fiatusa.com/500e.html (accessed March 8, 2018).
Field, Kyle. “UBS Analyst Dubs Model 3 Unprofitable, Tesla Responds with Battery Pricing.”
Clean Technica, April 27, 2016. https://cleantechnica.com/2016/04/27/tesla-model-3-
pricing-battery-pricing-unveiled/.
Ford Motor Co. (Ford) Website. “2018 Focus Electric.”
https://www.ford.com/cars/focus/models/focus-electric/. (accessed March 8, 2018).
Gordon-Bloomfield, Nikki. “How Nissan Makes Its Electric Car Battery Packs, Part One of
Three: On Being Super-Clean.” Transport Evolved, December 2, 2014.
https://transportevolved.com/2014/12/02/nissan-makes-electric-car-battery-packs-part-
one-three-super-clean/.
Herron, David. “Tesla Motors Battery Suppliers—Gigafactory and Friends.” Long Tail Pipe
(blog), September 25, 2015. https://longtailpipe.com/document/tesla-motors-battery-
suppliers-gigafactory-and-friends/.
IHS Markit. Global Trade Atlas database. https://www.gtis.com/annual/secure/default.cfm
(accessed various dates).
International Energy Agency (IEA). Global EV Outlook 2017: Two Million and Counting.
OECD/IEA report, 2017.
https://www.iea.org/publications/freepublications/publication/GlobalEVOutlook2017.pdf
Journal of International Commerce and Economics | 18The Supply Chain for Electric Vehicle Batteries
International Energy Agency (IEA). Global EV Outlook 2018: Towards Cross-Modal
Electrification. OECD/IEA report, May 30, 2018. https://webstore.iea.org/global-ev-
outlook-2018.
International Organization of Automobile Manufacturers (OICA). 2017 Production Statistics.
http://www.oica.net/category/production-statistics/2017-statistics/.
Jenkins, “Is This the Future of Lithium Mining?” Yahoo Finance, April 1, 2018.
https://finance.yahoo.com/news/future-lithium-mining-233000085.html
Kia Motors America Company Website. “2018 Soul EV.”
https://www.kia.com/us/en/vehicle/soul-ev/2018. (accessed March 8, 2018).
Lee, Song-hoon. “Expansion in European Market.” Business Korea, March 30, 2017.
http://www.businesskorea.co.kr/english/news/industry/17674-expansion-european-
market-volkswagens-new-e-golf-be-loaded-samsung-sdi-batteries.
Lex. “Electric Vehicles: Assault with Battery.” Financial Times, July 26, 2017.
https://www.ft.com/content/c40f777e-7217-11e7-aca6-c6bd07df1a3c.
Lima, Pedro. “LG Chem Will Introduce NCM 811 Battery Cells for EVs Next Year.” Push EVs
(blog), September 8, 2017. https://pushevs.com/2017/09/08/lg-chem-will-introduce-ncm-
811-battery-cells-evs-next-year/.
McCarthy, Niall. “Tesla Dominates the U.S. Electric Vehicle Market.” Forbes, August 14, 2017.
https://www.forbes.com/sites/niallmccarthy/2017/08/14/tesla-dominates-the-u-s-electric-
vehicle-market-infographic/#4a6cdb3f7be4.
McKinsey & Company. Electrifying Insights: How Automakers Can Drive Electrified Vehicle
Sales and Profitability, January 2017. https://www.mckinsey.com/industries/automotive-
and-assembly/our-insights/electrifying-insights-how-automakers-can-drive-electrified-
vehicle-sales-and-profitability.
Morning Consult. “How Real People View the Future of Mobility.” Slide presentation,
Autonomous Vehicles 2050 conference, January 24, 2018.
https://morningconsult.com/wp-content/uploads/2018/01/Morning-Consult-Future-of-
Mobility.pdf.
Nissan Motor Co. (Nissan) Website “2018 Nissan Leaf.”
https://www.nissanusa.com/vehicles/electric-cars/leaf.html. (accessed March 8, 2018).
Pfanner, Eric, and Peter Landers. “Nissan Considers Shift to LG Chem Batteries.” Wall Street
Journal, July 26, 2015. https://www.wsj.com/articles/nissan-to-consider-lg-batteries-for-
electric-cars-1437052009?mod=e2fb.
Reuters. “Samsung SDI, Bosch Win EV Battery Deal from Chrysler,” November 7, 2010.
https://www.reuters.com/article/us-samsungsdi-order/samsung-sdi-bosch-win-ev-battery-
deal-from-chrysler-idUSTRE6A62U420101107.
Journal of International Commerce and Economics | 19The Supply Chain for Electric Vehicle Batteries
Samsung SDI. “The Composition of EV Batteries: Cells? Modules? Packs? Let’s Understand
Properly!” September 25, 2017.
http://www.samsungsdi.com/column/technology/detail/54344.html?listType=gallery.
Sanderson, Henry. “Sale of $5bn Lithium Stake to Test Electric Car Hype.” Financial Times,
February 17, 2018. https://www.ft.com/content/609adb06-0a61-11e8-8eb7-
42f857ea9f09.
Sanderson, Henry, Tom Hancock, and Leo Lewis. “Electric Cars: China’s Battle for the Battery
Market.” Financial Times, March 5, 2017. https://www.ft.com/content/8c94a2f6-fdcd-
11e6-8d8e-a5e3738f9ae4.
Shaw, Melissa. “Graphite Outlook 2018: Market Expected to Tighten.” Investing News,
December 12, 2017. https://investingnews.com/daily/resource-investing/critical-metals-
investing/graphite-investing/graphite-outlook/.
Soulopolous, Nikolas. “When Will Electric Vehicles Be Cheaper than Conventional Vehicles?”
Bloomberg New Energy Finance, April 12, 2017.
http://www.automotivebusiness.com.br/abinteligencia/pdf/EV-Price-Parity-Report.pdf/.
Tesla Corp. “Battery Cell Production Begins at the Gigafactory.” Tesla (blog), January 4, 2017.
https://www.tesla.com/blog/battery-cell-production-begins-gigafactory.
Tesla Corp. “Panasonic and Tesla Sign Agreement for the Gigafactory.” Tesla (blog), July 30,
2014. https://www.tesla.com/blog/panasonic-and-tesla-sign-agreement-gigafactory.
Tesla Corp. “Model S Specifications.” https://www.tesla.com/support/model-s-specifications
(accessed January 10, 2018).
Tesla Corp. “Model S and Model 3 Comparison.” https://www.tesla.com/compare. (accessed
March 8, 2018).
Tesla Corp. “Model X, The Best SUV.” https://www.tesla.com/modelx. (accessed March 8,
2018).
Tesla Corp. “Tesla Motors Opens Assembly Plant in Tilburg, Netherlands.” Tesla (blog), August
27, 2013. https://www.tesla.com/blog/tesla-motors-opens-assembly-plant-tilburg-
netherlands.
U.S. Customs and Border Protection (CBP). “Classification of the Battery Management System
and Its Lithium-Ion Cells; Eligibility for the North American Free Trade Agreement Duty
Preference for the Battery Management System; General Note 12, HTSUS.” Customs
Rulings Online Search System, June 22, 2011.
https://www.customsmobile.com/rulings/docview?doc_id=HQ+H155376.
U.S. International Trade Commission (USITC). DataWeb. https://dataweb.usitc.gov/ (accessed
February 13, 2018).
Journal of International Commerce and Economics | 20The Supply Chain for Electric Vehicle Batteries
Volkswagen. “e-Golf: Give the City a Jolt.” https://media.vw.com/models/e-golf. (accessed
March 8, 2018).
Voelcker, John. “Nissan Leaf $5,500 Battery Replacement Loses Money.” Green Car Reports,
July 24, 2014. https://www.greencarreports.com/news/1093463_nissan-leaf-5500-
battery-replacement-loses-money-company-admits.
Yamauchi, Mia. “Tesla Charging: The Complete Guide to Charging at Home, in Public, and
Autonomously.” Plugless Power (Evatran). https://www.pluglesspower.com/learn/tesla-
model-s-charging-home-public-autonomously/ (accessed October 1, 2018).
Zart, Nicolas. “Batteries Keep Getting Cheaper.” Clean Technica, December 11, 2017.
https://cleantechnica.com/2017/12/11/batteries-keep-getting-cheaper/.
Journal of International Commerce and Economics | 21You can also read