Report 25: Response to COVID-19 in South Korea and implications for lifting stringent interventions
←
→
Page content transcription
If your browser does not render page correctly, please read the page content below
29 May 2020 Imperial College COVID-19 response team

Report 25: Response to COVID-19 in South Korea and implications for
lifting stringent interventions
Amy Dighe1*, Lorenzo Cattarino1*, Gina Cuomo-Dannenburg1*, Janetta Skarp1*, Natsuko Imai1*, Sangeeta
Bhatia1, Katy A. M. Gaythorpe1, Kylie E. C. Ainslie1, Marc Baguelin1, Samir Bhatt1, Adhiratha Boonyasiri2,
Olivia Boyd1, Nicholas F. Brazeau1, Giovanni Charles1 , Laura V. Cooper1, Helen Coupland1, Zulma Cucunuba1,
Bimandra A. Djaafara1, Ilaria Dorigatti1, Oliver D. Eales1, Jeff Eaton1, Sabine L. van Elsand1, Fabricia Ferreira
Do Nascimento1, Richard G. FitzJohn1, Seth Flaxman3, Lily Geidelberg1, William D. Green1, Timothy Hallet1,
Arran Hamlet1, Katharina Hauck1, David Haw1, Wes Hinsley1, Ben Jeffery1, Edward Knock1, Daniel J Laydon1,
John A. Lees1, Thomas Mellan1, Swapnil Mishra1, Gemma Nedjati-Gilani1, Pierre Nouvellet1,4, Lucy C. Okell1,
Kris V. Parag1, Margarita Pons-Salort1, Manon Ragonnet-Cronin1, Hayley A. Thompson1, H. Juliette T.
Unwin1, Robert Verity1, Michaela A. C. Vollmer1, Erik Volz1, Patrick G. T. Walker1, Caroline E. Walters1, Oliver
J. Watson5, 1, Charles Whittaker1, Lilith K. Whittles1, Xiaoyue Xi3, Azra C. Ghani1, Christl A. Donnelly1,6, Neil
M. Ferguson1, Steven Riley1.

1. WHO Collaborating Centre for Infectious Disease Modelling
 MRC Centre for Global Infectious Disease Analysis
 Abdul Latif Jameel Institute for Disease and Emergency Analytics (J-IDEA)
 Imperial College London, London, UK
2. NIHR Health Protection Research Unit in Healthcare Associated Infections and Antimicrobial
 Resistance, Imperial College London, UK
3. Department of Mathematics, Imperial College London, London, UK
4. School of Life Sciences, University of Sussex, Brighton, UK
5. Department of Laboratory Medicine and Pathology, Brown University, Providence, RI, USA
6. Department of Statistics, University of Oxford, Oxford, UK

*contributed equally

Correspondence: s.riley@imperial.ac.uk; neil.ferguson@imperial.ac.uk

SUGGESTED CITATION
Amy Dighe, Lorenzo Cattarino, Gina Cuomo-Dannenburg et al. Response to COVID-19 in South Korea and
implications for lifting stringent interventions. Imperial College London (29-05-2020). doi:
https://doi.org/10.25561/79388.

 This work is licensed under a Creative Commons Attribution-NonCommercial-NoDerivatives 4.0
 International License.

DOI: https://doi.org/10.25561/79388 Page 1 of 16
29 May 2020 Imperial College COVID-19 response team

Summary
While South Korea experienced a sharp growth in COVID-19 cases early in the global pandemic, it has
since rapidly reduced rates of infection and now maintains low numbers of daily new cases. Despite
using less stringent “lockdown” measures than other affected countries, strong social distancing
measures have been advised in high incidence areas and a 38% national decrease in movement
occurred voluntarily between February 24th - March 1st. Suspected and confirmed cases were isolated
quickly even during the rapid expansion of the epidemic and identification of the Shincheonji cluster.
South Korea swiftly scaled up testing capacity and was able to maintain case-based interventions
throughout. However, individual case-based contact tracing, not associated with a specific cluster, was
a relatively minor aspect of their control program, with cluster investigations accounting for a far
higher proportion of cases: the underlying epidemic was driven by a series of linked clusters, with 48%
of all cases in the Shincheonji cluster and 20% in other clusters. Case-based contacts currently account
for only 11% of total cases. The high volume of testing and low number of deaths suggests that South
Korea experienced a small epidemic of infections relative to other countries. Therefore, caution is
needed in attempting to duplicate the South Korean response in settings with larger more generalized
epidemics. Finding, testing and isolating cases that are linked to clusters may be more difficult in such
settings.

1. Introduction
Coronavirus disease 2019 (COVID-19) has become a major global pandemic with 5,656,615 cases and
355,355 deaths reported as of May 28th 2020 [1]. One of the first countries to be affected by the COVID-
19 pandemic was South Korea, where the first confirmed case was reported on January 20th 2020,
detected at Incheon international airport [2]. Sporadic cases were reported up to February 20th, all
with travel histories to mainland China, in line with the testing protocol during that period. After the
identification of the Shincheonji cluster of local transmission in Daegu on February 18th, testing was
expanded to all suspected cases including individuals with no travel history [3]. Case incidence peaked
on February 29th, shortly after Daegu was placed in a two-week quarantine [4] (Figure 1A and Table
S1). Daily incidence has since generally been declining, with the decline starting approximately three
weeks before stricter social distancing measures (including stay-at-home recommendations and
restriction of non-essential retail) were implemented nationally [5]. As of May 11th, South Korea has
reported a total of 10,909 cases with 35 new cases in the last day. The pattern of COVID-19 deaths in
South Korea has not followed the same clear epidemic pattern as cases (Figure 1B), with a total of only
256 deaths up to and including May 11th, distributed throughout the period since February 20th with
a peak, by date of report, of only 9 deaths per day.

Despite a rapid growth of cases early in the global timescale, South Korea has brought the transmission
of SARS-CoV-2 under control with less stringent national social distancing policies relative to countries
such as Italy, France, and the UK [6]. This has led to substantial interest in their “test, trace, isolate”
strategy, as other countries plan to, or have started to relax their “lockdowns” and transition to more
sustainable packages of interventions. However, it is important to understand the epidemiological
peculiarities of the South Korea outbreak and characterise their effective response package before
trying to apply these measures to other settings. For instance, it is unclear how much the “test, trace,
isolate” strategy on its own was responsible for successfully controlling the outbreak relative to other
measures such as social distancing and regional quarantine.

DOI: https://doi.org/10.25561/79388 Page 2 of 16
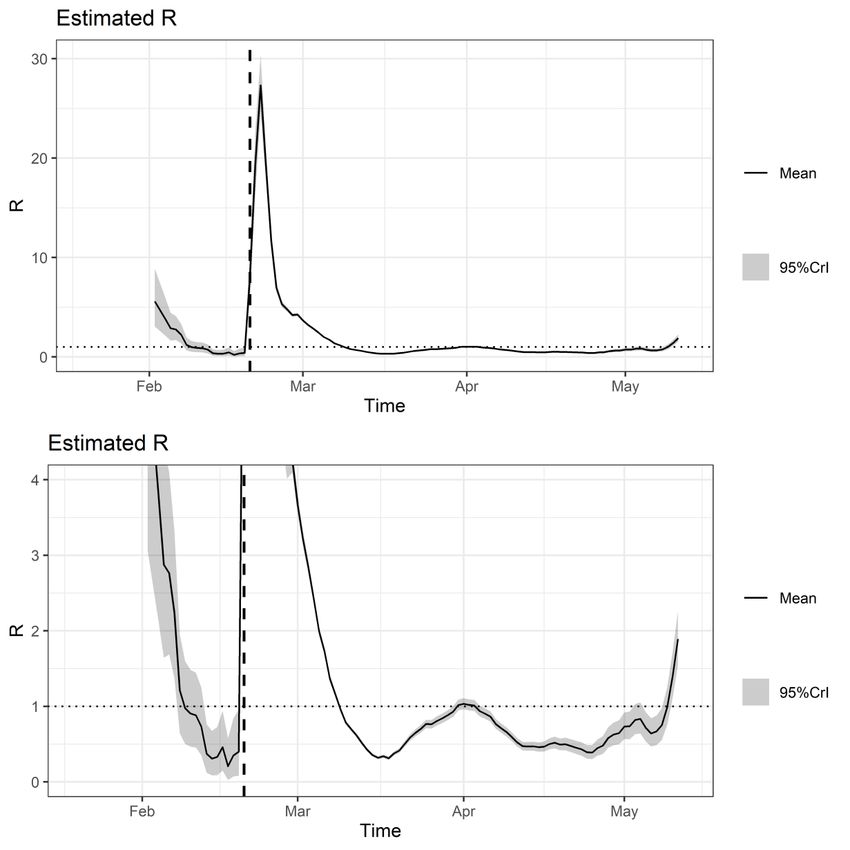
29 May 2020 Imperial College COVID-19 response team

We conducted a quantitative review of South Korea’s interventions in response to the COVID-19
epidemic to draw insights into the different components of the response. We characterized temporal
trends in i) transmission, by estimating the time-varying reproduction number R; ii) testing capacity;
iii) case origins and how they were identified and iv) case isolation. We then discuss possible
implications for other countries’ strategies for lifting stringent social distancing interventions. As of
May 28th, a total of 11,344 cases have been reported with 79 new confirmed cases in the last 24 hours
resulting in implementation of localised measures in Seoul [7]. This recent increase in cases in not
considered in our analysis here.

2. Results
Transmission

Our estimates of SARS-CoV-2 transmissibility in South Korea vary substantially over time (Figure 2). We
estimated the time-varying reproduction number R for cases, using previously published methods [8].
Using a 7-day sliding window and confirmed cases by date of report, we estimated that R initially
dropped below 1 as travel-related cases were only imported sporadically [9]. Estimates of R increased
significantly after the identification of the large Shincheonji cluster and the changes in testing protocol
on February 18th and 20th 2020, respectively [10,11]. Following this substantial increase in testing and
local transmission we estimated a very high R of 27.3 (95% Cri; 24.4 - 30.4 with prior distributions on
R with mean = 1, standard deviation = 10). However, this estimate is biased upwards as the method
assumes constant reporting over time, and the relative contributions to R from increased testing and
increased transmission cannot be disentangled. Following the changes in testing, estimates are likely
reliable again from the beginning of March. Despite consistently high levels of testing from this point
(Figure 3), R was still estimated to be above 3. However, it dropped to a low of 0.4 in mid-March before
increasing to 1 at the start of April. During April, the estimate of R continued to decline to ~0.5 until
the recent cluster of cases from the Itaewon nightclubs which has pushed it back above 1 (Figure 2).

Social distancing

Unlike other countries affected by COVID-19, South Korea has not implemented a national “lockdown”.
However, a localised lockdown of Daegu occurred after the large cluster of cases associated with
Shincheonji religious group was reported [12] (Figure 1A). Movement in Daegu decreased by 80%
during this period as compared to the same time in 2019, and decreased nationally by 38% during
February 24th - March 1st as compared to January 9th - 22nd before the first case had been detected in
South Korea [13,14]. Schools have remained closed since the February 23rd nationally, and the country
has transitioned to remote learning [15]. On March 22nd, in response to the ongoing emergence of
local small clusters, imported cases, and an increase in population movement up to 28% below baseline
[13], the Korean government implemented a stronger social distancing campaign nationally (Figure
1A). People were asked to leave their houses only for daily necessities, healthcare and commuting to
work, and many community spaces were asked to close [16]. On April 19th low-contact outdoor
facilities and churches were allowed to reopen. From May 6th South Korea has transitioned again with
the intention of establishing long-term routine distancing with exact details to be decided by individual
departments [17,18]. Sustaining the routine distancing policy depends on low daily case numbers, very
low incidence of detecting apparently sporadic cases and >80% of new cases being detected in

DOI: https://doi.org/10.25561/79388 Page 3 of 16
29 May 2020 Imperial College COVID-19 response team

individuals who are already in self-quarantine. These conditions were being met until the recent
increase in cases reported on May 28th [7]. Social distancing measures are re-evaluated every two
weeks [16].

Testing

South Korea has a population of 51 million [20]. By licensing private companies and clinics to conduct
tests early in the epidemic South Korea rapidly expanded testing capacity from 3000/day on February
7th [5] to 15,000 - 20,000/day with a turnaround time of 6 – 24 hours by the end of March (Figure 3).
As of March 25th, there were 118 institutions capable of conducting tests for COVID-19 including:
Korea Centers for Disease Control and Prevention (KCDC), 4 National Quarantine Stations, 18 Research
Institutes of Public Health and Environment (RIPHEs), and 95 private medical laboratories and hospitals
[3]. Initially, only individuals who were symptomatic and had a history of travelling in areas with known
infections or had been in contact with confirmed cases were tested (Table S2) [21]. However, testing
policy changed on February 20th to test anyone exhibiting symptoms, regardless of travel history, and
to all close contacts of confirmed cases [22]. This coincided with the Shincheonji cluster and explosive
growth in cases, reducing the average number of tests conducted per case. Mass testing has also been
used in high-risk facilities such as hospitals, care homes, and other social care institutions in high
incidence areas since March 18th. In Daegu, a total of 33,610 high-risk individuals have been tested
with 322 testing positive as of April 4th [17]. As case numbers decreased, the average tests per case
increased again until the mid-May increase in cases, which resulted in another reduction in the number
of average tests per case (Figure 4). We are unable to infer the delay from symptom onset to testing
from our data set collated from the KCDC daily press releases. A study of the first 28 patients (identified
from January 20th to February 10th) estimated the mean delay from symptom onset to diagnosis to
be 5.2 days (range: 0-16 days) [23]. We did not find data on delays to testing later in the outbreak.

Clusters and contact tracing

A high proportion of cases have been epidemiologically linked throughout the outbreak. Case-based
contact tracing in South Korea can be separated into: i) cluster investigation which utilises targeted
mass testing of hospitals and communities; and ii) identification and follow-up of individual cases and
their contacts (see Supplementary Material for more detailed protocol) [24–26]. Clusters now account
for 68% of South Korea’s COVID-19 cumulative cases nationally, while individual case-based contacts
account for only 11% (Figure 5A). The large cluster associated with the Shincheonji religious group,
accounts for 48% of all cases nationally. Although most cases were in Daegu, the cluster extended to
group members in Gyeongbuk, Gyeongnam, Ganwon, Ulsan and Gwangju provinces (see Figure S1 for
a regional breakdown of case type by epidemiological link or origin). Other smaller clusters mainly in
workplaces, hospitals and churches, make up the further 20% of cases (ranging in size from 2-196
people). Most clusters of >100 cases occurred in hospitals, where mass testing protocols were in place.
For example, 2,368 caregivers from 61 hospital-grade healthcare institutions were tested in Daegu in
mid-March [27]. Later in the epidemic, between March 25th and May 11th, the Shincheonji cluster
contributed very few new cases. During that period the relative contribution of local transmission to
new cases steadily decreased until 82% of new cases in the two weeks prior to the May 8th were
imported, however the Itaewon nightclub cluster [28] brought the relative contribution of local
clusters back up to 40% of new cases reported in the fortnight ending on the 11th of May (Figure 5B).

DOI: https://doi.org/10.25561/79388 Page 4 of 16
29 May 2020 Imperial College COVID-19 response team

Isolation

Isolation of cases and self-quarantine of contacts has been a consistent feature of the South Korean
response. As of May 11th, there were 1,021 confirmed cases currently isolated (Figure 6). Although we
were not able to identify openly accessible data sources that reported the number of contacts isolated
over the course of the outbreak, media outlets reported that approximately 30,000 people were in
self-quarantine on March 6th [29], 27,000 on April 2nd [30] and 46,000 on April 7th [31]. Based on
severity and risk factors, confirmed cases were either isolated in a hospital (1 room per patient or
cohort isolation), at home, or in a Residential Treatment Centre (RTC). Cases were isolated in hospital
in their own rooms or cohorted (grouping patients with the same characteristics in the same ward)
depending on the clinical characteristics of the confirmed case, and the characteristics of the available
isolation space such as ventilation and structural barriers between patients. Cases were isolated in
RTCs when symptoms were too severe for home isolation, but did not require hospitalisation, when
home isolation was not possible because no individual room was available or because they live with a
high-risk person in the household [32]. Medical staff in RTCs and public health managers (for home
isolation) monitored and recorded the patient’s symptoms twice per day and, if necessary, transferred
them to medical facilities. Close contacts of confirmed cases were asked to self-quarantine for 14 days
and were monitored every day.

We were unable to estimate the delay to isolation of a confirmed case from the KCDC press release
data. Another study, which fitted gamma distributions to case data of 211 confirmed cases, estimated
the mean delay from symptom onset to isolation of cases as 4.3 days, before the red alert warning on
February 23rd and 3.3 days after [33]. The same study estimated the mean delay from exposure to
isolation as 7.2 days before the red alert, and 6.5 days after.

Confirmed cases were required to test negative twice in 24 hours before release from isolation [32].
Close contacts with no symptoms in the 14 days following contact were released from home
quarantine after testing negative at the end of the quarantine period.

3. Discussion

This analysis of South Korea’s response to COVID-19 highlights how, despite South Korea experiencing
a sharp growth in cases early in the global pandemic, transmission was rapidly controlled, resulting in
a relatively small epidemic made up of large linked clusters. As of May 11th, a total 10,909 cases and
256 deaths have been reported since the first case on January 20th [2]. South Korea’s epidemic is
characterised by large clusters of cases, particularly the Shincheonji religious group which accounted
for 48% of cases. The rapid expansion of test capacity, early localised lockdown of Daegu, voluntary
social distancing, and continued case-based contact tracing across the large clusters have all likely
contributed to help contain South Korea’s epidemic.

South Korea have not implemented a national lockdown during their COVID-19 outbreak, Instead their
comprehensive approach ranges from case-based testing and isolation, investigation of large clusters
of confirmed cases, and targeted lockdowns in the most heavily affected provinces. Early identification
and management of cases, clusters, and contacts has been a key strategy of the South Korea response.
Combined with the expanded testing capacity and the use of pooled or mass testing in high-risk

DOI: https://doi.org/10.25561/79388 Page 5 of 16
29 May 2020 Imperial College COVID-19 response team

facilities and clusters has allowed the majority of new cases to be traced back to existing clusters
(Figure 5), such as the Shincheonji religious group, the Seoul/Guro Gu call centre, hospital/healthcare
institutions in Daegu, and the Itaewon nightclub.

There are several limitations to this analysis. South Korea’s response was characterized by multiple
measures including rapid large-scale testing, and social distancing measures, and we did not find
enough evidence to attribute the success in controlling the COVID-19 outbreak to one particular aspect
of their response. When estimating time-varying R, we assumed constant reporting, which does not
hold for the South Korea dataset. A dynamic transmission model could help disentangle the relative
contribution of different measures and account for changes in reporting. Through a non-systematic
review of the published literature and a systematic review of governmental sources (KCDC, Ministry of
Health and Welfare and Ministry of Education), we were able to identify important data gaps. The
national-level dataset we collated did not contain information on how many contacts each individual
case had (and the proportion who tested positive), though data on the total number of contacts per
confirmed case were available for some municipalities [33,34]. Furthermore, we could not estimate a
delay from confirmation of test result to isolation of cases or their contacts from our dataset, as only
the number of confirmed cases per day were available. There is a need for reliable up-to-date
information on the number of contacts isolated at any one time.

As is the case for other countries looking at exiting their lockdowns, the South Korea exit strategy
involves a mix of social distancing policies, behavioural interventions, and testing. South Korea has
moved to a phase of partially relaxed social distancing since May 6th [35]. This includes allowing
activities in low-risk venues, such as recreation parks and forests and closed-door sporting events,
while maintaining partial restrictions on the use of high-risk facilities (e.g. religious facilities, fitness
venues) and non-essential public gatherings which are all subject to strict infection prevention and
control guidelines [36]. Additionally, although schools have moved to online teaching, a growing
number of companies have eased their “smart-working” policies. Consultations between government,
industry and community-based bodies have been conducted to increase preparedness, reduce
conflicts and maximize uptake of long-term “every day” social distancing [37].

It is important to emphasize some key aspects particular to the South Korea outbreak, which are
relevant when attempting to apply lessons from the outbreak in South Korea to other settings. The
number of SARS-CoV-2 infections in South Korea has been far smaller than the US or most European
countries. Over two-thirds of cases were linked to a few major clusters, which were promptly identified
and tested en-masse. South Korea has implemented effective strategies for detecting and quarantining
imported cases, reducing the risk of secondary transmission. All these measures have contributed to
the outbreak remaining geographically localised. However, cluster-based management will be more
difficult in settings with much more widespread transmission across the country. Finally, the South
Korean response was facilitated by structures and processes such as additional legal powers for
quarantine, surveillance systems, and digital technologies introduced after the 2015 MERS outbreak
[38] which may be lacking in other countries. These key aspects may limit the extent to which the
testing and contact-tracing strategies adopted by South Korea can be translated to other settings.

DOI: https://doi.org/10.25561/79388 Page 6 of 16
29 May 2020 Imperial College COVID-19 response team

4. Methods
Data
We systematically extracted numbers of tests conducted, PCR-confirmed cases, deaths and recoveries,
and numbers of confirmed cases in isolation from surveillance data from and as defined by the KCDC
for the period January 20th to May 11th 2020 [39,40]. Where available (from March 25th onwards), we
also extracted data on the numbers of confirmed cases with an identified epidemiological link and/or
origin to assess the efficacy of contact tracing and identification of transmission clusters.

Time-varying reproduction number, R
We use an approach similar to those previously described [8,41] to quantify transmissibility over a 7-
day sliding window, from the incidence time series, assuming a certain distribution for the serial
interval (the time between symptom onset in a case and symptom onset in their infector). We assumed
that transmissibility was constant over that 7-day window, and measured it through the reproduction
number, R, defined as the average number of secondary cases infected by an infected individual. Our
method assumes that the daily incidence can be approximated by a Poisson process using the so-called
renewal equation:

 ~ ( ∑ =1 − ),

where It is the “true” incidence on day t, Rt is the reproduction number on day t, and w is the probability
mass function of the serial interval. We assumed a gamma distributed serial interval with mean 6.48
days and standard deviation 3.83 days [42] and uninformative prior distributions on R (mean 1 and
standard deviation 10). As onset dates were not available for all cases, R was estimated based on cases
by date of report using data from KCDC using the R packages EpiEstim and orderly. All analyses were
done with R software (Version 3.6.3) [8,43–45]. To assess sensitivity of the R estimates to the assumed
prior distribution, we ran our analysis with a range of prior distributions (Table S3) and found that our
conclusions were consistent.

EpiEstim is robust to under-reporting but assumes that this reporting rate remains constant. This was
not the case in South Korea due to changes in the case definition and testing criteria to include local
transmission from February 20th, 2020 (as indicated by the vertical line, Figure 2). This causes bias in
the R estimate. To explore how long these estimates were biased for, we truncated the dataset from
3 days following the change in testing until the end of the study period (May 11th) and re-estimated
time-varying R. We found that the estimates of R were consistent from March 6th, 2020 onward
between the full and truncated data and therefore estimates from this point are unaffected by the
scale up in testing.

Tests per positive case
To calculate the rolling 7-day average of tests per case, we first calculated the right-aligned 7-day
rolling average of cases and tests separately using the roll_mean function from the R package RcppRoll
[46]. We then divided the average tests by the average cases for each day to obtain an estimate for
average tests per case.

DOI: https://doi.org/10.25561/79388 Page 7 of 16
29 May 2020 Imperial College COVID-19 response team

5. Figures

Figure 1. Incidence of confirmed cases by date of report from daily KCDC press releases with key intervention
timings (A), and deaths (B). Interventions are separated into border control, testing, isolation and social
distancing. Sources of interventions: KCDC press releases, Ministry of Health and Welfare, and Ministry of
Education.

DOI: https://doi.org/10.25561/79388 Page 8 of 16
29 May 2020 Imperial College COVID-19 response team

Figure 2. Estimates of time-varying effective reproductive number R based on confirmed cases by date of report.
R is estimated using a sliding window of 7 days and an uninformative prior distribution with mean 1 and standard
deviation 10. The black line represents the posterior median value of R and the shaded region shows the 95%
credible interval (CrI). The dotted horizontal line shows R = 1. The top panel shows the full range of R values, with
the bottom panel zoomed in to R between 0 and 4. Vertical dotted line indicates the time at which the testing
protocol was changed (February 20th).

DOI: https://doi.org/10.25561/79388 Page 9 of 16
29 May 2020 Imperial College COVID-19 response team

Figure 3. New and cumulative numbers of people being tested in South Korea from the beginning of the COVID-
19 outbreak on January 20th until May 11th, 2020. Grey bars represent daily number of tests by date of report
and black line shows the cumulative number of tests conducted over time. Source: KCDC press releases.

Figure 4. Rolling 7-day average of the number of people tested per case until May 11th, 2020. The dashed vertical
line indicates the date on which South Korea changed its testing protocol from testing suspected cases with
contact with a case or travel history to a country with infections to testing all suspected cases (February 20 th).
Bottom panel zooms in to show region of 0 – 650 tests per case. Source: KCDC press releases.

DOI: https://doi.org/10.25561/79388 Page 10 of 16
29 May 2020 Imperial College COVID-19 response team

Figure 5. A. Cumulative proportion of confirmed cases by epidemiological link and/or origin from March 25th to
May 11th. The proportion of cumulative confirmed cases that are linked to existing cases or imported (white line)
as opposed to “under investigation” (which includes apparent sporadic cases). Linked cases are broken down
into whether they are connected to an imported case, part of the Shincheonji cluster, a smaller cluster or a non-
cluster contact of a confirmed case. B. Non-cumulative proportion of new cases reported during the two weeks
prior to the date on the x axis, by type of case. Source: KCDC press releases.

DOI: https://doi.org/10.25561/79388 Page 11 of 16
29 May 2020 Imperial College COVID-19 response team

Figure 6. Isolation dynamics in South Korea. Number of confirmed cases currently in isolation per day. Source:
KCDC press releases.

DOI: https://doi.org/10.25561/79388 Page 12 of 16
29 May 2020 Imperial College COVID-19 response team

6. References
1. European Centre for Disease Prevention and Control. COVID-19 situation update worldwide, as of 21 May
 2020. 2020 [cited 21 May 2020]. Available: https://www.ecdc.europa.eu/en/geographical-distribution-
 2019-ncov-cases

2. Korea Centers for Disease Control and Prevention. The first imported case of the novel coronavirus (2019-
 nCoV) in Korea | Press Release | News Room : KCDC. [cited 21 Jan 2020]. Available:
 https://www.cdc.go.kr/board/board.es?mid=a30402000000&bid=0030&act=view&list_no=365797&ta
 g=&nPage=1

3. The Government of the Republic of Korea. Tackling COVID-19 The Government of the Republic of Korea.
 2020. Available: https://ecck.eu/wp-content/uploads/2020/03/Tackling-COVID-19-Health-Quarantine-
 and-Economic-Measures-of-South-Korea.pdf

4. Korea Centers for Disease Control and Prevention. The Updates of COVID-19 in Republic of Korea as of
 24 February 2020. 24 Feb 2020 [cited 2 May 2020]. Available:
 https://is.cdc.go.kr/upload_comm/syview/doc.html?fn=158253439203200.pdf&rs=/upload_comm/doc
 u/0030/

5. Lee SK, Chun T-M. Episode #1 COVID-19 Case Study: The use of ICT & AI to flatten the curve in the Republic
 of Korea 27 March 2020 Webinar - AI for Good Global Summit. 27 Mar 2020 [cited 18 Apr 2020].
 Available: https://aiforgood.itu.int/webinar/

6. World Health Organization. WHO Public Health and Social Measures Database. 2020 [cited 8 May 2020].
 Available: https://www.who.int/emergencies/diseases/novel-coronavirus-2019/phsm

7. Korea Centers for Disease Control and Prevention. Updates on COVID-19 in Republic of Korea, 28 May
 2020. 28 May 2020 [cited 28 May 2020]. Available:
 https://is.cdc.go.kr/upload_comm/syview/doc.html?fn=159065340015200.pdf&rs=/upload_comm/doc
 u/0030/

8. Cori A, Ferguson NM, Fraser C, Cauchemez S. A New Framework and Software to Estimate Time-Varying
 Reproduction Numbers During Epidemics. Am J Epidemiol. 2013;178: 1505–1512.
 doi:10.1093/aje/kwt133

9. Bhatia S, Imai N, Cuomo-Dannenburg G, Baguelin M, Boonyasiri A, Cori A, et al. Report 6: Relative
 sensitivity of international surveillance. 2020. doi:10.25561/77168

10. Korea Centers for Disease Control and Prevention. The updates of COVID-19 in Republic of Korea as of
 19 February 2020 문서뷰어. 2020 [cited 2 May 2020]. Available:
 https://is.cdc.go.kr/upload_comm/syview/doc.html?fn=158207688673200.pdf&rs=/upload_comm/doc
 u/0030/

11. Korea Centers for Disease Control and Prevention. The 15 new cases of COVID-19 have been confirmed
 in Korea | Press Release | News Room : KCDC. 2020 [cited 2 May 2020]. Available:
 https://www.cdc.go.kr/board/board.es?mid=a30402000000&bid=0030&act=view&list_no=366239&ta
 g=&nPage=16

12. Korea Ministry of Health and Welfare. Ministry of Health & Welfare : Briefing on the pan-governmental
 meeting for COVID-19 2020-02-23. [cited 2 May 2020]. Available:
 https://www.mohw.go.kr/eng/nw/nw0101vw.jsp?PAR_MENU_ID=1007&MENU_ID=100701&page=1&
 CONT_SEQ=353124

13. Korea Ministy of Health and Welfare. Ministry of Health & Welfare : Extending Intensive “Social
 Distancing” for Another 2 Weeks 2020-04-07. 2020 [cited 2 May 2020]. Available:
 https://www.mohw.go.kr/eng/nw/nw0101vw.jsp?PAR_MENU_ID=1007&MENU_ID=100701&page=1&
 CONT_SEQ=353953

DOI: https://doi.org/10.25561/79388 Page 13 of 16
29 May 2020 Imperial College COVID-19 response team

14. Park SW, Sun K, Viboud C, Grenfell BT, Dushoff J. Potential roles of social distancing in mitigating the
 spread of coronavirus disease 2019 (COVID-19) in South Korea. medRxiv. 2020; 2020.03.27.20045815.
 doi:10.1101/2020.03.27.20045815

15. Ministry of Education. The New School Year Begins with Online Classes. 13 Apr 2020 [cited 8 May 2020].
 Available:
 http://english.moe.go.kr/boardCnts/view.do?boardID=265&boardSeq=80297&lev=0&searchType=null
 &statusYN=W&page=1&s=english&m=0301&opType=N

16. Korea Centers for Disease Control and Prevention. Coronavirus Infectious Diseases-19 Regular Disaster
 Prevention Headquarters Regular Briefing (April 19). 19 Apr 2020 [cited 2 May 2020]. Available:
 http://www.mohw.go.kr/react/al/sal0301vw.jsp?PAR_MENU_ID=04&MENU_ID=0403&page=2&CONT
 _SEQ=354112

17. Korea Centers for Disease Control and Prevention. Coronavirus Infectious Diseases-19 Regular Disaster
 Safety Headquarters Regular Briefing (April 27). 27 Apr 2020 [cited 2 May 2020]. Available:
 http://www.mohw.go.kr/react/al/sal0301vw.jsp?PAR_MENU_ID=04&MENU_ID=0403&page=2&CONT
 _SEQ=354231

18. Korea Centers for Disease Control and Prevention. Updates on COVID-19 in Republic of Korea (Press
 Release: 6 May 2020). 6 May 2020 [cited 14 May 2020]. doi:10.1017/CBO9781107415324.004

19. Korean Centers for Disease Control and Prevention. Coronavirus Infectious Diseases-19 Regular Disaster
 Prevention Headquarters Regular Briefing (May 3). 3 May 2020 [cited 3 May 2020]. Available:
 http://www.mohw.go.kr/react/al/sal0301vw.jsp?PAR_MENU_ID=04&MENU_ID=0403&page=1&CONT
 _SEQ=354337

20. Korean Statistical Information Service. Statistical Database | KOSIS KOrean Statistical Information
 Service. [cited 9 May 2020]. Available:
 http://kosis.kr/eng/statisticsList/statisticsListIndex.do?menuId=M_01_01&vwcd=MT_ETITLE&parmTabI
 d=M_01_01&statId=1962001&themaId=#SelectStatsBoxDiv

21. Korea Centers for Disease Control and Prevention. The case definition of 2019 novel coronavirus will be
 expanded. 2020 [cited 2 May 2020]. Available:
 https://is.cdc.go.kr/upload_comm/syview/doc.html?fn=158003243029400.pdf&rs=/upload_comm/doc
 u/0030/

22. Korea Centers for Disease Control and Prevention. The Updates of COVID-19 in Republic of Korea 19
 February 2020. 19 Feb 2020 [cited 2 May 2020]. Available:
 https://is.cdc.go.kr/upload_comm/syview/doc.html?fn=158209860015800.pdf&rs=/upload_comm/doc
 u/0030/

23. Ki M. Epidemiologic characteristics of early cases with 2019 novel coronavirus (2019-nCoV) disease in
 Korea. Epidemiol Health. 2020;42: e2020007. doi:10.4178/epih.e2020007

24. Korea Centers for Disease Control and Prevention. The updates of COVID-19 in Republic of Korea 22
 February, 2020. 2020 [cited 8 May 2020]. Available:
 https://is.cdc.go.kr/upload_comm/syview/doc.html?fn=158235699555200.pdf&rs=/upload_comm/doc
 u/0030/

25. Park SY, Kim Y-M, Yi S, Lee S, Na B-J, Kim CB, et al. Coronavirus Disease Outbreak in Call Center, South
 Korea. Emerg Infect Dis. 2020;26. doi:10.3201/eid2608.201274

26. Naver blog. Coronal virus infection 19 regular briefing on response. 2020 [cited 8 May 2020]. Available:
 https://blog.naver.com/daegu_news/221846363885

27. Korea Centers for Disease Control and Prevention. The updates on COVID-19 in Korea as of 31 March. 31
 Mar 2020 [cited 8 May 2020]. Available:
 https://is.cdc.go.kr/upload_comm/syview/doc.html?fn=158565093755500.pdf&rs=/upload_comm/doc

DOI: https://doi.org/10.25561/79388 Page 14 of 16
29 May 2020 Imperial College COVID-19 response team

 u/0030/

28. Korea Centers for Disease Control and Prevention. Updates on COVID-19 in Republic of Korea 11 May
 2020. 11 May 2020 [cited 14 May 2020]. Available:
 https://is.cdc.go.kr/upload_comm/syview/doc.html?fn=158919530461600.pdf&rs=/upload_comm/doc
 u/0030/

29. Technology Review. South Korea is watching quarantined citizens with a smartphone app | MIT
 Technology Review. 2020 [cited 3 May 2020]. Available:
 https://www.technologyreview.com/2020/03/06/905459/coronavirus-south-korea-smartphone-app-
 quarantine/

30. 620WTMJ Wisconsin. The Latest: South Korea says over 27,000 self-quarantined - WTMJ. [cited 3 May
 2020]. Available: https://wtmj.com/national/2020/04/02/the-latest-south-korea-says-over-27000-self-
 quarantined/

31. CNN. More than 46,000 people are in self-quarantine in South Korea April 7 coronavirus news - CNN.
 [cited 3 May 2020]. Available: https://edition.cnn.com/world/live-news/coronavirus-pandemic-04-07-
 20/h_8968f40eb281f76ce2df52373887b6b5

32. Korea Centers for Disease Control and Prevention. Coronavirus Disease 2019 Response Guidelines (For
 Local Governments). 15 Mar 2020 [cited 2 May 2020]. Available:
 https://covidtranslate.org/CovidPlaybook_EN_v1.0.pdf

33. Busan Metropolitan City. Northeast Asia Ocean Capital Busan Metropolitan City. [cited 14 May 2020].
 Available: http://www.busan.go.kr/corona19/index

34. Gwangju Metropolitan City. Corona 19 Gwangju Metropolitan City. [cited 14 May 2020]. Available:
 https://www.gwangju.go.kr/c19/c19/contentsView.do?pageId=coronagj2

35. Korea Centers for Disease Control and Prevention. Updates on COVID-19 in Republic of Korea 6 May
 2020. 2020 [cited 9 May 2020]. Available:
 https://is.cdc.go.kr/upload_comm/syview/doc.html?fn=158875528510800.pdf&rs=/upload_comm/doc
 u/0030/

36. Korea Centers for Disease Control and Prevention. Updates on COVID-19 in Republic of Korea 20 April
 2020. 2020 [cited 9 May 2020]. Available:
 https://is.cdc.go.kr/upload_comm/syview/doc.html?fn=158738192856000.pdf&rs=/upload_comm/doc
 u/0030/

37. Korean Ministry of Health and Welfare. Regular Briefing of Central Disaster and Safety Countermeasure
 Headquarters on COVID-19 April 27. 27 Apr 2020 [cited 9 May 2020]. Available:
 https://www.mohw.go.kr/eng/nw/nw0101vw.jsp?PAR_MENU_ID=1007&MENU_ID=100701&page=1&
 CONT_SEQ=354431

38. Cowling BJ, Park M, Fang VJ, Wu P, Leung GM, Wu JT. Preliminary epidemiological assessment of MERS-
 CoV outbreak in South Korea, May to June 2015. EUROSURVEILLANCE. 2015;20: 7–13. doi:10.2807/1560-
 7917.ES2015.20.25.21163

39. Korea Centers for Disease Control and Prevention. List | Press Release | News Room : KCDC. [cited 21
 May 2020]. Available: https://www.cdc.go.kr/board/board.es?mid=a30402000000&bid=0030

40. Korean Centers for Disease Control. Frequently Asked Questions for KCDC on COVID-19 (as of 30 March)
 | Press Release | News Room : KCDC. [cited 11 Apr 2020]. Available:
 https://www.cdc.go.kr/board/board.es?mid=a30402000000&bid=0030&act=view&list_no=366764&nP
 age=1

41. WHO Ebola Response Team. West African Ebola Epidemic after One Year — Slowing but Not Yet under
 Control. N Engl J Med. 2015;372: 584–587. doi:10.1056/NEJMc1414992

DOI: https://doi.org/10.25561/79388 Page 15 of 16
29 May 2020 Imperial College COVID-19 response team

42. Imperial College London COVID-19 Response Team. Report 9 - Impact of non-pharmaceutical
 interventions (NPIs) to reduce COVID-19 mortality and healthcare demand | Faculty of Medicine |
 Imperial College London. [cited 21 May 2020]. Available: https://www.imperial.ac.uk/mrc-global-
 infectious-disease-analysis/covid-19/report-9-impact-of-npis-on-covid-19/

43. R Core Team. R: A Language and Environment for Statistical Computing. Vienna, Austria; 2020.
 doi:10.1007/978-3-540-74686-7

44. FitzJohn R, Ashton R, Hill A, Eden M, Hinsley H, Russell E, et al. orderly: Lightweight Reproducible
 Reporting. R package version 1.1.29. 2020. Available: https://github.com/vimc/orderly

45. Cori A. EpiEstim: Estimate Time Varying Reproduction Numbers from Epidemic Curves. R package version
 2.2-1. 2019. Available: https://cran.r-project.org/package=EpiEstim

46. Ushey K. RcppRoll: Efficient Rolling / Windowed Operations. 2018. Available: https://cran.r-
 project.org/package=RcppRoll

DOI: https://doi.org/10.25561/79388 Page 16 of 16
You can also read