Spatial analysis of perceived health system capability and actual health system capacity for COVID-19 in South Africa - Research Square
←
→
Page content transcription
If your browser does not render page correctly, please read the page content below
Spatial analysis of perceived health system capability and
actual health system capacity for COVID-19 in South
Africa
Tholang Mokhele ( TAMokhele@hsrc.ac.za )
Human Sciences Research Council, Pretoria, South Africa https://orcid.org/0000-0002-9087-7951
Ronel Sewpaul
Human Sciences Research Council, Cape Town, South Africa
Sibusiso Sifunda
Human Sciences Research Council, Pretoria, South Africa
Gina Weir-Smith
Human Sciences Research Council, Pretoria, South Africa
Simangele Dlamini
Human Sciences Research Council, Pretoria, South Africa
Thabang Manyaapelo
Human Sciences Research Council, Pretoria, South Africa
Inbarani Naidoo
Human Sciences Research Council, Durban, South Africa
Whadi-Ah Parker
Human Sciences Research Council, Cape Town, South Africa
Natisha Dukhi
Human Sciences Research Council, Cape Town, South Africa
Sean Jooste
Human Sciences Research Council, Cape Town, South Africa
Saahier Parker
Human Sciences Research Council, Cape Town, South Africa
Khangelani Zuma
Human Sciences Research Council, Pretoria, South Africa
Mosa Moshabela
University of KwaZulu-Natal, Durban, South Africa
Musawenkosi Mabaso
Human Sciences Research Council, Durban, South Africa
Sasiragha Priscilla Reddy
Human Sciences Research Council, Cape Town, South Africa
Research Article
Keywords: COVID-19, spatial analysis, health system, capability, capacity, South Africa
Page 1/17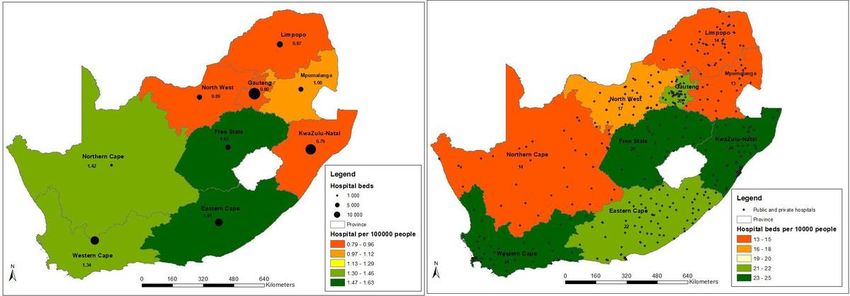
DOI: https://doi.org/10.21203/rs.3.rs-47804/v1
License: This work is licensed under a Creative Commons Attribution 4.0 International License. Read Full
License
Page 2/17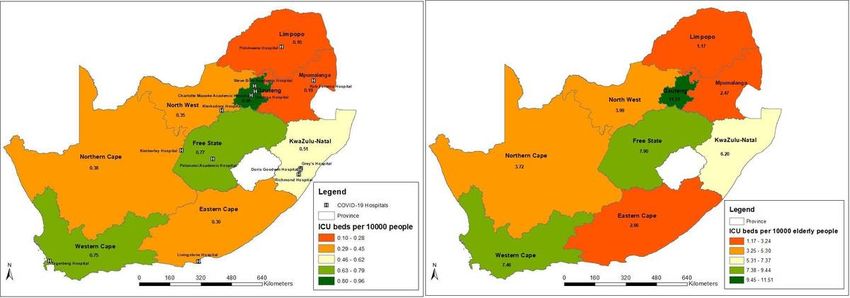
Abstract
People’s con dence on the health system capability in managing COVID-19 outbreak can determine public support,
risk perceptions and compliance behaviours during the pandemic. Therefore, this paper investigated people’s
perception on health system capability using online survey data and current state of health system capacity to deal
with COVID-19 pandemic at different spatial areas across the country. Simple and multiple logistic regression
models were used to examine the factors associated with perception of the health system’s capability to manage the
COVID-19 pandemic at a national level and within each province. Spatial comparative analysis was conducted on
perception of health system capability and density indicators of health system capacity. Findings showed South
Africans had low con dence on health system capability with only two in ve (40.7%) reporting that they thought
that the country’s health system was able to manage the COVID-19 pandemic. Sex and knowledge on COVID-19 were
signi cantly associated with the perception of the health system’s capability to manage the pandemic at the
national level and in four of the nine provinces. Overall, the ndings of this study clearly highlights the challenges on
the country’s health system both perceived or real that needed to be addressed as part of the preparation for the
COVID-19 pandemic. Timeous implementation of a countrywide National Health Insurance (NHI) system is now
more critical than ever in improving health care outcomes of the South African population even beyond the existence
of the COVID-19 epidemic.

Introduction
Coronavirus Disease 2019 (COVID-19) is a novel coronavirus caused by the severe acute respiratory syndrome
coronavirus 2 (SARS-CoV2). This novel coronavirus rst emerged as a causative agent that led to a respiratory
disease outbreak in December 2019 in Wuhan, China (Jernberg 2020). South Africa recorded its rst con rmed case
of COVID-19 on March 5 2020. Since then the number of con rmed cases have grown exponentially as there are
currently (as of rst week of July 2020) more than 200 000 con rmed cases across the country. Health system
capability and capacity to deal with this COVID-19 pandemic has been under pressure and scrutiny globally.
Clinically, the COVID-19 disease is characterised by a dry cough, fever, fatigue and shortness of breath. In severe
cases, patients present with severe respiratory illness such as a pneumonia or acute respiratory distress syndrome
(ARDS) which could both lead to death (Zhang et al. 2020). According to recent presentation made to South African
Members of Parliament by the Director General of the National Department Health, there is a total of 119 416
hospital beds available from both private and public hospitals across South Africa (du Toit and Cowan 2020; van
der Heveer 2020). There are also 3 318 Intensive Care Unit (ICU) beds available, but it is projected that ICU beds
could exceed 14 700 at the highest peak of COVID-19 infection. With regard to ventilators, the public healthcare
system and private healthcare system currently has a total of 3 216 ventilators. It is estimated that at highest peak
of COVID-19 outbreak, 7 000 ventilators will be required to deal with the virus, a shortage of 3 784 (du Toit and
Cowan 2020).

In South Africa, inequalities exist in access to health services between public and private sectors, as well as within
the public sector itself, especially between urban and rural areas (Rosero-Bixby 2004; Benatar 2013; Hu et al. 2013;
Guerrero et al. 2013; Mansour 2016; Burger and Christian 2018; Robin et al. 2018). The public healthcare system
supports around 84% of uninsured population while the private sector only deals with 16% of the people with
medical aids across the country, even though its annual per capita healthcare expenditure is almost 10 times more
than the public sector’s (Benatar 2013). Those who can afford medical insurance are predominantly white and those
who cannot are black African. These inequalities seen in health care access in South Africa are indicative of the
racial segregation policies carried over into the present from the apartheid government (Gradin 2019). The COVID-19

                                                       Page 3/17
outbreak has dramatically highlighted the necessity for a more integrated healthcare system (Nkonki and Fonn
2020). The COVID-19 pandemic presents signi cant opportunity for the National Health Insurance (NHI) to be piloted
in real-time. In March 2020, the Competition Commission has published a COVID-19 block exemption for the health
sector for promoting better coordination, sharing of information and standardisation of practice across the entire
healthcare sector as well as promoting agreements between the National Department of Health and the private
healthcare sector (DTI 2020). Spatial accessibility of healthcare facilities is also important factor in the ght against
COVID-19 outbreak. Spatial accessibility is often concerned with the complex relationship between the spatial
separation of the population and the supply of healthcare facilities and thus has a strong underlying geographic
component (Black et al. 2004; Mokhele et al. 2012; Munoz and Källestål 2012; Khashoggi and Murad, 2020). Spatial
accessibility is regarded as a primary deciding factor of access to healthcare and healthcare utilization (Siegel et al.
2016; Ma et al. 2018).
In addition, people’s con dence on the healthcare system in managing COVID-19 outbreak is also crucial in
managing the outbreak. For instance, in India, it was reported that some people escaped hospitals or quarantine and
this had been alluded mainly to the con dence de cit in the public health system in many parts of the country
(Chetterje 2020). Therefore, this paper explores South Africans’ perceptions of the country’s health system capability
to manage COVID-19. It further assesses the country’s current health system capacity in the various geographic
areas and draws comparisons with perceptions of the health system capability to manage COVID-19 pandemic.
Materials And Methods
Data
This paper utilised data from Human Sciences Research Council (HSRC) COVID-19 online survey conducted from 27
March 2020 to 2 April 2020 in South Africa. The survey was open to all adult people (18 years and older) residing in
South Africa, regardless of race, sex or nationality. The self-administered structured questionnaire (48 items)
included socio- demographic, knowledge and infection control measures regarding COVID-19, risk of contracting
COVID-19, perception of health system capability, hygiene practices, preparedness for self-isolation/quarantine,
preparedness for lockdown and the use of social media in accessing information on COVID-19. The survey alerts
were distributed on a data-free messaging platform, were distributed via various social media platforms, were
posted on the HSRC organisational website and broadcasted on radio and TV stations. Ethics approval was received
from the HSRC Research Ethics Committee (REC); (REC 5/03/20).
Measures
Socio-demographic variables used were sex, age, employment, knowledge score (continuous variable), risk
perception and self-isolation or quarantine possibility. These were age group in years (18-29, 30-39, 40-49, 50-59,
60+), sex (male or female), race (Black African, Coloured, White, Indian/Asian), employment status (employed full
time, employed informal/part time, student, unemployed, self-employed), and dwelling type (formal dwelling or
informal dwelling). Knowledge score was developed from six knowledge variables about COVID-19, which were four
variables on knowledge about transmission (COVID-19 is spread by direct contact with the virus from: (Select all that
apply)) with options being (infected people coughing/sneezing, pets, touching face after being in contact with
infected person, contact in public gathering with infected person, contaminated surfaces and I don’t know); one
variable on knowledge about incubation (After how long will an infected person show signs of being sick?) with
Page 4/17options being (immediately, after 1-2 days, after 2-14 days, after 15-20 days, and I don’t know); and one variable on
knowledge about symptoms (Which of the following best describes the symptoms of COVID-19: (Select all that
apply)) with options being (shortness of breath, body pain, sweating, headaches, coughs, sneezing, red-itchy eyes,
runny nose, fever, and I don’t know). Respondents were assigned a value of 1 for each of the four transmission
modes identi ed, for correct identi cation of the incubation period of 2-14 days and for correct identi cation of fever,
cough and shortness of breath as the main symptoms. The nal knowledge sum score ranged from 0 to 6. For risk
perception, self-perceived risk of contracting coronavirus was assessed using the question “How do you rate your
personal risk of contracting COVID-19?” with response options being 1=very high risk, 2=high risk, 3=moderate risk,
4=low risk and 5= very low risk. These responses were recoded into 1=low risk (very low risk, and low risk),
2=moderate risk and 3=high risk (very high risk and high risk). For perception of self-isolation or quarantine
possibility, this was assessed using the question “Do you think you may end up in a situation of self-isolation or
quarantine?” with response options being 1=yes, 2=no and 3=don’t know. These responses were recoded into 0=no
(no and don’t know) and 1=yes (yes). The primary outcome variable, perception on health system capability in
dealing with COVID-19, was assessed using the following question “Do you feel each of the following are able to
manage the South African COVID-19 outbreak? SA health system” with options being 1=yes, 2=no and 3=don’t know.
These were dichotomised into 0=no (no and don’t know) and 1=yes (yes) for logistic regression models.
Statistical analysis
Data was analysed using Stata version 15.0 (Stata Corp 2017). The data were benchmarked using Statistics South
Africa 2019’s mid-year adult population estimates for generalisability of the ndings. Differences in estimates
between the socio-demographic variables were compared using Chi-squared tests with a statistical signi cance level
of p < 0.05. Logistic regression was performed to determine factors associated with the perception that the country’s
health system was capable to manage the COVID-19 outbreak. This was done at both national level and at
provincial level to determine differences across provinces. Race group and dwelling type were excluded from the
logistic regression analyses due to small cell sizes for Indian/Asian and Coloured communities in some provinces,
namely the Northern Cape, Limpopo and Mpumalanga. A signi cance level of p < 0.05 was used.
Spatial analysis
For spatial density indicators, secondary data for the numbers of hospitals, hospital beds and ICU beds was
gathered from various sources (Naidoo et al 2013; Makombo 2016; Stats SA 2019; van der Heveer 2020). For
population, 2019 population estimates from Statistics South Africa (Stats SA) were considered (Stats SA 2019).
Spatial density indicators were developed to determine number of hospitals, hospital beds and ICU beds per given
population across various provinces using ArcGIS 10. For spatial comparative analysis across perception of health
system capability maps and density indicators of health system capacity maps, the graduated colour symbology
and equal interval classi cation method was done using ve classes for all maps. The COVID-19 hospitals
earmarked by the national government were also geocoded and mapped for spatial analysis of their distribution and
geographic accessibility.
Results
Demographics of respondents
The study sample from the online survey comprised 53 488 respondents. After benchmarking, females constituted
53.9% and Black Africans accounted for 76.4% followed by Whites at 10.8%. In terms of age composition, 29.9%
Page 5/17were 18-29 years old followed by those aged between 30 and 39 years old (25.7%).
Perception of health system capability in managing COVID-19
Table 1 highlights people’s perceptions towards health system capability to manage COVID- 19 outbreak across
different socio-demographic variables and provinces. Overall, two in ve South Africans (40.7%) reported that they
thought that the country’s health system was able to manage the COVID-19 outbreak. The perception of health
system capability to manage COVID-19 varied signi cantly across all socio-demographic variables (p < 0.01 for age
and p< 0.001 for all other variables). Males had a signi cantly higher prevalence of perceiving the health system
as capable than females. The elderly (70 years and older) had the lowest con dence on the health system’s
capability (29.0%). Black Africans had the highest con dence on the health system’s capability (46.9%) while White
participants had lowest (13.4%).
Those employed part-time or informally had the highest con dence (44.8%) on health system capability and self-
employed adults had the lowest (34.4%). The perception of health system capability was less prevalent among
those who thought they were at moderate and high risk of contracting COVID-19 (around 38% each) and among
those who thought they might end up in self-isolation or quarantine (34.1%). People residing in informal dwellings
had a higher con dence on the health system’s capability (55.7%) than those who lived in formal dwelling (40.0%).
Table 1 People’s con dence on health system capability in managing COVID-19 pandemic
Page 6/17Socio-demographics Total % 95% CI p value Sex Male 15 476 44.4 [42.3-46.5]
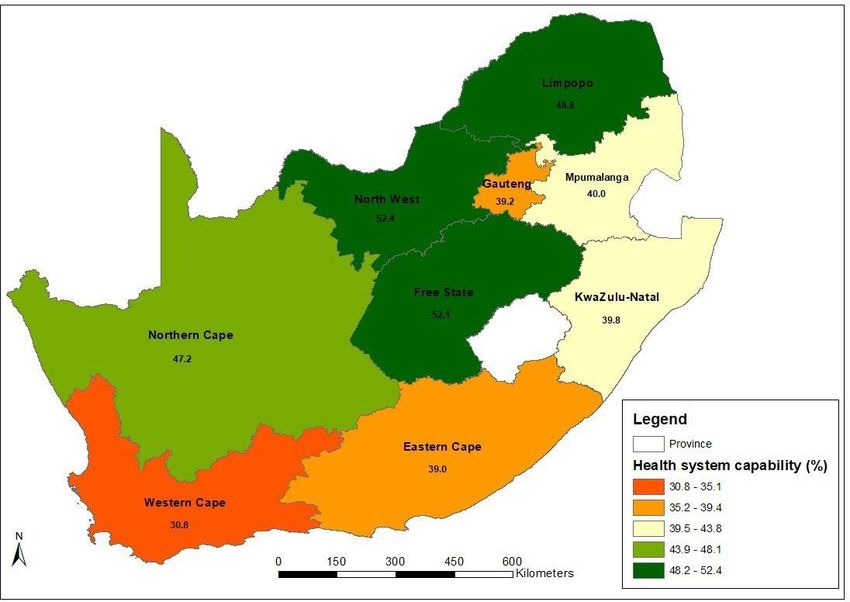
con dence in the health system’s capability in managing COVID-19 outbreak. These were followed by Limpopo with
48.8% of people having con dence on the country’s health system to deal with COVID-19 pandemic.

In the national sample, age (compared with 18-29 years: 60 years and older, OR=0.76, 95% CI: [0.59-0.99]), being
female (OR=0.75 [0.67-0.83]), employment status (compared with full time employed: Unemployed, OR=1.21 [1.02-
1.44] and self employed, OR=0.78 [0.64- 0.96]), knowledge score (OR=0.89 [0.85-0.93]), risk perception (compared
with low risk perception: moderate, OR=0.82 [0.72-0.93]), and perception of self-isolation or quarantine possibility
(OR=0.65 [0.58-0.72]) were signi cantly associated with the perception that the health system was capable of
managing the COVID-19 outbreak (Table 2).

In the Eastern Cape, perception of self-isolation or quarantine possibility (OR=0.54 [0.37- 0.8]) and age 40-49 years
(OR=0.53 [0.31-0.91] compared to 18-29 years) were signi cantly associated with decreased odds of perceiving that
the health system was capable. In the Free State, female gender (OR=0.61 [0.37-0.99]) and knowledge score
(OR=0.68 [0.55-0.85]) were signi cantly associated with decreased odds of perceiving that the health system was
capable while age 30-39 years (OR=2.12 [1.05-4.28] compared to 18-29 years) was signi cantly associated with
increased odds of this perception. In Gauteng province, female gender (OR=0.78 [0.69-0.89]), knowledge score
(OR=0.88 [0.83-0.94]) and moderate risk perception (OR=0.81 [0.7-0.93] compared to low risk perception) were
signi cantly associated with decreased odds of the perception. In KwaZulu-Natal, knowledge score (OR=0.9 [0.82-
0.99]) and moderate risk perception (OR=0.75 [0.56-1.0] compared to low risk perception) were signi cantly
associated with decreased odds of perception. In Limpopo being self-employed (OR=0.33 [0.13-0.81] compared with
being in full time employment) was signi cantly associated with decreased odds of perception. In the North West,
female gender (OR=0.36 [0.2- 0.67]) and perception of self-isolation or quarantine possibility (OR=0.41 [0.23-0.72])
was signi cantly associated with decreased odds of perception. In the Western Cape, female gender (OR= 0.77 [0.65-
0.92]), 60 years and older (OR= 0.49 [0.35-0.68] compared to 18-29 years), being self-employed (OR=0.74 [0.56-0.97]
compared to being in full time employment), knowledge score (OR= 0.86 [0.8-0.93]) and perception of self-isolation
or quarantine possibility (OR= 0.69 [0.58-0.81]) were signi cantly associated with decreased odds of perceiving that
the health system was capable of managing the COVID-19 pandemic.

Table 2 Logistic regression showing factors associated with people’s perception of health system’s capability on
managing COVID-19 by province

                                 National    EC      FS        GP      KZN    LP     MP    NW     NC    WC
  Socio-demographics               OR        OR      OR        OR      OR     OR     OR    OR     OR     OR
  Sex
  Male                             Ref       ref     ref       Ref     ref    ref    ref    ref   ref    ref
  Female                          0.75*     0.96    0.61*     0.78*    0.94   0.61 0.8     0.36* 0.6    0.77*
  Age group
  18-29                            Ref       ref     ref       Ref     ref    ref    ref    ref   ref    ref
  30-39                           0.92      0.88    2.12*     0.88     0.76   1.33 1.1     0.73   0.9    0.8
  40-49                           0.97      0.53*   1.21      1.09     0.98   0.95 2.1     0.75    1     0.8
  50-59                           1.07      1.13    2.07      1.08     0.85   1.01   3     0.73   1.4   0.81
  60+                             0.76*     1.14    2.37      0.76     0.67   1.26 0.4     0.45   0.9   0.49*
  Employment status
  Employed full time               Ref       ref     ref       ref     ref    ref    ref    ref   ref    ref
  Empoyed informally/part time
                                  1.21       1.2    0.55      1.21     1.4    0.62 1.5     1.35   3.5   1.31
  Student                         1.07      0.82    0.81      1.24     1.04   0.71   2     1.16   0.7   1.22
  Unemployed                      1.21*      0.9    0.84      1.16     1.32   0.76 2.4     1.7     2    1.17

                                                           Page 8/17
Self employed 0.78* 0.75 0.54 0.85 0.76 0.33* 1 1.03 2 0.74*
Knowledge
Knowledge score 0.89* 0.89 0.68* 0.88* 0.9* 0.99 0.9 1.04 0.8 0.86*
Risk perception
Low Ref ref ref ref ref ref ref ref ref ref
Moderate 0.82* 1.02 0.62 0.81* 0.75* 0.73 0.8 0.97 0.5 0.94
High 0.87 0.94 0.59 0.9 0.82 0.64 0.9 0.9 0.5 0.95
Self-isolation quarantine possibility or
No Ref ref ref ref ref ref ref ref ref ref
Yes 0.65* 0.54* 0.9 0.6* 0.86 0.76 0.6 0.41* 0.6 0.69*
*p < 0.05; EC=Eastern Cape; FS=Free State; GP=Gauteng; KZN=KwaZulu-Natal; LP=Limpopo; MP=Mpumalanga;
NW=North West; NC=Northern Cape; WC=Western Cape
Health system capacity
Table 3 shows secondary data on total population, hospitals, hospital beds, and ICU beds by province. Gauteng, the
most populated (smallest by geographic area) province had the highest number of hospitals, however these were
mainly private hospitals (83) compared to 39 public hospitals. There were more Hospital beds in public hospitals
than in private hospitals whereas the opposite was the case with regard to ICU beds across the country.
Table 3 Population, hospitals, hospital beds, and ICUs beds by province
Public Private Total Public Private Total
Total Public Private Total hospital hospitals hospital beds ICU ICU ICU
Province population hospitals hospitals hospitals beds beds
beds beds beds
Eastern 6 712 276 91 17 108 13 200 1 723 14 923 93 110 203
Cape
Free State 2 887 465 34 13 47 4 798 2 337 7 135 109 114 223
Gauteng 15 176 39 83 122 16 656 14 278 30 934 330 1 132 1 462
116
KwaZulu- 11 289 77 12 89 22 048 4 514 26 562 273 305 578
Natal 086
Limpopo 5 982 584 42 10 52 7 745 600 8 345 34 28 62
Mpumalanga 4 592 187 33 13 46 4 745 1 252 5 997 25 63 88
North West 4 027 160 22 14 36 5 132 1 685 6 817 54 87 141
Northern 1 263 875 16 2 18 1 523 293 1816 21 27 48
Cape
Western 6 844 272 53 39 92 12 241 4 385 16 626 222 291 513
Cape
RSA 58 775 407 203 610 85 362 31 067 119 155 1 178 2 140 3 318
021
Data sources: Naidoo et al. (2013); Makombo (2016); Stats SA (2019); van der Heveer (2020)
Fig. 2 shows the results from the spatial density analysis of hospitals and hospital beds per population. KwaZulu-
Natal, Gauteng, Limpopo and North West had the lowest number of hospitals per 100 000 people with 0.79, 0.80,
0.87 and 0.89 respectively (Figure 2a). All the remaining provinces had more than one hospital per 100 000 people.
Free State had the highest with 1.63 hospitals per 100 000 people. Gauteng had the highest number of hospital
beds, followed by Western Cape, KwaZulu-Natal and Eastern Cape with more than 10 000 hospital beds in their
hospitals. Mpumalanga, Limpopo and Northern Cape had the lowest number of hospital beds per 10 000 people
(Figure 2b). Gauteng, which was among those with the lowest number of hospitals per 100 000 people, fell under the
second highest category with 20 hospital beds per 10 000 people. Free State, KwaZulu-Natal and Western Cape had
the highest number of hospital beds per 10 000 people with 25, 24 and 24 respectively. Figure 2b also shows broad
spatial distribution of private and public hospitals across different provinces.
Page 9/17With regard to the number of ICU beds per 10 000 people, Limpopo and Mpumalanga fell under the lowest category
of 0.10 to 0.28 ICU beds per 10 000 people (Fig. 3a). Only Gauteng, followed by Free State and Western Cape, had
the highest ICU beds per 10 000 people. Fig. 3a further depicts the spatial distribution of hospitals earmarked to
attend to COVID-19 patients. Almost all provinces, except Gauteng, seems to have unbalanced location of the
COVID-19 hospitals. The authors are not aware of the factors that were considered when selecting the current
COVID-19 hospitals, From a geographic point of view, it appears that the hospitals in each province are often located
in some major cities which are not necessarily centrally located within their province. Therefore, these hospitals are
not easily accessible to a large proportion of a province’s population, especially if the patients will be transported by
road. Hence, at least two hospitals per province could have resolved the skewness of this spatial distribution.
KwaZulu-Natal in particular has all three COVID-19 hospitals around Pietermaritzburg, which raises some spatial
concern in terms of physical accessibility of these COVID-19 hospitals. For the vulnerable population, the elderly, a
similar pattern was noticed, with the exception of the Eastern Cape, which ranked in the second lowest category of
numbers of ICU beds per 10 000 people but had one of the lowest numbers of ICU beds per 10 000 elderly people.
Limpopo, Mpumalanga and the Eastern Cape had between 1.17 and 3.24 ICU beds per 10 000 elderly people (Fig.
3b).
Discussion
Our study ndings shows that, overall, people reported having low con dence in the South African health system,
with only two out of ve people indicating they thought the health system would manage to deal with COVID-19
pandemic. In similar studies conducted in Denmark and Finland, respondents reported high rates of con dence in
their health systems to deal with COVID-19 with 86% and 78% respectively (Norrestad 2020a; 2020b).. Black
Africans, those employed part-time or informally and informal dwellers had higher con dence in health system
capability while Whites, self-employed and those residing in formal dwellings had lower con dence in health system
capability to deal with COVID-19. This demonstrates clear divisions based on socio-economic status, geolocation as
well as some racial differences in peoples’ perceptions. The majority of the Black Africans rely on the public health
system almost exclusively therefore this increased con dence could well be due to the fact that they would not have
alternative options in terms of access to health care, traditional forms of treatments aside. The lower con dence
shown here by White respondents could be directed at the public health system and not the private which is usually
very well resourced. The majority of Whites have access to medical insurance and therefore private medical care.
Also concerning is that, the elderly (70 years and above), those who perceived themselves at high risk of contracting
COVID-19 and those who thought they might end up in self-isolation or quarantine had lowest con dence in health
system capability to manage COVID-19 pandemic. People in older age groups are among those that are classi ed as
highly vulnerable to COVID-19 pandemic around the world both in terms of infections and fatalities (WHO 2020).
Sex and knowledge on COVID-19 were signi cantly associated with the perception of the health system’s capability
to manage the pandemic at the national level and in four of the nine provinces. Females were less likely to have
con dence on health system’s capability to manage COVID-19 outbreak than their male counterparts. The nding
that men have more con dence in the health care system is surprising since previous studies reported that men
generally access health care services much less than women do (van Heerden et al. 2015). It is possible that women
lacking con dence in the health system’s capability could be associated with how they perceive the quality thereof.
Future research would need to examine perceptions of health system’s capability together with the quality. Age and
self-isolation or quarantine possibility key at national level and in three provinces while employment and risk
perception were signi cant predictors at national level and in two provinces. The vulnerable group, elderly (60 years
Page 10/17and older), were key determinant of people’s con dence on health system capability to deal with COVID-19 pandemic
at national level and in Western Cape. People’s risk perceptions (which are in uenced by age and degree of perceived
vulnerability) and knowledge about a public health problem often result in lower con dence in managing the
problem.
Spatial accessibility has been previously reported to represents an important barrier to accessing healthcare services
(Munoz and Källestål 2012). Spatial accessibility of COVID-19 hospitals in our ndings raises some concerns
regarding the readiness to deal with COVID-19 pandemic, especially considering that patients might have to be
transported through roads. These could be addressed by at least adding extra temporary hospitals earmarked for
COVID- 19 in each province with one COVID-19 hospital. Provinces have already started setting up this additional
health care facilities in preparation for the expected surge in the number of cases and the potential need for
hospitalisation across the country. Mostly rural provinces such as the Eastern Cape and KwaZulu-Natal should also
receive special context speci c planning for the provision which addresses challenges such as long distances
between villages and available hospitals as well as poor road infrastructure. These extra hospitals should be
allocated based on the geographic location and population distribution as well as the emerging trends of the
pandemic whereby the number of cases and epicentres have been shifting since the outbreak of COVID-19. The
Western Cape Province initially only had one COVID-19 earmarked hospital in the early stages of the epidemic when
our study conducted. This later changed dramatically with now the province being regarded as the epicentre for the
epidemic with leading number of con rmed cases and number of deaths, and this has had to be revisited and more
hospitals being allocated as well as temporary hospitals being setup at the International Convention Centre for the
ght against the COVID-19 pandemic. Other provinces with big urban metros such as the Eastern Cape, Gauteng and
KwaZulu-Natal had to also readjust their plans as they all initially had three hospitals each that were earmarked for
the response.
Our study nding shows that number of hospitals per population and number of hospital beds per population across
the country are generally lower compared to some international statistics from both public and private hospitals
such as in Canada, Italy and Japan (Wilson et al. 2018). The current national average of 5.6 ICU beds per 100 000 in
South Africa is slightly lower compared to those of some European countries such as the United Kingdom (6.6),
France (9.7) and Italy (12.5). Turkey and Germany had one of the highest reported numbers with 46 and 29.2 ICU
beds per 100 000 population (WHO 2020). As indicated earlier, the country currently has lower ICU beds available
compared to the number of ICU beds that may be required (3318 vs 14 700) at the highest peak of COVID-19
infection (du Toit and Cowan 2020). This means that there are currently on average 0.56 ICU beds per 10 000 people
across the country. At the highest peak, worst case scenario, national average of 2.50 ICU beds per 10 000 people
will be required. If we take this into account, this means that there is a lot to be done in all provinces to reach the
required national average. In particular, urgent attention is needed to increase the ICU beds numbers in Eastern Cape,
KwaZulu-Natal, Western Cape and Gauteng as they are currently at around 0.30, 0.51, 0.75 and 0.96 ICU beds per 10
000 people respectively. These four provinces require urgent attention as they are currently leading with con rmed
cases of COVID-19 pandemic.
Findings from this paper shows that there were some similarities between people’s perceptions on healthcare
systems capability and the actual health systems capacity to deal with COVID-19 pandemic in some provinces. For
instance, Free State was predominantly at upper band in terms of proportions of people who had con dence on the
health systems capability and the actual health system capability to deal with the pandemic. Eastern Cape on the
other hand was at the lower end with regard to people’s con dence in health systems capability and health system
capacity. Eastern Cape appeared at upper bound only on number of hospital per 100 000 and number of hospital
Page 11/17beds per 10 000 population. Surprisingly, Western Cape had the lowest score on people’s con dence on health
system capability in managing COVID-19, yet it was among the top for almost all density indicators of health
systems capacity except for the density on number of ICU beds per 10 000 elderly people where it was it the middle
of the range. Western Cape also had the highest signi cant proportion of elderly people based on the online survey
results. In addition, results showed that the elderly (60 years and above) was signi cant predictor of people’s
con dence in health system capability (OR = 0.49, p < 0.05). This might have attributed to the lowest con dence on
health system capability in this province. Although North West and Limpopo had the highest proportions of people
who felt that the health system was capable to deal with COVID-19 outbreak, they were among the lowest in all
health system capacity indicators.
The outbreak of the COVID-19 epidemic showed and demonstrated the urgency and the importance of the NHI
implementation, especially in addressing the inequity access to healthcare that exists between private and public
health care. The COVID-19 pandemic has laid bare the health disparities that exists between different communities
that exists in the country due to historical structural systems brought about by both colonialism and Apartheid race
based special planning and service provision. The NHI is now more than ever our only hope in correcting the
mistakes of the past. This outbreak provides the rst and best opportunity for South Africa to reengineer the
country’s health system to be united and integrated as much as possible between the public and the private health
care systems. The COVID-19 block exemption for the health sector is an important step towards the testing the
implementation of NHI. The government and all role players in the country should embrace this opportunity and
make it real by ensuring that all systems that are necessary for the NHI implementation are put in place and
expanded upon.
This study does have some limitations. One of the main limitations was that there was no clarity on the online
questionnaire on whether South African health system included both private and public sector. So there might be
underestimation or overestimation on the people’s con dence on health system capability to deal with COVID-19
depending on how they understood and experience the health system. Respondents may also have been responding
on their perceptions of the public health care system regardless of whether they utilise those services or not. Other
than the above mentioned limitations, ndings from this paper gives a rough picture of what are people’s perception
on the South African health system capability and the current state of health system capacity to deal with COVID-19
outbreak at provincial and national levels across the country.
Conclusion
To the best of our knowledge this paper was the rst to investigated perception of the South African health system
capability and its actual health system capacity to respond to the COVID-19 pandemic and its subsequent spread.
Overall, most people reported having low con dence in the health system’s capability in managing COVID-19
outbreak and that may be due to having the wrong perceptions or may be due to prior bad experiences in their
interaction with health care facilities and services. Sex and knowledge on COVID-19 were signi cantly associated
with the perception of the health system’s capability to manage the pandemic at the national level and in four of the
nine provinces. Females were less likely to have con dence on health system’s capability to manage COVID-19
outbreak than their male counterparts. Overall, the ndings of this study clearly highlights the challenges on the
country’s health system both perceived or real that needed to be addressed as part of the preparation for the COVID-
19 pandemic. Urgent policy interventions and implementations are recommended for continued increase in the
number of ICU beds across the country with particular focus in Western Cape, Eastern Cape, KwaZulu-Natal and
Page 12/17Gauteng. Timeous implementation of a countrywide NHI system is now more critical than ever in improving health
care outcomes of the South African population even beyond the existence of the COVID-19 epidemic
Declarations
Consent
Informed consents were obtained from participants before participants proceeded to the online survey questions.
Participants were informed that their participation was voluntary and that they could withdraw from the online
survey at any time should they wish so.
Author Contributions SPR conceived the study and TM conceptualised the paper. TM and RS conducted the analysis
and interpreted the results. TM drafted the manuscript. TM, RS, SS, GWS, SD, TMa, IN, WP, ND, SJ, SP, KZ, MMo, MM,
SPR contributed to interpreting the results and editing the manuscript. All authors read and approved the nal
manuscript before submission.
Funding This research received no external funding.
Ethics Approval Ethics approval was received from the HSRC Research Ethics Committee (REC); (REC 5/03/20).
Acknowledgments Big thanks to all South African residents who participated in the HSRC COVID-19 Online Survey.
Thanks Ms Yolande Shean for logistical and administrative support while Prof Leickness Simbayi and Prof Crain
Soudien credited for their executive support in HSRC COVID-19 Online Survey.
Con icts of Interest The authors declare no con ict.
References
1. Benatar, S. (2013). The challenges of health disparities in South Africa. South African Medical Journal, 103(3),
154–155. DOI: https://doi.org/10.7196/SAMJ.6622
2. Black, M., Ebener, S., Aguilar, P. N., Vidaurre, M. and El Morjani, Z. (2004). Using GIS to measure physical
accessibility to health care. World Health Organization, Geneva.
http://www.who.int/kms/initiatives/Ebener_et_al_2004a.pdf Accessed 24 June 2011
3. Burger, R. and Christian, C. (2018). Access to health care in post-apartheid South Africa: Availability,
affordability, acceptability. Health Economics, Policy and Law, 1–13. DOI:
https://doi.org/10.1017/S1744133118000300
4. Chatterje, P. (2020). Gaps in India’s preparedness for COVID-19 control: Under- investment in public health-care
system poses a challenge to India’s COVID 19 containment plans. The Lancet, 20, 544.
https://doi.org/10.1016/S1473-3099(20)30300-5
5. (2020). Competition Act (89/1998), as amended: COVID-19 block exemption for the healthcare sector, 2020.
Department of Trade and Industry (DTI).
6. du Toit, and Cowan, K. (2020). SA government plans for Covid-19 to peak in September but questions about
data remain. https://m.news24.com/SouthAfrica/News/sa-government- plans-for-covid-19-to-peak-in-
september-but-questions-about-data-remain-20200411 Accessed 1 April 2020
Page 13/177. Gradín, (2019). Occupational segregation by race in South Africa after apartheid. Review of Development
Economics, 23(2), 553–576. DOI: https://doi.org/10.1111/rode.12551
8. Guerrero, E. G. and Kao, D. (2013). Racial/ethnic minority and low-income hotspots and their geographic
proximity to integrated care providers. Substance Abuse Treatment, Prevention, and Policy, 8(34), 1–10. DOI:
https://doi.org/10.1186/1747-597X-8-34
9. Hu, S., Dong, S. C, Zhao, Y. H., Hu, H. and Li, Z. H. (2013). Assessing potential spatial accessibility of health
services in rural China: A case study of Donghai County. International Journal for Equity in Health, 12(1), 1–11.
DOI: https://doi.org/10.1186/1475- 9276-12-35
10. Jenberg, L. (2020). Health E-News. Covid-19 Pandemic: Panic or Preparation? https://health-
e.org.za/2020/02/27/covid-19-pandemic-panic-or-preparation/ Accessed April 13 2020
11. Ma, , Luo, N., Wan, T., Hu, C. and Peng, M. (2018). An improved healthcare accessibility measure considering the
temporal dimension and population demand of different ages. International Journal of Environmental Research
and Public Health, 15(2421). DOI: https://doi.org/10.3390/ijerph15112421
12. Makombo, T. (2016). Fast Facts: Public health sector in need of an antidote. Fast Facts, 6 (298),
13. Mansour, S. (2016). Spatial analysis of public health facilities in Riyadh Governorate, Saudi Arabia: A GIS-based
study to assess geographic variations of service provision and accessibility. Geo-spatial Information Science,
19(1), 26–38. DOI: https://doi.org/10.1080/10095020.2016.1151205
14. Mokhele, T., Weir-Smith, G. and Labadarios, D. (2012). Development of health density indicators in South Africa
using GIS. GeoInformation Society of South Africa (GISSA) Conference Proceedings, 110–116.
15. Munoz, U. H. and Källestål, C. (2012). Geographical accessibility and spatial coverage modeling of the primary
health care network in the Western Province of Rwanda. International Journal of Health Geographics, 11(40), 1–
11.
16. Khashoggi, F. and Murad, A. (2020). Issues of Healthcare Planning and GIS: A Review. International Journal of
Geo-Information, 9 (352), 1–27.
17. Naidoo, K., Singh, J. and Lalloo, U. (2013). Critical analysis of ICU/HC beds in South Africa: 2008-2009. South
African Medical Journal, 103(10), 751-753. DOI: https://doi.org/10.7196/SAMJ.6415
18. Nkonki, and Fonn, S. (2020). Decisive and strong leadership and intersectoral action from South Africa in
response to the COVID-19 virus. South African Medical Journal, 110(5), 339-340. DOI:
https://doi.org/10.7196/SAMJ.2020.v110i5.14739
19. Norrestad, (2020a). Trust in the handling of the COVID-19 outbreak of the health system in Denmark 2020.
https://www.statista.com/statistics/1105447/trust-in-the-handling-of- the-covid-19-outbreak-of-the-health-
system-in-denmark/ Accessed 16 May 2020.
20. Norrestad, (2020b). Trust in the handling of the COVID-19 outbreak of the health system in Finland 2020.
https://www.statista.com/statistics/1105457/trust-in-the-handling-of-the- covid-19-outbreak-of-the-health-
system-in- nland/ Accessed 16 May 2020.
21. Robin, A., Khan, M. A., Kabir, N., Rahaman, S. T., Karim, A., Mannan, I. I., George, J. and Rashid, I. (2019). Using
spatial analysis and GIS to improve planning and resource allocation in a rural district of Bangladesh. BMJ
Global Health, 4, e000832. DOI: https://doi.org/10.1136/bmjgh-2018-000832
22. Rosero-Bixby, (2004). Spatial access to health care in Costa Rica and its equity: A GIS- based study. Social
Science and Medicine, 58, 1271–1284.
Page 14/1723. Siegel, , Koller, D., Vogt, V. and Sundmacher, L. (2016). Developing a composite index of spatial accessibility
across different health care sectors: A German example. Health Policy, 120, 205–212.
24. Stata Corp. (2017). Stata Statistical Software: Release 15. College Station, TX: StataCorp LLC.
25. Stats SA. (2019). Mid-year population estimates 2019. Pretoria: Statistics South
26. van der Heveer, A. (2020). COVID-19 Bed Supply. Dataset.
27. van Heerden, , Msweli, S. and van Rooyen, H. (2015). “Men don’t want things to be seen or known about them”: A
mixed-methods study to locate men in a home based counselling and testing programme in KwaZulu-Natal,
South Africa. African Journal of AIDS Research, 14(4), 353–359. DOI:
https://doi.org/10.2989/16085906.2015.1121881
28. (2020). Strengthening the health system response to COVID-19: Recommendations for the WHO European
Region. Policy brief, (1 April 2020). World Health Organisation.
29. Wilson, M., Brow, R., Playfair, R. and Errasti-Ibarrondo, B. (2018). What Is the “Right” Number of hospital beds for
palliative population health needs? Societies, 8(108), 1-7. DOI: https://doi.org/10.3390/soc8040108
30. Zhang, , Dong, X., Cao, Y., Yuan, Y., Yang, Y., Yan, Y., Akdis, C. A. and Gao, Y. (2020). Clinical characteristics of 140
patients infected with SARS-CoV-2 in Wuhan, China. Allergy: European Journal of Allergy and Clinical
Immunology, 1–12. DOI: https://doi.org/10.1111/all.14238
Figures
Page 15/17Figure 1
Percentage of people who indicated they believe that the health system was able to manage the COVID-19 outbreak
Page 16/17Figure 2
Hospital and hospital beds densities, Left: a) number of hospitals per 100 000 people and right: b) number of
hospital beds per 10 000 people
Figure 3
ICU beds densities, Left: a) number of ICU beds per 10 000 people and Right: b) number of ICU beds per 10 000
elderly people
Page 17/17You can also read