Jet Zero Consultation: Evidence and Analysis - GOV.UK
←
→
Page content transcription
If your browser does not render page correctly, please read the page content below
Jet Zero Consultation: Evidence
and Analysis

etting

                              July 2021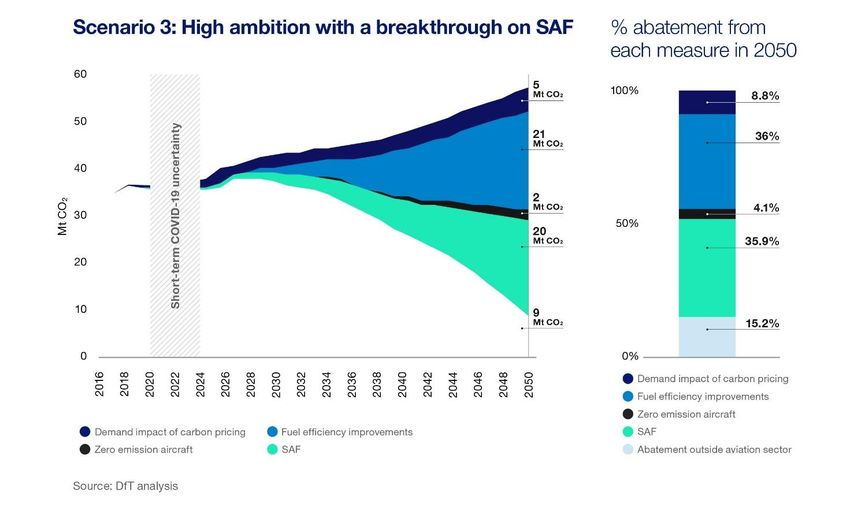
Department for Transport
Great Minster House
33 Horseferry Road
London
SW1P 4DR

© Crown copyright 2021

This publication is licensed under the terms of the Open Government Licence v3.0 except
where otherwise stated. To view this licence, visit
www.nationalarchives.gov.uk/doc/opengovernment-licence/version/3/ or contact,
The National Archives at www.nationalarchives.gov.uk/contact-us.

Where we have identified any third party copyright information you will need to obtain
permission from the copyright holders concerned.

This publication is also available on our website at
www.gov.uk/government/organisations/department-for-transport

Any enquiries regarding this publication should be sent to us at
www.gov.uk/government/organisations/department-for-transport
Contents

1. Introduction                                                             4
2. Measures to deliver net zero                                             5
  System Efficiency                                                         5
  Sustainable Aviation Fuels (SAF)                                          5
  Zero Emission Flight                                                      6
  Markets and Removals                                                      7
  Influencing Consumers                                                     9
3. Pathways to net zero                                                     10
  Scenario 1: Continuation of current trends                                11
  Scenario 2: High ambition                                                 13
  Scenario 3: High ambition with a breakthrough on SAF                      14
  Scenario 4: High ambition with a breakthrough on zero emission aircraft   16
4. Summary                                                                  19
Annex A: Modelling net zero                                                 21
References                                                                  24
Jet Zero Consultation: Evidence and Analysis

1. Introduction

1.1 The Jet Zero Consultation sets out the principles for delivering aviation net zero by
    2050 and outlines the range of solutions needed to reach this goal. It is expected
    that net zero will be achieved through a mix of different technologies, including the
    adoption of sustainable aviation fuels (SAF) and the use of zero emission flight (ZEF)
    and all parts of the sector will need to work together. However, many of the
    technologies needed to achieve net zero aviation are in the early stages of
    development and there is significant uncertainty regarding the expected cost,
    availability and uptake of these technologies over the coming decades.

1.2 This supporting analytical document summarises evidence provided by the Climate
    Change Committee (CCC), industry, academics, and others, on the potential
    emissions reductions, uptake and cost of abatement measures in aviation. Based on
    this evidence, we have modelled four different scenarios1 with a different mix of
    technologies to illustrate different pathways for reaching net zero aviation by 2050.

                                                                                              4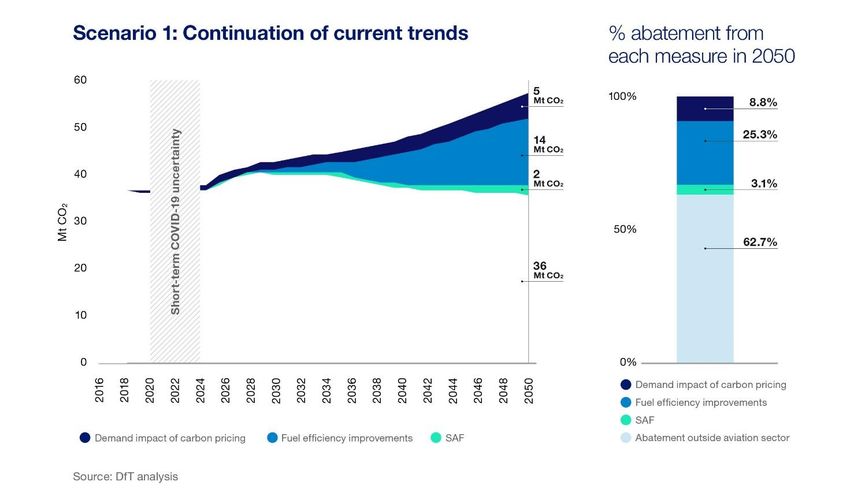
Jet Zero Consultation: Evidence and Analysis

2. Measures to deliver net zero

2.1 This section summarises the evidence on abatement potential and costs for each of
    the five measures highlighted in the consultation.

System Efficiency
2.2 For the purposes of this analysis, the term ‘system efficiency’ is used to encompass
    both improvements in existing engine and airframe design (such as more efficient
    engines and lighter materials), and also operational improvements (such as air traffic
    control improvements and efficiencies at airports).

2.3 Research by Air Transportation Analytics (ATA)2, commissioned by the Government
    jointly with the CCC, suggested that efficiency improvements such as these could
    reduce the fuel burn of aircraft coming into service in the mid-2040s by 40-50%
    compared to types entering service in the early 2000s. Over the period from 2017-
    2050 this translates to a fuel efficiency improvement of between 1.5 and 2.0% per
    annum (for the ‘Likely’ and ‘Optimistic’ scenarios referenced in the research). This is
    in line with both long-run historic rates of fuel efficiency improvement, and with
    current and future industry ambitions. According to the International Council on Clean
    Transportation (ICCT), 1960-2008 saw 1.5% annual fuel efficiency improvement on
    average3 (though this does mask variation over time). The International Air Transport
    Association (IATA) set a target of 1.5% annual fuel efficiency improvement from
    2009-20204, which the Air Transport Action Group (ATAG) suggest has been
    surpassed5, while The International Civil Aviation Organisation (ICAO) has set a goal
    of 2% annual fuel efficiency improvement through to 20506.

2.4 The ATA research also found that the fuel cost savings from the more efficient
    technology and practices considered, outweigh the capital and ongoing costs of
    implementing them and reduce costs for airlines and passengers at the same time as
    reducing emissions.

Sustainable Aviation Fuels (SAF)
2.5 Current SAF use in UK aviation is negligible7 and there is significant uncertainty
    around the availability and cost of SAF in the future. While certain SAF production
    pathways from waste oils and fatty acids are already commercial, the vast majority of

                                                                                               5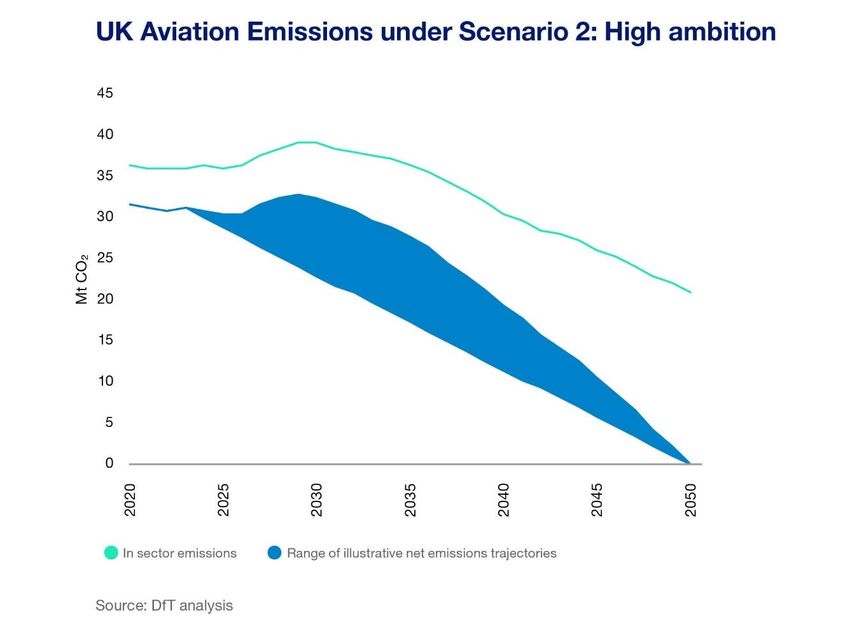
Jet Zero Consultation: Evidence and Analysis

      SAF technologies have been certified and proven at demonstration stage but have
      yet to be rolled out at commercial scale.

2.6   Different SAF pathways differ in their lifecycle emissions savings, and not all SAF is
      necessarily sustainable, for example, due to the emissions, or direct and indirect land
      use change potentially arising from the production, cultivation and transportation of
      the feedstocks. To comply with the Renewable Transport Fuel Obligation8, SAF must
      meet strict sustainability criteria including limits on the types of feedstocks and land
      biomass which SAF can be produced from, and a requirement to reduce greenhouse
      gas (GHG) emissions by at least 60% relative to a set fossil fuel comparator.

2.7 A wide range of estimates exist in the literature as to what the future uptake of SAF
    could look like. Analysis by E4Tech for Sustainable Aviation9 suggests that, if UK
    SAF production grows in line with global forecasts, SAF could provide just over 30%
    of UK aviation fuel demand in 2050. More optimistically, the World Economic Forum
    (WEF) Clean Skies for Tomorrow report10 finds that advanced and waste feedstocks
    alone could supply almost 500 Mt of SAF per year by 2030, which amounts to 120%
    of projected 2030 global jet fuel demand. There are likely to be competing demands
    for these feedstocks from other sectors, so high uptake rates in aviation are likely to
    be as dependent on cross-economy prioritisation decisions as on the total availability
    and use of feedstocks.

2.8 The costs of SAF are high and uncertain. A recent ICCT report suggested that, in
    general, SAF is around two to three times the cost of kerosene, and potentially up to
    eight times the cost of kerosene for certain pathways (for example Alcohol-to-Jet)11.
    Based on a range of evidence, we estimate the abatement costs of SAF to currently
    be broadly in the range of £200-600/tCO2 , though it is expected that these should fall
    over time as production scales up. The ICCT has found that used cooking oil-derived
    HEFA is currently the most cost-effective SAF pathway, at an abatement cost of
    €200/tCO2e (or around £170/tCO2e), followed by gasification of municipal solid waste
    and lignocellulosic feedstocks, at around €400-500/tCO2e (or £350-430/tCO2e). The
    WEF Clean Skies for Tomorrow report suggests that production costs could fall by
    20-70% by 2050, depending on the fuel pathway, mainly driven by economies of
    scale and reductions in the cost of input feedstocks.

Zero Emission Flight12
2.9 Both hydrogen-powered and all-electric aircraft may have the potential to reduce
    tailpipe carbon-emissions from flights over shorter distances by 100%, provided the
    hydrogen and electricity is produced sustainably. These emerging technologies are
    still in the early stages of development for use in commercial fleets, however industry
    experts believe that they could start to play a role within the next decade, with 2035
    often suggested as a plausible entry-into-service (EIS) date for short-haul zero
    emission aircraft that could carry a significant number of passengers.

2.10 IATA13 expects that from 2035 battery-powered all-electric aircraft will enter the
     market for short-haul flights, while Wright Electric14 is aiming for a single-aisle electric
     aircraft (carrying up to 186 passengers on short and medium haul routes) to enter
     service in 2030. For hydrogen, the Clean Sky 2 report15 suggests that hydrogen-
     powered commuter-regional aircraft could enter service from 2030, with hydrogen-

                                                                                                  6
Jet Zero Consultation: Evidence and Analysis
powered aircraft making up 40% of all aircraft by 2050 in their ‘Efficient
decarbonisation scenario’ and 60% in their ‘Maximum decarbonisation scenario’. In
September 2020, the first test flight of a commercial-grade, hydrogen-electric plane
took place16, while Airbus revealed three concepts for hydrogen-powered zero
emission commercial aircraft which they aim to bring to market by 203517. ZeroAvia18
is aiming to bring to market the first hydrogen-electric powertrain suitable for aircraft
up to 19-seats by 2023 and to scale this technology to power a 100-seat single-aisle
aircraft by 2030, with a vision to power 200+ seater aircraft from 2040.
2.11 However, the timelines for zero emission flight are still uncertain and depend on
continual progression in battery, fuel cell and liquid hydrogen propulsion
technologies. There is currently limited available evidence on the costs of these
technologies. For hydrogen, the Clean Sky 219 report suggests abatement costs
could be $40-80/tCO2e (or around £30-55/tCO2e) for regional aircraft and $160-
350/tCO2e (or around £110-250/tCO2e) for long-range aircraft. These costs assume
hydrogen will be widely adopted and the necessary infrastructure and fuel supply
systems will be available. Any substantial difference in capex costs of hydrogen
aircraft or longer refuelling times would increase these abatement cost estimates. In
the initial years, as the technology first begins rolling out on commercial aircraft, it is
likely that the abatement costs will be considerably higher than these estimates. In
the Destination 205020 study, the abatement cost for Hydrogen aircraft is estimated to
be €225/tCO2 (or around £195/tCO2).
Markets and Removals
Markets
2.12 Market-based economic measures will play an important part in reducing the
emissions from the aviation sector in a cost-effective way. Schemes which place a
price on carbon via tradeable permits or offsetting obligations will increase costs to
airlines. Airlines are likely to pass at least some of these costs on to consumers 21 in
the form of increased ticket prices and this may reduce demand for air travel,
depending on the scale of the price increase and on how price sensitive consumers
are. There is likely to be some variation in this reduced demand between long-haul
and short-haul flights as passengers on short-haul flights tend to be more price
sensitive. Some airlines may also make different decisions about the extent to which
to pass costs onto consumers22.
2.13 As of 1st January 2021, CO2 emissions from UK domestic flights, flights from the UK
to the European Economic Area (EEA) and flights between the UK and Gibraltar are
covered by the UK Emissions Trading Scheme (ETS). The UK ETS has important
design features to guard against instability in the early years of the market including
an Auction Reserve Price (ARP) and the Cost Containment Mechanism (CCM).
2.14 The transitional ARP is set at £22 and is the minimum price for bids in primary-UK
ETS auctions. At the other end of the scale, the CCM is intended to mitigate
sustained high prices and is more responsive than its equivalent in the EU ETS,
providing a powerful tool for the UK ETS Authority to intervene if prices are elevated
for a sustained period. In 2021 and 2022, the CCM will be triggered if the average
allowance price on the end of year futures market is 2 times and 2.5 times
7Jet Zero Consultation: Evidence and Analysis
respectfully, the average carbon price in the UK for the preceding 2-year period, for 3
consecutive months23.
2.15 The UK ETS secondary market and the first UK ETS auction took place on the 19 th of
May. The first auction fully cleared at a price of £43.99 and the first day of trading
closed, with the December-21 contract at £45.2524. However, the trajectory
that the price of UK ETS allowances will follow in the future is uncertain.
For example, this will depend on the outcome of the planned consultation to
appropriately align the UK ETS cap with a net zero trajectory.
2.16 International flights between participating states are also subject to the International
Civil Aviation Organization’s Carbon Offsetting and Reduction Scheme for
International Aviation (CORSIA). CORSIA is a global market-based measure to
address CO2 emissions from international aviation, aimed at achieving ICAO’s
medium-term climate goal of Carbon Neutral Growth from 2020
(CNG2020), 88 states volunteered to participate in CORSIA from the start of the Pilot
Phase from 1 January 202125 including the UK. Future prices of CORSIA eligible
emission units are also uncertain. In 2016, estimates for 2020 used in ICAO
analysis ranged from $6/tCO2e to $20/tCO2e26. However, these estimates are
considerably higher than the prices of CORSIA eligible emission units in
recent years27.
2.17 We have reflected the in-sector impacts of a carbon price fluctuation in our modelling.
We have not sought to assess the full impact of these schemes on CO2 emissions
across the economy i.e. taking account of emissions reductions outside of the
aviation sector, due to the uncertainty around the trajectory of these impacts to 2050.
2.18 As noted above, there is uncertainty surrounding the values to use when modelling
future carbon prices. For this analysis, BEIS’s traded carbon value series to 2050,
taken from guidance on valuing GHG emissions for appraisal, has been used28.
These values are slightly higher than BEIS’s short-term carbon values for modelling
series up to 2030 which estimate the future cost of purchasing allowances under the
EU ETS29. More generally, the value the government places on changes in carbon
emissions is currently under review, now that the UK has increased its domestic and
international ambitions by committing to net zero. Accordingly, current BEIS central
carbon values are likely to undervalue GHG emissions in the long term, though the
scale of undervaluation is still unclear, as they are consistent with the UK’s old
decarbonisation target of 80% reduction in emissions by 2050. The potential impact
of placing a higher value on GHG emissions has been explored by using the existing
BEIS high carbon values series in our scenarios, in addition to the prescribed central
values30.
Removals
2.19 A report by the Royal Society and Royal Academy of Engineers found that
greenhouse gas removals (GGRs) could reach a potential of 50 MtCO2 of bioenergy
with carbon capture and storage (BECCS) and 25 MtCO2 of direct air carbon capture
and sequestration (DACCS) in the UK in 2050, alongside a further 50 Mt of other
types including land-based solutions such as biochar31. BEIS is currently updating its
evidence based on the deployment potentials for these technologies, and figures are
8Jet Zero Consultation: Evidence and Analysis
subject to change. GGRs will likely be necessary to compensate residual emissions
from several of the hardest to abate sectors in the economy, including the aviation
sector. In the CCC’s report on the Sixth Carbon Budget, their ‘Balanced Pathway’
scenario suggests that approximately 97 Mt32 of removals could be needed across
the economy (including up to 23 Mt of these to compensate for residual emissions
from aviation). Deployment trajectories are inherently uncertain; however, our
analysis suggests that there would be sufficient GGR capacity to offset the residual
aviation emissions that are estimated in all the scenarios we present below. We
define residual emissions as those which remain after efforts to decarbonise the
aviation sector have been made.
2.20 Cost estimates vary widely due to the early stage of these technologies, the
uncertainty surrounding potential cost reductions over time and the predicted
capacity of GGRs that will be required to reach net zero. At the lower end, in their
Sixth Carbon Budget report, the CCC suggest that BECCS costs could be around
£50-160/tCO2e removed, and DACCs costs around £120-£180/tCO2e removed in
205033. Research by Vivid Economics, which considers how GGRs may support a
net zero target, finds the costs of BECCS may be around £80-230/tCO2, and DACCS
around £160-470/tCO234. The costs of GGRs are therefore in a similar range to those
of SAF and, given that some later generation SAF pathways rely on captured carbon
as a feedstock, it is possible that GGRs will be cheaper and more cost-effective than
SAF in future. However, further factors such as the sustainability of feedstocks and
energy requirements for GGRs must also be considered when determining the extent
to which they can be deployed to compensate residual emissions from the aviation
sector.
Influencing Consumers
2.21 In order to achieve the CCC’s proposed demand limit of a 25% increase in
passenger numbers on today’s levels by 2050, our modelling suggests a carbon
price substantially higher than £600/t could be necessary. However, given the current
evidence on the costs of SAF and hydrogen, we think before carbon prices reached
this level, they would be sufficient to incentivise technologies to reach net zero GHG
emissions by 2050.
2.22 This analysis suggests that capping demand may not be necessary to reduce
emissions to levels which can be offset by GGRs to achieve net zero (such as the
level suggested by the CCC’s Balanced Net Zero Pathway, 23 Mt in 2050). There is
much uncertainty however, and clearly there could be many combinations of
technology improvements, GGR costs and demand growth which would achieve net
zero. The challenge is to provide the right incentives and support to achieve this aim
in the least restrictive and most cost-effective way possible.
9Jet Zero Consultation: Evidence and Analysis
3. Pathways to net zero
3.1 Based on the policy framework set out in the consultation document, where we
prioritise in-sector abatement and ensure that any residual emissions are offset, we
have modelled four scenarios that seek to illustrate alternative possible ways in
which UK aviation could reach net zero by 205035. The scenarios are based on
different assumptions about how the measures available to reduce carbon emissions
might evolve. The assumptions made about how much abatement each measure
could deliver have been informed by the available evidence summarised in the
previous section.
3.2 The scenarios presented here are not prescriptive. The uncertainty surrounding the
future costs of the measures mean that it is not possible to assess the relative cost
effectiveness of the scenarios. The optimal mix of measures will become clearer over
the coming decade as the relevant technologies mature and evidence of their relative
costs improves. Achieving net zero will also rely heavily on a collaborative,
international effort and these scenarios should be viewed in that context - these
scenarios will not be possible based on domestic action alone.
3.3 In our analysis, as a simplifying assumption recognising the uncertainty surrounding
future carbon prices, all of our scenarios assume a common carbon price is applied
to all flights departing from the UK. Whilst this is not reflective of the current policy
landscape, this illustrates the impacts of our ambition to ensure that the carbon
pricing policies covering UK aviation are consistent with meeting our net zero goals.
Apart from the application of a carbon price, none of our scenarios assume any
additional demand management measures.
3.4 All scenarios are compared to a 'Policy-Off' baseline where there is no carbon price,
no action on SAF or zero emission aircraft, and only minor annual efficiency
improvements. In this case, total UK aviation emissions reach around 57 MtCO2 in
2050.
3.5 Our scenarios are based on 2017 DfT forecasts of passenger demand and therefore
do not take into account the impact of COVID-19 on aviation demand. To address the
short-term fall in emissions, an uncertainty band has been added to the graphs
covering 2020-2024. However, it is likely that the impacts of COVID-19 on passenger
behaviour and demand will continue to be felt long after this. For example, Waypoint
2050 estimates that long-term global air traffic forecasts could be around 16% lower
10Jet Zero Consultation: Evidence and Analysis
in 2050 than previously predicted36. This is a key limitation of our scenarios and
should be considered when interpreting the results.
Scenario 1: Continuation of current trends
3.6 This scenario represents a continuation of current trends in UK aviation. There is no
step-up in ambition on SAF or annual efficiency improvements, nor any introduction
of zero-emission aircraft. This scenario does, however, include a carbon price on
international flights that are not currently captured by the ETS and this will require
significant effort and international cooperation to achieve.
Is Assumptions Rationale / Source
Demand 60% increase in passengers 2017 published DfT aviation forecasts38
by 205037.
Carbon price BEIS central carbon price on BEIS guidance on carbon valuation39
all flights, reaching
£231/tCO2 in 2050 (2018
prices)
Capacity Updated airport See ‘Modelling Net Zero’ section for
assumptions further detail
Fuel efficiency 1.5% pa (2017-2050) Based on central case from ATA
improvements research40. This is within the range of
average historic improvements and
future expectations41.
SAF uptake 5% of total aviation fuel use Based on expert judgement and external
in 2050 evidence42
Zero emission techNone by 2050 Based on more conservative views
uptake about the trajectory for zero emission
aircraft, whereby they do not enter the
fleet at a significant level until 2050 at
the earliest.
Figure 1. Assumptions in Scenario 1
Key Challenges
3.7 While this scenario should be relatively easy to achieve, there are still some
uncertainties and deliverability challenges surrounding the assumptions. Firstly, a
common carbon price is assumed to apply to all flights departing the UK, however,
currently, different carbon prices are applied: domestic flights, flights from the UK to
EEA countries, and flights between the UK and Gibraltar are included under the UK
ETS; while international flights from the UK or its territories are subject to CORSIA,
subject to certain exemptions. CORSIA only applies until 2035 and offset prices are
currently much lower than those expected in the UK ETS. Secondly, though in line
with historic trends, our assumptions on efficiency may not be met if airlines don’t
have significant funds to invest in new aircraft (e.g. due to the financial impact of
COVID-19 on the aviation industry). Finally, for this scenario to be cost-effective and
consistent with net zero, the costs of GGRs will need to be low relative to those of in-
11Jet Zero Consultation: Evidence and Analysis
sector abatement measures, meaning it remains more cost-effective to offset the
majority of emissions.
Results
3.8 This scenario results in around 36 Mt CO2 of residual emissions in 2050, which will
need to be abated outside of the aviation sector in order to reach net zero emissions.
While passenger numbers grow by around 60% on 2018 levels (from 273 million
terminal passengers in 2018 to 466 million in 2050), emissions remain fairly constant
over the time horizon due to the impact of continuous fuel efficiency improvements
and the small uptake of sustainable fuels.
3.9 Although there is a long-run trend towards greater levels of carbon pricing, it may be
overly ambitious in this scenario to assume the carbon price on all flights reaches the
same level. To account for this, we have also explored how different the results
would be if we only assume a carbon price on flights within the UK and EEA (the
current scope of the UK ETS), as a conservative assumption. This results in residual
emissions being 3 Mt higher in 2050.
Figure 2. Scenario 1 – Continuation of current trends
Figure 3. Comparison of Scenario 1 to 2018 aviation emissions
Year 2030 2040 2050
Change on 2018 CO2 emission +6% -2% -5%
levels 43
12Jet Zero Consultation: Evidence and Analysis
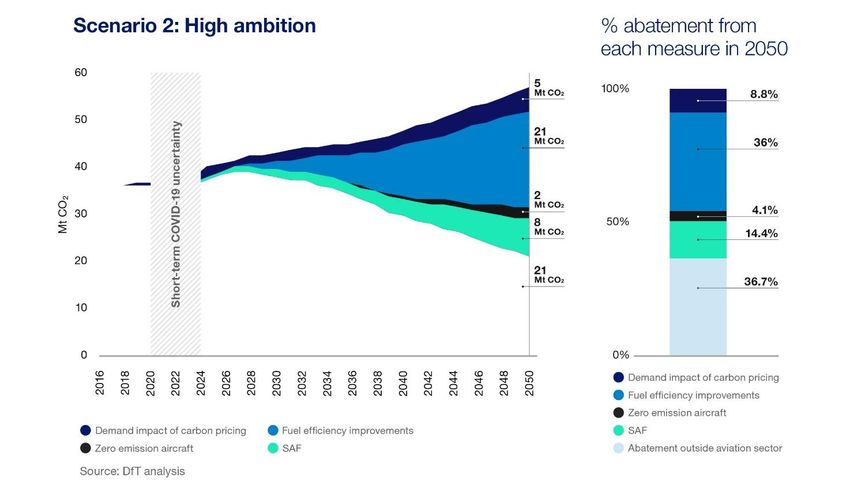
Scenario 2: High ambition
3.10 This scenario is more ambitious than Scenario 1. It includes the same assumptions
on demand, carbon price and capacity but there is a step-up in ambition on efficiency
improvements, SAF uptake and the introduction of zero-emission aircraft.
Assumptions Rationale / Source
Demand 60% increase in 2017 published DfT aviation forecasts
passengers by 2050.
Carbon price BEIS central carbon price on BEIS guidance on carbon valuation
all flights, reaching £231/tCO2
in 2050 (2018 prices)
Capacity Updated airport assumptions See ‘Modelling Net Zero’ section for
further detail
Fuel efficiency 2.0% pa (2017-2050) Based on optimistic scenario from
improvements ATA research and in line with ICAO
aspirational goal44
SAF uptake 30% by 2050 In line with the Sustainable Aviation
SAF Roadmap45 and the CCC’s
Balanced Net Zero Pathway46
Zero emission 21% of ATMs47 zero-emission Entry into service for zero emission
tech uptake by 2050 Class 1 & 2 planes (Jet Zero Consultation: Evidence and Analysis
Results
3.12 As with Scenario 1, passenger numbers reach 466 million in 2050. More ambitious
assumptions on efficiency and SAF uptake, alongside the introduction of some zero
emission aircraft, mean that residual emissions in 2050 are much lower, at 21 Mt
CO2. While zero emission aircraft enter the fleet in 2035, these have a minimal
impact on total emissions in 2050. This is because these only enter into service on
the shortest routes, and standard replacement rates mean that only 21% of all ATMs
(air traffic movements) are zero emission by 2050, making up just 12% of total ATM-
kms in 2050. However, within the domestic market, 41% of ATMs are zero emission
in 2050.
Figure 5. Scenario 2 – High ambition
Figure 6. Comparison of Scenario 2 to 2018 aviation emissions
Year 2030 2040 2050
Change on 2018 CO2 +3% -19% -45%
emission levels
Scenario 3: High ambition with a breakthrough on SAF
3.13 The third scenario is a speculative scenario in which carbon prices prove to be higher
than under Scenario 2 and SAF emerges as a more cost-effective solution,
comprising a very high proportion of aviation fuel usage by 2050.
14Jet Zero Consultation: Evidence and Analysis
Assumptions Rationale / Source
Demand 58% increase in 2017 published DfT aviation forecasts50
passengers by 2050 adjusted for BEIS high carbon price
Carbon price BEIS high carbon price, BEIS guidance on carbon valuation51
reaching £346/tCO2
in 2050 (2018 prices)
Capacity Updated airport See ‘Modelling Net Zero’ section for
assumptions further detail
Fuel efficiency 2.0% pa Based on optimistic scenario from ATA
improvements research and in line with ICAO
aspirational goal52
SAF uptake 75% by 2050 Based on a range of upper estimates for
SAF uptake in external evidence53
Zero emission 21% of ATMs zero- Entry into service for zero emission Class
tech uptake emission by 2050 1 & 2 planes (Jet Zero Consultation: Evidence and Analysis
Just 9 Mt of residual emissions remain in 2050, which will need to be abated outside
the aviation sector. The higher carbon price has a limiting effect on demand, such
that terminal passenger numbers reach 461 million in 2050. However, this does not
have a significant impact on carbon emissions, as demand is diverted away mostly
from flights in the domestic and short-haul markets (which make up a lower share of
emissions − domestic flights produced just 4% of 2019 UK aviation emissions), due
to the fact that, on average, in these markets more of the high carbon price is passed
through to passengers, ticket prices are lower and passengers are more price
sensitive.
Figure 8. Scenario 3 – High ambition with a breakthrough on SAF
Figure 9. Comparison of Scenario 3 to 2018 aviation emissions
Year 2030 2040 2050
Change on 2018 CO2 0% -28% -77%
emission levels
Scenario 4: High ambition with a breakthrough on zero
emission aircraft
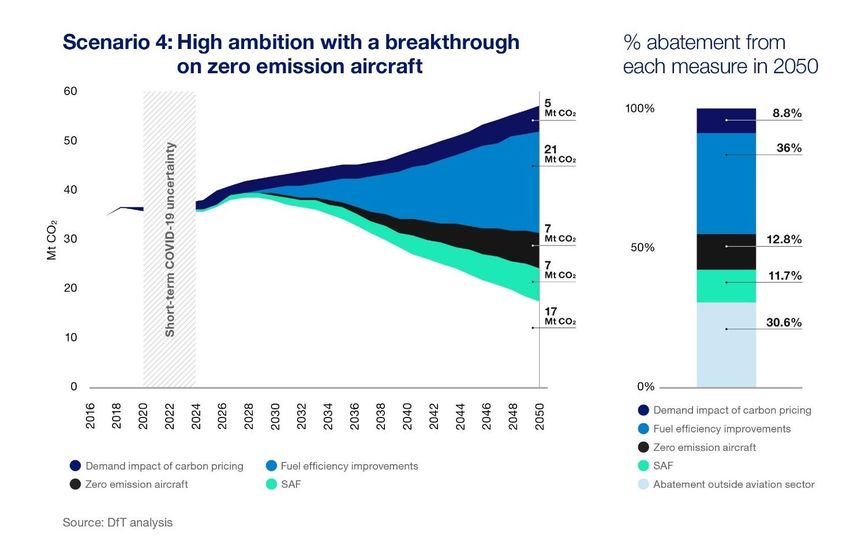
3.16 The final scenario considered is a speculative scenario in which carbon prices are
higher than under Scenario 2 and there is a significant advance in zero emission
technology (far higher than past rates of improvement in battery technology),
alongside an acceleration of current aircraft replacement rates. SAF uptake is kept
consistent with Scenario 2.
Assumptions Rationale / Source
Demand 58% increase in 2017 published DfT aviation forecasts54,
passengers by 2050 adjusted for BEIS high carbon price
16Jet Zero Consultation: Evidence and Analysis
Carbon price BEIS high carbon price, BEIS guidance on carbon valuation55
reaching £346/tCO2
in 2050 (2018 prices)
Capacity Updated airport See ‘Modelling Net Zero’ section for further
assumptions detail
Fuel efficiency 2.0% pa Based on optimistic scenario from ATA
improvements research and in line with ICAO aspirational
goal56
SAF uptake 30% by 2050 Broadly in line with the Sustainable
Aviation SAF Roadmap57 and the CCC’s
Balanced Net Zero Pathway58
Zero emission 53% of ATMs by 2050 All retiring class 1 and class 2 aircraft
tech uptake replaced by zero emission aircraft from
2030, further 50% of retiring class 3 aircraft
replaced with zero emission aircraft from
2035. Early retirement of certain aircraft
types in 204059.
Figure 10. Assumptions used in Scenario 4
Key Challenges
3.17 In order for such a scenario to be feasible, a number of challenges will need to be
overcome. For example, a step change in battery density improvements and other
technological advancements will be required (enabled by a greater investment in
R&D), certification and safety regulations will need to keep up with new technologies
as they emerge, airport infrastructure (e.g. re-fuelling infrastructure for hydrogen and
electricity supply for charging electric aircraft) will need a coordinated change to
facilitate the use of new aircraft types, and airlines will need to be able to quickly
incorporate new aircraft types into their fleets. For hydrogen specifically, the
development of a hydrogen strategy and supply-chain across the economy is crucial.
Furthermore, for both electric and hydrogen aircraft, the costs of these technologies
will ultimately need to fall so that zero emission aircraft offer a cost-effective
approach to decarbonisation, relative to using SAF or GGRs.
Results
3.18 The requirement for removals in 2050 is 17 MtCO2 in this scenario. Class 3 (150-250
seat) zero emission aircraft enter into service from 2040, at accelerated replacement
rates. These aircraft still operate mainly on domestic and short-haul routes, meaning
that although 53% of ATMs are zero emission by 2050, only 34% of ATM-kms are
zero emission. Passenger numbers are the same as in Scenario 3 (reaching 461
million in 2050).
17Jet Zero Consultation: Evidence and Analysis
Figure 11. Scenario 4 – High ambition with a breakthrough on zero emission aircraft
Figure 12. Comparison of Scenario 4 to 2018 aviation emissions
Year 2030 2040 2050
Change on 2018 CO2 +1% -25% -54%
emission levels
18Jet Zero Consultation: Evidence and Analysis
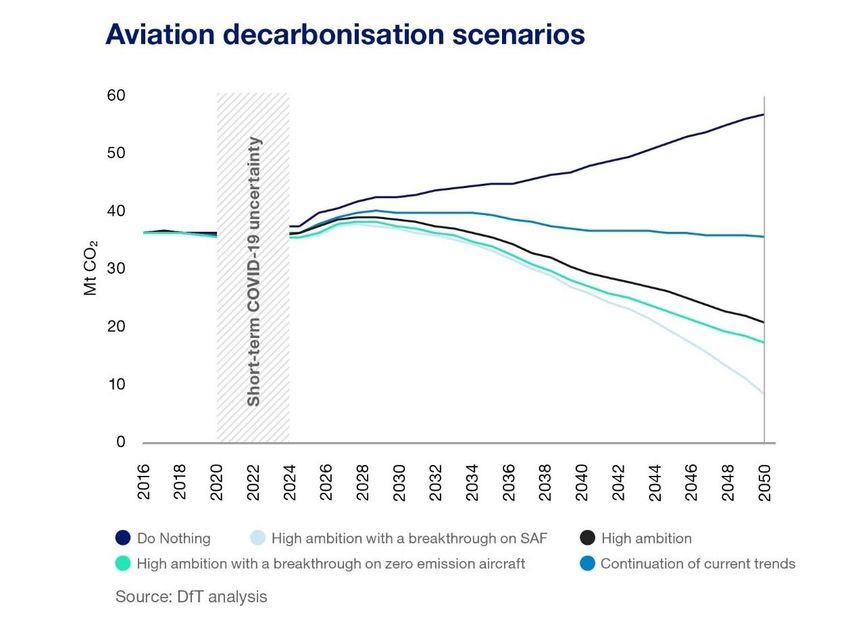
4. Summary
4.1 As shown in Figure 13, the four scenarios we have modelled result in residual in-
sector emissions of between 9 Mt and 36 Mt in 2050. The scenarios show that
significant in-sector abatement could be possible if we make substantial progress
with new technologies. However, making the required technological progress will be
very challenging and there are many barriers that will need to be overcome,
especially for the final two scenarios. Our trajectories also indicate that aviation net
zero can be met by 2050 with future capacity assumptions consistent with Making
Best Use policy and the Airports National Policy Statement.
Figure 13. In-sector aviation decarbonisation scenarios
4.2 All scenarios see residual emissions from aviation remaining in 2050, though these
are lower in some scenarios than others. Therefore, for aviation to meet net zero,
19Jet Zero Consultation: Evidence and Analysis
some abatement outside the sector will be required. A band of illustrative net
emissions trajectories for aviation is presented in Figure 14, for Scenario 260. We
have presented a range to reflect alternative ways in which a net trajectory could be
defined. The ultimate shape of this trajectory will depend on the development of
market-based measures and removal technologies.
Figure 14. Illustrative net emissions trajectory under Scenario 2
Figure 15. Comparison of net emissions trajectory to 2018 aviation emissions
Year 2030 2040 2050
Change on 2018 CO2 -14 to -39% -49 to -70% -100%
emission levels
4.3 There is significant uncertainty surrounding the abatement potential, uptake and
costs of the measures described in this document and therefore these scenarios
should be seen as illustrative pathways rather than forecasts. Achieving the
emissions reductions shown in these scenarios will also require substantial
international effort and cooperation. International cooperation will also minimise risks
of carbon leakage and adverse impacts on the competitiveness of UK industry.
4.4 We will continue to build our evidence base on the costs and potential of these
measures and the scenarios analysis will be reviewed alongside the overall strategy
every five years. We will also seek to analyse the impacts of domestic and
international policy as they develop.
4.5 We would welcome any views on the range of scenarios we have presented or any
additional evidence. These can be fed in via the Jet Zero Consultation.
20Jet Zero Consultation: Evidence and Analysis
Annex A: Modelling net zero
A.1 Our analysis uses the Department's aviation model, which is also used by the CCC.
The model forecasts air passenger demand for UK-departing flights and allocates
across the UK's airports based on a number of factors, including a passenger's final
destination, location of and accessibility to airports, availability of flights, travel times,
costs, and the capacity of airports to accommodate projections of passengers and
flights to 2050 and beyond.61
A.2 CO2 forecasts are produced by combining these outputs with assumptions about the
future fuel efficiency of planes. These assumptions are based on a fleet model, which
determines the size and type of aircraft for any given flight, and the fuel efficiency of
these aircraft.
A.3 The modelling of the emissions scenarios presented here does not explicitly take
account of the costs of different measures due to uncertainty. The modelling does
however take account of the impact of the carbon price, and so implicitly assumes
that the cost of the measures (/tCO2e) are less than the carbon price assumed in
each scenario.
A.4 The version of the model used for this analysis is based on the 2017 version of the
model which is described in detail in the DfT's 2017 forecast publication62. The
forecasts are therefore subject to update given the availability of new data since
2017. Some updates have already been made. These are described below:
Airport capacity assumptions.
A.5 In June 2018, the Government set out its support for airports to make best use of
their existing runways63 (“MBU”) and a new runway in the South East in the Airports
National Policy Statement, subject to related economic and environmental
considerations. We have revised the capacity assumptions in our modelling to reflect
this, while also updating capacities for several airports where more up-to-date
evidence has become available. Our assumptions also reflect plans for a third
runway at Heathrow (with a phased introduction).
A.6 The capacity assumptions that have been made are not intended to pre-judge the
outcome of future planning applications. However, in order to conduct the modelling,
specific assumptions have to be made on a number of inputs, including about the
21Jet Zero Consultation: Evidence and Analysis
future capacity of the main airports in the UK. In line with a precautionary approach to
the level of future carbon emissions, and to reflect the uncertainty around future
developments in this area, we have assumed capacities that are consistent with the
planning applications that have been made by airports, and also increased the
capacity of others where our forecasting suggests there will be significantly higher
demand in the future. Increasing capacity limits in this way allows us to focus the
analysis on testing the potential of abatement technologies to meet the challenge of
net zero, without capacity constraints arbitrarily restricting demand.
A.7 The modelling scenario that we have used should not therefore be seen as a
prediction of what DfT thinks will happen with regard to future capacity expansion,
but as a reasonable upper bound of possible future airport capacity levels and
therefore associated emissions, in order to better test the potential of measures to
meet net zero.
Updated fleet mix modelling assumptions.
A.8 DfT recently updated the fleet mix component of the aviation model to better reflect
the age profile of aircraft operating in the UK. This is the module that forecasts the
type of aircraft that service the flights predicted by the model.
Revised fuel efficiency assumptions
A.9 DfT, jointly with the CCC, commissioned research from a consortium of academics
and industry experts to examine the scope for fuel efficiency improvements of the
fleet used in UK aviation64. This includes improvements from engine and airframe
design, operational measures that are within the control of airlines and air traffic
management. We have used this analysis as an input to our modelling. Our
modelling also includes the positive rebound impact on demand due to efficiency
improvements lowering the costs of flying.
SAF
A.10 Uptake of SAF is not calculated within the aviation model, instead an uptake
trajectory is assumed and fed into the CO2 model as an input. To calculate this
trajectory, we make an assumption on the proportion of SAF in 2050 and fit an
exponential uptake up to this point, to reflect the fact that progress is likely to be
backloaded. We assume 100% CO2 emission savings for the aviation sector for
these fuels. This is consistent with the approach taken by the CCC and is in line with
formal GHG accounting rules65.
Zero emission aircraft
A.11 Zero emission aircraft enter the modelling via the Fleet Mix Model. Two new
hypothetical aircraft types (one for Class 1 and 2, one for Class 3) with zero tailpipe
emissions are modelled to enter the fleet from 2030-35, and replace existing aircraft
in these classes at existing replacement rates (22-25 years). For scenario 4, early
replacement of class 3 Airbus A319Neo, Airbus A320Neo, Boeing 737 Max 8, and
22Jet Zero Consultation: Evidence and Analysis
Boeing 737 Max 9 is assumed (as these are the main aircraft forecast to be operating
in this class at this time).
23Jet Zero Consultation: Evidence and Analysis
References
1
Details on these can be found in chapter 3
2
ATA (2018) Understanding the potential and costs for reducing UK aviation emissions.
https://assets.publishing.service.gov.uk/government/uploads/system/uploads/attachment_data/file/785685/ata-potential-and-costs-
reducting-emissions.pdf
3
ICCT Efficiency trends for New Commercial Jet Aircraft 1960-2008.
https://theicct.org/sites/default/files/publications/ICCT_Aircraft_Efficiency_final.pdf
4
https://www.iata.org/en/programs/environment/climate-change/
5
ATAG Factsheet (January 2019) Tracking Aviation Efficiency. https://aviationbenefits.org/media/166506/fact-sheet_3_tracking-
aviation-efficiency.pdf
6
ICAO Environment. On Board A Sustainable Future https://www.icao.int/environmental-
protection/Documents/ICAOEnvironmental_Brochure-1UP_Final.pdf
7
No SAF has been claimed from the UK under the ETS as of yet, but BP currently supply at three sites
(http://biomassmagazine.com/articles/17871/air-bp-scores-a-hattrick-of-saf-projects-at-3-new-uk-locations) and Signature supply SAF at
Luton airport (https://www.signatureflight.com/about/newsroom/details/2020/12/08/signature-flight-support-neste-and-netjets-celebrate-
the-official-launch-of-sustainable-aviation-fuel-with-ceremonial-first-gallons-at-sfo-and-ltn-airports)
8
https://www.gov.uk/guidance/renewable-transport-fuels-obligation
9
Sustainable Aviation (2018) Sustainable Aviation Fuels Roadmap. https://www.sustainableaviation.co.uk/wp-
content/uploads/2018/06/SA-SAF-Roadmap-FINAL-24-Nov-2.pdf
10
WEF (2020) Clean Skies for Tomorrow: Sustainable Aviation Fuels as a Pathways to Net-Zero Aviation.
http://www3.weforum.org/docs/WEF_Clean_Skies_Tomorrow_SAF_Analytics_2020.pdf#:~:text=The%20World%20Economic%20Forum
%E2%80%99s%20Clean%20Skies%20for%20Tomorrow,the%20transition%20to%20net-%20zero%20flying%20by%20mid-century.
11
ICCT (2019) The cost of supporting alternative jet fuels in the European Union.
https://theicct.org/sites/default/files/publications/Alternative_jet_fuels_cost_EU_20190320_1.pdf (Costs quoted are in 2018 prices)
12
The term ‘zero emission flight’ is used here to refer to aircraft which produce no tailpipe carbon emissions. Emissions produced during
the production stage of the aircraft are not included.
13
IATA Aircraft Technology Roadmap to 2050
https://www.iata.org/contentassets/8d19e716636a47c184e7221c77563c93/technology20roadmap20to20205020no20foreword.pdf
14
https://www.weflywright.com/wright-1
15
Clean Sky 2 (2020) Hydrogen-powered aviation. A fact based study of hydrogen technology, economics, and climate impact by 2050.
https://www.cleansky.eu/sites/default/files/inline-files/20200507_Hydrogen-Powered-Aviation-report.pdf
16
ZeroAvia (September 2020) ZeroAvia completes the world first hydrogen-electric passenger plane flight.
https://www.zeroavia.com/press-release-25-09-2020
17
Airbus (September 2020) Airbus reveals new zero-emissions concept aircraft https://www.airbus.com/newsroom/press-
releases/en/2020/09/airbus-reveals-new-zeroemission-concept-aircraft.html
18
https://www.zeroavia.com/
19
https://www.cleansky.eu/sites/default/files/inline-files/20200507_Hydrogen-Powered-Aviation-report.pdf
20
https://www.destination2050.eu/wp-content/uploads/2021/03/Destination2050_Report.pdf
21
Koopmans, C. C., & Lieshout, R. (2016). Airline cost changes: to what extent are they passed through to the passenger? Journal of
Air Transport Management, 53(June), 1-11
22
https://assets.publishing.service.gov.uk/government/uploads/system/uploads/attachment_data/file/439688/strategic-fit-scarcity-rents-
and-airport-charges.pdf
23
https://www.gov.uk/government/publications/uk-emissions-trading-scheme-markets/uk-emissions-trading-scheme-markets
24
The latest UK ETS auction prices can be found here: https://www.theice.com/marketdata/reports/278
25
https://www.icao.int/environmental-protection/CORSIA/Documents/CORSIA_States_for_Chapter3_State_Pairs_Jul2020.pdf.
26
https://www.icao.int/environmental-protection/pages/a39_corsia_faq3.aspx
27
https://openknowledge.worldbank.org/handle/10986/33809
28
https://www.gov.uk/government/publications/valuation-of-energy-use-and-greenhouse-gas-emissions-for-appraisal
29
https://www.gov.uk/government/publications/updated-short-term-traded-carbon-values-used-for-modelling-purposes-2018
30
This is consistent with current guidance: https://www.gov.uk/government/publications/tag-forthcoming-changes-to-carbon-
values/forthcoming-change-interim-carbon-values-for-scheme-appraisal
31
Royal Society and Royal Academy of Engineering (2018) https://royalsociety.org/-/media/policy/projects/greenhouse-gas-
removal/royal-society-greenhouse-gas-removal-report-2018.pdf
32
CCC (2020) The Sixth Carbon Budget: The UK’s Path to Net Zero. https://www.theccc.org.uk/wp-content/uploads/2020/12/The-Sixth-
Carbon-Budget-The-UKs-path-to-Net-Zero.pdf
24Jet Zero Consultation: Evidence and Analysis
33
CCC (2020) The Sixth Carbon Budget: The UK’s Path to Net Zero. https://www.theccc.org.uk/wp-content/uploads/2020/12/The-Sixth-
Carbon-Budget-The-UKs-path-to-Net-Zero.pdf
34
Vivid Economics (2019) Greenhouse Gas Removal (GGR) policy options – Final report. https://www.vivideconomics.com/wp-
content/uploads/2019/09/Greenhouse_Report_Gas_Removal_policy_options.pdf
35 For the purposes of this analysis, we have only modelled CO2 emissions. There are other emissions associated with aviation and the
inclusion of these will be considered for future iterations of this analysis.
36
ATAG (2020) Waypoint 2050. https://aviationbenefits.org/media/167187/w2050_full.pdf
37
In the absence of updated official aviation forecasts, which are expected later this year, all scenarios are based on our 2017 published
forecasts. As such they do not account for the impact of COVID-19 on the aviation industry.
38
Department for Transport (2017) UK Aviation Forecasts.
https://assets.publishing.service.gov.uk/government/uploads/system/uploads/attachment_data/file/878705/uk-aviation-forecasts-
2017.pdf
39
https://www.gov.uk/government/publications/valuation-of-energy-use-and-greenhouse-gas-emissions-for-appraisal
40
ATA (2018) Understanding the potential and costs for reducing UK aviation emissions.
41
ICCT report that 1960-2008 saw, on average, 1.5% annual fuel efficiency improvement (though this does mask variations over time).
IPCC (1999) assume 1.4% annual fuel efficiency improvements between 2000 and 2040. IATA set a target of 1.5% annual fuel
efficiency improvement from 2009-2020, which ATAG suggest has been surpassed.
42
5% baseline figure supported by a Ricardo study (2017), based on expert judgement and evidence from E4Tech and CCC. Also in
line with RTFO ambitions (no explicit target for aviation but extrapolating the development fuels target out to 2050 suggests a level of
around 5%).
43
2018 CO2 emissions for UK aviation were 37.8 Mt. https://www.gov.uk/government/statistics/final-uk-greenhouse-gas-emissions-
national-statistics-1990-to-2019
44
ICAO goal of “2% annual fuel efficiency improvement through 2050” https://www.icao.int/environmental-
protection/Documents/ICAOEnvironmental_Brochure-1UP_Final.pdf
45
Sustainable Aviation (2019) Sustainable Aviation Fuels Roadmap. https://www.sustainableaviation.co.uk/wp-
content/uploads/2018/06/SA-SAF-Roadmap-FINAL-24-Nov-2.pdf
46
CCC (2020) The Sixth Carbon Budget: The UK’s Path to Net Zero. https://www.theccc.org.uk/wp-content/uploads/2020/12/The-Sixth-
Carbon-Budget-The-UKs-path-to-Net-Zero.pdf
47
Air Traffic Movements (ATMs) represent a take-off or a departure.
48
2035 often suggested as a plausible Entry-Into-Service date for short-haul zero carbon aircraft. IATA’s technology roadmap expects
that from 2035 there will be market entry for battery-powered aircraft on short-haul flights. E.g. Wright Electric (in partnership with
EasyJet) is aiming for an electric aircraft (carrying 150 passengers, up to 290 nautical miles) to enter the market by 2035. The Clean
Sky 2 report into hydrogen-powered aviation suggests that hydrogen-powered commuter-regional aircraft could also enter into service
by 2035. E.g. Airbus have recently revealed concepts for hydrogen-powered zero-emissions aircraft, which could enter service by 2035.
ZeroAvia predict 200+seat zero-carbon aircraft is achievable by 2040.
49
https://www.theccc.org.uk/publication/biomass-in-a-low-carbon-economy/
50
Department for Transport (2017) UK Aviation Forecasts.
https://assets.publishing.service.gov.uk/government/uploads/system/uploads/attachment_data/file/878705/uk-aviation-forecasts-
2017.pdf
51
https://www.gov.uk/government/publications/valuation-of-energy-use-and-greenhouse-gas-emissions-for-appraisal
52
ICAO goal of “2% annual fuel efficiency improvement through 2050” https://www.icao.int/environmental-
protection/Documents/ICAOEnvironmental_Brochure-1UP_Final.pdf
53
CCC’s “Tailwinds” scenario, Waypoint 2050’s “Aggressive sustainable fuel deployment” scenario and the Destination 2050 roadmap
all suggest SAF uptake of somewhere between 75% and 100% (by volume) by 2050
54
DfT (2017) UK Aviation Forecasts.
https://assets.publishing.service.gov.uk/government/uploads/system/uploads/attachment_data/file/878705/uk-aviation-forecasts-
2017.pdf
55
https://www.gov.uk/government/publications/valuation-of-energy-use-and-greenhouse-gas-emissions-for-appraisal
56
ICAO goal of “2% annual fuel efficiency improvement through 2050” https://www.icao.int/environmental-
protection/Documents/ICAOEnvironmental_Brochure-1UP_Final.pdf
57
Sustainable Aviation (2019) Sustainable Aviation Fuels Roadmap. https://www.sustainableaviation.co.uk/wp-
content/uploads/2018/06/SA-SAF-Roadmap-FINAL-24-Nov-2.pdf
58
CCC (2020) The Sixth Carbon Budget: The UK’s Path to Net Zero. https://www.theccc.org.uk/wp-content/uploads/2020/12/The-Sixth-
Carbon-Budget-The-UKs-path-to-Net-Zero.pdf
59
Certain aircraft are retired early for modelling purposes and to ensure that the total uptake of zero-carbon aircraft by 2050 is
approximately in line with the figures suggested in the ‘Maximum decarbonisation’ scenario in the Clean Sky 2 report. Affected aircraft
types are Airbus A319Neo, Airbus A320Neo, Boeing 737 Max 8, Boeing 737 Max 9.
60
This analysis assumes that the current emissions savings from market-based measures, notably the UK ETS are 5 MtCO2 per year, in
line with analysis from the Final Stage Aviation EU ETS Impact Assessment:
https://assets.publishing.service.gov.uk/government/uploads/system/uploads/attachment_data/file/685816/Aviation_EU_ETS_-
_Final_Stage_Impact_Assessment.pdf
61
More information on the DfT aviation model can be found here https://www.gov.uk/government/publications/uk-aviation-forecasts-
2017. This includes information regarding which airports and route group zones are included in the model, both domestically and
internationally.
62
https://www.gov.uk/government/publications/uk-aviation-forecasts-2017
63
https://assets.publishing.service.gov.uk/government/uploads/system/uploads/attachment_data/file/714069/making-best-use-of-
existing-runways.pdf
64
ATA (2018) Understanding the potential and costs for reducing UK aviation emissions.
25You can also read