Australian Aviation and COVID-19
Analysis of support and impact

                                   January 2021
←
→
Page content transcription
If your browser does not render page correctly, please read the page content below

Australian Aviation and COVID-19
Analysis of support and impact
January 2021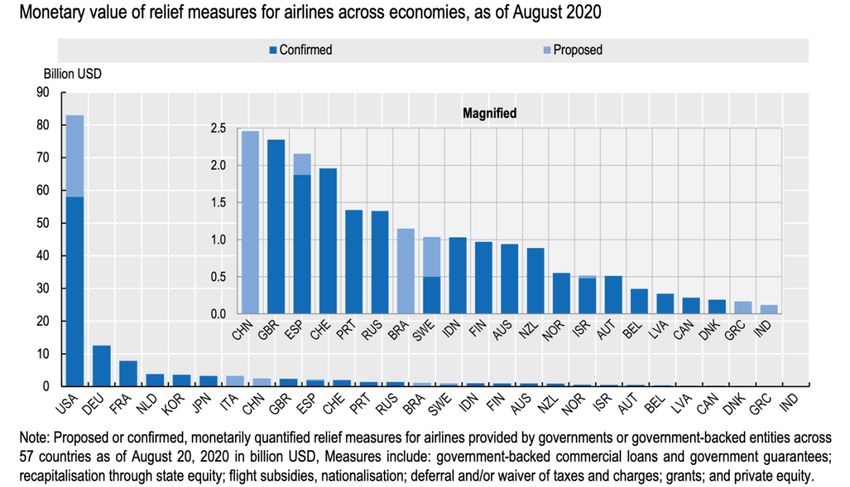
About this report

This report seeks to quantify the impacts of COVID-19 on the Australian aviation industry,
assess the extent of government support provided to the industry, and to quantify the
importance of aviation to Australian communities.

This work builds upon our June 2020 report Australian Aviation After COVID-19: the need for
an Australian Aviation Plan.

This report was commissioned by the International Transport Workers’ Federation.

                                                                                             2
Table of Contents
1. – 2020: An unprecedented year .................................................................................... 4
   Air travel to and from Australia has virtually stopped ............................................................... 5
   Domestic travel has also slowed ............................................................................................... 5
   Aviation is a big employer of Australians .................................................................................. 6
   Aviation underpins jobs across the Australian economy ............................................................ 7
2. Government support is required for the aviation sector ................................................ 9
   Many countries are offering support for their airline industries ................................................. 9
   Australia’s support for aviation is modest by international standards ...................................... 10
3. – Australian communities rely on aviation ...................................................................14
   Aviation is key part of Australia .............................................................................................. 14
   Reductions in air traffic are widespread with some regional centres hit hard ........................... 15
   Job losses in aviation reliant communities .............................................................................. 16
   Broader economic impact from minimum support for regional aviation .................................. 17
   Support in these communities is being withdrawn as JobKeeper reduces ................................ 19
Appendix 1: Characteristics of International Support Packages ........................................21
......................................................................................................................................21
   Overview of government support packages for international airlines ...................................... 21
References......................................................................................................................24

                                                                                                                                      3
1. – 2020: An unprecedented year
Key points
1. COVID-19 has decimated the aviation market globally and in Australia.
2. Australia’s usually busy skies have been quiet, and this is having an effect on jobs.
3. The aviation industry’s recovery will be much slower than the downturn, due to
the staggered reopening of international travel routes, the impacts of a broader
economic downturn, and the collapse of consumer and business confidence.
The COVID-19 crisis has re-exposed the vulnerability of global aviation networks to sudden
shocks and along with it the dependence of Australia’s economic interests on them, as an
open and liberal trading nation.
All around the world, governments have taken major steps to first contain the virus and
then put their aviation sectors on life support. By the beginning of April, at least 144
countries had enacted containment measures including shutting borders to foreigners,
ceasing international passenger flights and even closing airports.1
The impact on airlines and their supply chains of these measures was immediate and
escalated rapidly.
By mid-April, an estimated 12,400 aircraft had been placed into storage and passenger
revenues for 2020 were forecast to be down $314 billion on the previous year, a drop of
48% compared to around 16% that occurred during the GFC. The International Air
Transport Association (IATA) estimated that at the start of the year 75% of its members had
less than three months cash to cover costs2 and predicted that many will run out cash
before the recovery even begins.
IATA Impact Initial Second Third Fourth
Assessment 20 Feb3 5 March4 27 March5 14 April6
Forecast -$29.3 billion $113 billion -$252 billion -$314 billion
-4.7% -19% -28% -48%
Figure 1.1: International Air Transport Association impact assessment on the aviation industry.
The International Civil Aviation Organisation (ICAO) expects that the effects of COVID-19 on
international aviation industry to be significant. Compared to a business as usual expected
baseline, ICAO estimates that globally during the calendar year 2020 there will be a 51%
reduction in seats offered by airlines, and an overall reduction of close to 2.9 billion
passengers, resulting in a loss of gross passenger operating revenue of around
$US 390 billion.7
These losses are expected to continue, at a slightly reduced rate, over the first half of 2021.
4Air travel to and from Australia has virtually stopped
Total passenger movements to the year ending September 2020 was 52.4% lower than the
corresponding period to September 2019. 8
Incoming international passenger numbers to Australia fell precipitously during the first few
months of 2020, declining from more than 2.2 million in January, to a monthly average of
around 18,700 from April to September (see Figure 1).
Figure 1: Incoming international passengers 2019 & 2020
2,500,000
2,000,000
1,500,000
1,000,000
500,000
0
Jan Feb Mar Apr May Jun Jul Aug Sep Oct Nov Dec
2019 2020
Source: Bureau of Infrastructure and Transport Research Economics (BITRE)
The Commonwealth Budget 2020-21 assumed that international travel is expected to
remain low until the latter part of 2021. 9
Domestic travel has also slowed
According to the Bureau of Infrastructure and Transport Research Economics there was a
79.4 per cent decrease in domestic commercial aviation activity in October 2020 compared
to the same time in the previous year.
The Melbourne to Sydney route accounted for 14.6% of all domestic air passengers in
October 2019, or around 823,000 passengers in that month. In October 2020 just 11,000
passengers flew that route, a reduction of 98.7%.
5Figure 2: Domestic passengers carried - Oct 2019 vs Oct 2020
6,000,000
5,000,000
4,000,000
3,000,000
2,000,000
1,000,000
-
Oct-19 Oct-20
Source: BITRE
Aviation is a big employer of Australians
Australia’s aviation sector is a significant employer. Pre-pandemic it employed more than
40,000 direct employees at the two big airline groups and more than 50,000 10 additional
employees employed in the rest of the supply chain or by smaller carriers.
The collapse of Virgin Australia during the pandemic, the administration process and
subsequent relaunch of the airline is estimated to reduce the size of the airline’s workforce
by one-third.11
Qantas Airlines has cut around 8,500 jobs from its pre-COVID workforce.12
Jobs that the aviation sector tends to provide are typically more secure and better
remunerated than average. The Australian Government’s JobOutlook service compiles data
on earnings and jobs growth across non-managerial positions. It shows the four classes of
jobs in the sector are well remunerated, particularly when compared to other jobs of a
similar skill level.
6Table 1: Pay and job prospects for non-managerial jobs in the aviation sector
Air Transport Aircraft Aircraft Flight
Professionals13 Maintenance Baggage Attendants
Engineers Handlers and
Airline Ground
Crews
Weekly Full-Time Pay (Median) $2,558 $1,890 $1,37514 $1,340
Rank overall 13 of 306 79 of 306 166 of 306 183 of 306
Rank by skill 11 of 103 8 of 54 16 of 65 28 of 54
Anticipated Jobs Growth Moderate Stable Strong Moderate
Unemployment Lower Lower Lower Lower
Jobs 19,400 10,900 5,800 8,500
Skill level Very high Medium Lower Medium
Full-time share 78% 94% 63% 51%
Female share 9% 3% 13% 74%
Source: Australian Government JobOutlook
The sector is of course not immune to other structural inequalities embedded in the
Australian economy: for instance, with flight attendants being the lowest paid of the four
jobs despite a higher skill level, their full-time pay is on par with the national median of
$1,342.
Once the significant over-representation of females in the profession is accounted for, flight
attendant pay is actually 8.5 per cent higher than the median full-time female of $1,235 per
week in 2018.15 A reminder that aviation employers have as much work to do on improving
the gender pay gap as employers in other industries.
Aviation underpins jobs across the Australian economy
Australia’s tourism industry employs an estimated 666,000 people 16 and higher education
sector another 134,12217 and both are fundamentally dependent upon domestic and
international aviation for access to customers. On the non-services side, primary producers
of high-value perishables ranging from lobsters to dairy cannot access key markets without
reliable air freight capacity.
While Australia’s economy benefits generally from its diversification, the second-round
effects of a debilitated aviation sector can be expected to be concentrated on some regions
more than others, such as Queensland, Tasmania and the Northern Territory where tourism
is more heavily relied upon for jobs.
7Figure 3: Tourism contribution to state and territory employment
10%
9% 8.70%
8%
7.10%
7%
6.10%
6% 5.50% 5.40%
4.60% 4.80% 4.60%
5%
4%
3%
2%
1%
0%
NSW VIC QLD SA WA TAS NT ACT
Source: Tourism Research Australia18
82. Government support is required for the aviation sector
Key points
1. COVID-19 has seen countries around the world provide support for their aviation
industries
2. Government support has been vital for the aviation industry’s survival
3. The Australian Government’s support for the aviation industry is modest by
comparison
The COVID-19 economic downturn and associated travel-bans have caused existential
challenges for the airline industry globally. Across the world, national governments have
intervened, offering various forms of financial support to struggling airlines. This ranges
from direct grants, like in the United States, to the full nationalisation of Air Italia in Italy.
The McKell Institute’s mid-2020 report Australian Aviation After COVID-19: the need for an
Australian Aviation Plan undertook detailed analysis of the extent of government support
packages for the aviation industry announced as the COVID-19 pandemic unleashed.
That analysis is reproduced here, and a full update will be released with our final paper in
early 2021.
Since that report, the Federal Budget (released in October 2020) stated that the total
amount of Commonwealth assistance to the aviation sector was $2.7 billion, via the
Domestic Aviation Network Support and the Regional Airline Network Support programs. 19
Many countries are offering support for their airline industries
A majority of countries assessed have extended liquidity to private airlines, typically offering
lines of credit or a deferral of fees, taxes and charges associated with running an airline – or
a combination of both. In most cases, support packages have been conditional, and in some
cases, such as that of Singapore, have been included taking equity in the airlines
themselves.
Middle Eastern countries, such as Qatar and the United Arab Emirates, whose Qatar
Airways, Etihad Airways, and Emirates airlines are flagship carriers, have also announced
unspecified commitments guaranteeing support for those carriers. These airlines are
excluded from the following analysis due to the lack of detail.
The mean support offered by the analysed countries’ is 0.24 per cent of GDP.
Median Support as % of GDP Mean Support as % GDP Max Support as % of GDP
0.11 0.24 1.74
9Figure 4: Airline support package type of assistance
Proposed and Announced Airline Support Packages by Type of Support
(Per Cent)
5.2 5.2
5.2
15.7
52.63
15.7
Liquidity Equity Deferrals Nationalisation Grants Unspecified
Over half the international responses analysed are liquidity support in the form of loans.
Deferrals of fees and charges, and equity stakes are the second most common approaches.
Further detail is available at Appendix 1 and in the McKell Institute’s May 2020 report
Australian Aviation After COVID-19: the need for an Australian Aviation Plan.
Australia’s support for aviation is modest by international standards
Australia’s annual Gross Domestic Product is around $1,985,000 million.20
With a total aviation support from the Commonwealth at $2,700 million, this represents
approximately 0.136% of Australia’s GDP.
This compares a mean of 0.24% of GDP in support provided by countries analysed by the
McKell Institute.
Other detailed investigations into government packages for aviation relief confirms this
analysis.
According to the OECD, Australia’s support for the aviation industry ranks 18 th out of 28
countries analysed (see Figure 5)
10Figure 5: extract from OECD's COVID-19 and the aviation industry: impact and policy responses
Australia’s back of the pack status is also confirmed by analysis jointly undertaken by
economists at the World Bank, the European Commission and the Economics Research
Institute for ASEAN and East Asia.21
In their detailed analysis Abate et al (2020) demonstrate that ‘most governments give a high
priority to maintaining air transport connectivity in order to protect economic activity
and jobs, in aviation itself and in related sectors such as tourism.’
However, it is clear from the comparative analysis undertaken that the Australian
Government’s support compares poorly to that provided by the governments of other
countries.
Based on the author’s figures, the value of the Australian Government’s assistance to the
aviation industry was ranked 21st out of 38 countries analysed.
As the study authors note:
Even though the aviation sector is gradually becoming a more competitive and
market-driven industry, the role of governments in promoting national interests
through interventions in air transport at both national and international levels has
not diminished. Aviation is seen by most governments as a strategic sector closely
linked with economic development and as a result is directly or indirectly supported
across several parts of its value chain.22
11Figure 6: Extract from ‘Government support to airlines in the aftermath of the COVID-19 pandemic’
Source: Abate et al (2020)23
The World Bank has undertaken further analysis of the size of support for the aviation
industry compared to the overall size of the relevant governments’ support by way of
economic stimulus in the context of COVID-19.24
Australia ranks poorly on this comparison, with only 0.33% of our stimulus package being
spent on aviation, compared to 2.4% of the stimulus provided by the United State and New
Zealand. Full details of the comparison are in Table 2.
12Table 2: Aviation support as a percentage of COVID-19 stimulus, by country
Country Aviation Share (%) in
COVID-19 Stimulus
Latvia 39.5
Singapore 19.5
Kenya 13.9
Indonesia 6.6
Norway 6.5
Cape Verde 2.7
New Zealand 2.4
United States 2.4
Netherlands 2.3
South Korea 1.6
Egypt 1.0
Senegal 0.93
Spain 0.9
Malaysia 0.71
Morocco 0.48
Brazil 0.42
Australia 0.33
Ivory Coast 0.24
Nigeria 0.23
Burkina Faso 0.23
Germany 0.21
Canada 0.2
Austria 0.19
France 0.18
Japan 0.14
Bangladesh 0.14
Estonia 0.08
India 0.02
Source: Schlumberger, C. (2020)
133. – Australian communities rely on aviation
Key points
1. Aviation is a lifeblood for many Australian communities
2. Regional areas that rely on aviation has seen big downturns in airline passenger
traffic
3. JobKeeper has supported 376,000 workers to keep these communities afloat,
however JobKeeper reductions will hurt workers and local businesses
4. The aviation industry needs support to get flying again to prevent further job
losses in these regional communities
Aviation is key part of Australia
Australia’s geography requires aviation to keep us connected.
Commercial aviation is inevitably drawn to largest centers of economic activity. Australia’s
high level of urbanisation and wealth, as well as our geographic positioning as an island,
means Australia as a whole is unlikely ever to be at risk of not having access to aviation.
Despite Australia’s relatively small population we are home to some of the busiest and most
lucrative air routes in the world (see Table 3).
A sprawling land mass means the risk of underservicing, including misuse of market power,
is all too present for remote and regional communities. Yet fair and accessible aviation
services should be non-negotiable for all Australians to share in future opportunities and
prosperity, and if we are to maintain our unity as a federation.
Australia must ensure that our aviation networks are structured in the interest of all
Australians – in the cities and the regions - which means policy settings that recognize the
inevitable bias towards large urban centers rather than attempt to ignore them, and
respond with practical, cost effective solutions that keep Australia connected and together.
Table 3: Top 5 domestic passenger routes worldwide
Rank Route Passengers (2018) Distance (km)
1 Seoul (GMP) - Jeju (CJU) 14,107,414 449
2 Sapporo (CTS) - Tokyo (HND) 9,698,639 819
3 Melbourne (MEL) - Sydney (SYD) 9,245,392 705
4 Tokyo (HND) - Fukuoka (FUK) 8,762,547 880
5 Mumbai (BOM) - Delhi (DEL) 7,392,155 1138
Source: Routesonline and Sabre Market Intelligence25
14Reductions in air traffic are widespread with some regional centres hit hard
Analysis of airport data over the course of 2020 reveals that capital city and regional
airports have seen considerable declines in passenger movements.
The effects in capital city reductions in revenue passenger movements from the year from
September 2019 to September 2020 ranged from minus 47 per cent in Perth and Brisbane,
to minus 52% in Canberra and Melbourne (see Figure 7)
Figure 7: Change in revenue passenger movements 2019 to 2020
Change in revenue passenger movements 2019 to 2020
(year to September)
0.0%
-10.0%
-20.0%
-30.0%
-40.0%
-50.0% -47.3%
-49.2% -47.6%
-52.2% -51.7% -52.2% -51.3%
-60.0%
-70.0%
ADELAIDE BRISBANE CANBERRA DARWIN MELBOURNE PERTH SYDNEY
Source: Bureau of Infrastructure and Transport Research Economics
There are 12 non-capital city airports across Australian in the top 20 airports for passenger
movement. As Figure 8 shows the declines in regional airports have been much more varied,
from minus 29% in Karratha to minus 58% in Alice Springs.
Many of these regional communities rely on the aviation industry to bring tourists to local
businesses that employ thousands of locals.
15Figure 8: Change in revenue passenger movements 2019 to 2020 (year to September)
Change in revenue passenger movements 2019 to 2020
(year to September)
0.0%
-10.0%
-20.0%
-30.0%
-29.4%
-33.4%
-40.0% -35.5%
-40.2% -40.9%
-50.0% -47.7%
-48.6%
-50.3% -50.5% -51.7%
-53.7%
-60.0%
-60.1%
-70.0%
ALICE SPRINGS AYERS ROCK BALLINA CAIRNS
GOLD COAST KARRATHA LAUNCESTON MACKAY
NEWCASTLE ROCKHAMPTON SUNSHINE COAST TOWNSVILLE
Source: Bureau of Infrastructure and Transport Research Economics
Job losses in aviation reliant communities
Communities with airports that accommodate significant air passenger movements have
been significantly affected by job losses over the course of the pandemic.
In the 12 non-capital city airports across Australian in the top 20 airports for passenger
movement, job losses have generally been worse than their overall state average.
As the charts in
Figure 9 demonstrate, over the course of the pandemic in Queensland in the six
communities with significant airports, all had greater job losses since March compared to
the state average.
Cairns, the Gold Coast and Sunshine Coast all had payroll job numbers around two and a
half points lower than Queensland overall.
While Rockhampton and Mackay preformed better than Queensland overall during the
early part of the pandemic, by September 2020 their payroll jobs had fallen below the rate
for Queensland and were now all behind job number across the state.
16In NSW, the losses for Newcastle were on par with the overall state, however in the Ballina
area, payroll jobs were around three and a half points lower than in the state overall.
Figure 9: Change in payroll jobs since COVID-19, selected communities
Cairns, Gold Coast & Rockhampton, Townsville &
Sunshine Coast Mackay
102.0 102.0
100.0 100.0
98.0 98.0
96.0 96.0
94.0 94.0
92.0 92.0
90.0 90.0
88.0 88.0
86.0 86.0
Cairns Gold Coast Rockhampton Townsville
Sunshine Coast Australia Mackay Australia
Queensland Queensland
Ballina & Newcastle
102.0
100.0
98.0
96.0
94.0
92.0
90.0
88.0
86.0
Richmond Valley - Coastal
Newcastle
Australia
NSW
Source: ABS Weekly Payroll Jobs and Wages in Australia26
Broader economic impact from minimum support for regional aviation
There are 91,694 business who filed for JobKeeper in these regional communities heavily
reliant on aviation-driven tourism (as of August 2020 which is the latest data available).
This equates to around 375,900 local workers reliant on JobKeeper in the selected regional
communities.
17While some of these individual businesses may have since graduated from the JobKeeper
program, the scale of the uptake in these communities demonstrates a reliance on the wage
subsidy program in lieu of the economic activity driven by regional tourism.
Figure 10: JobKeeper applications in selected regional communities
JobKeeper Applications in Communities
Reliant on Aviation-Driven Tourism : April to August 2020
93,000
92,000 92,069
91,702
91,000
90,414
90,000
89,000
88,000
87,000
86,000
85,732
85,000
84,000
83,000
82,000
April Application May Application June Application July Application August Application
Count Count Count Count Count
Table 4: JobKeeper applications and supported workers in selected regional areas
Number of JobKeeper Number of Workers
Applicants Receiving JobKeeper
ALICE SPRINGS/AYRES ROCK 742 3041
BALLINA 9240 37,880
CAIRNS 5853 23,994
GOLD COAST 32,888 134,823
KARRATHA 213 873
LAUNCESTON 2451 10,047
MACKAY 2159 8850
NEWCASTLE 110,11 45,139
ROCKHAMPTON 2682 10,994
SUNSHINE COAST 19,386 79,472
TOWNSVILLE 5115 20,968
Total 91,740 376,081
18Support in these communities is being withdrawn as JobKeeper reduces
JobKeeper was a lifeline for communities across Australia when it was introduced in March.
Although some elements of the scheme design were severely deficient – namely its lack of
application to companies owned by a sovereign entity, such as dnata, and the exclusion of
recently hired casuals.
There are three phases to the JobKeeper program. Stage 1 was the initial application and
run until 28 September. From 28 September until 31 December 2020, stage two saw
payment rates reduced, and new thresholds apply. And a further set of reductions and
changes will occur from 1 January 2021 until the program is due to end on 31 March 2021.
Table 5: Value of Fortnightly JobKeeper support to selected communities
Stage 1 - March - September Stage 2 - September 28 to January 1 Stage 3 - January 1 to March 31
$ 478,802,952.40 $ 400,050,729.57 $ 347,549,247.68
As JobKeeper reduces, economic support to these aviation reliant communities will also
reduce.
Based on available data, we estimated that in the first iteration of JobKeeper, up to $478.8
million in JobKeeper support was being distributed to these selected regional communities
each fortnight. In the final iteration of January 1 – March 31, this will be reduced to
approximately $347.5 million.
As Table 6 shows, each of these regional communities will be receiving significantly less in
JobKeeper support each fortnight.
However, until the aviation industry returns to higher levels of activity, these aviation
dependant regional communities could be expected to continue to experience lower
economic activity, which could put jobs at risk.
19Table 6: Value of JobKeeper reductions in selected communities
FORTNIGHTLY RECEIPT OF JOBKEEPER
March-Sep 28 Sep-28 to Jan 1 Jan 1 to March 31
ALICE SPRINGS/AYRES $3,874,536 $3,237,263 $2,812,414
ROCK
BALLINA $48,248,950 $40,313,092 $35,022,521
CAIRNS $30,562,890 $25,535,988 $22,184,720
GOLD COAST $171,732,645 $143,486,688 $124,655,917
KARRATHA $1,112,232 $929,295 $807,337
LAUNCESTON $12,798,504 $10,693,440 $9,290,064
MACKAY $11,273,753 $9,419,477 $8,183,292
NEWCASTLE $57,496,666 $48,039,769 $41,735,170
ROCKHAMPTON $14,004,727 $11,701,267 $10,655,627
SUNSHINE COAST $101,228,804 $84,578,963 $73,479,068
TOWNSVILLE $26,709,240 $22,316,176 $19,387,467
TOTAL $ 479,042,948 $ 400,251,418 $ 348,213,597
www.mckellinstitute.org.au 20Appendix 1: Characteristics of International Support Packages
Key Points
1. International responses are typically revolved around providing liquidity to airlines.
2. Many details of international responses remain forthcoming.
Overview of government support packages for international airlines
As of April 28, 2020.
China
• The Chinese Government has offered an unspecified quantity of cash support to its
domestic airline sector, aimed to alleviate cashflow pressure.
• The international package revolves the provision of cash support for every available seat
kilometre of 0.016 yuan for routes with multiple carriers and 0.0528 yuan for routes that
a serviced by only one carrier.27
Singapore
• Singapore Airlines have received US$3.52 billion in financial support from the Singapore
Government in the form of an equity injection. A further $6.8 billion worth of ‘convertible
notes’, which are ‘bonds that can be converted into equity stakes in the company’ 28, have
been distributed to the airline.
• Singapore Airlines have also secured a $2.8 billion loan from a private lender.
• The various measures total US$13.32 billion.
Canada
• The Canadian Government have ‘promised’ support for both Air Canada and WestJet29.
• Both airlines are receiving wage subsidies as part of the Canadian Government’s broader
economic support package.
• There are reports that the airlines will receive an approximate CAD$10 billion ‘credit
bridge’ to provide liquidity during the crisis.
UK
• The United Kingdom have offered support for four airlines or airline groups: Easy Jet,
British Airways, International Airlines Group, and Virgin Atlantic.
• The package is believed to include:
o State backed credit
o A deferral or freeze of the standard air traffic control charges
o A ban on small customer refunds for a period of time
www.mckellinstitute.org.au 21o Support with the costs of labour, utilising the UK’s broader wage subsidy package.
• Though yet to be formally announced, there is an expectation that the airlines will receive
around £7.5 billion, (US$8.7 billion).
New Zealand
• The New Zealand Government have both provided liquidity to Air New Zealand, as well as
providing broader support to the airline sector to maintain freight links.
• Air New Zealand has been provided NZ$900m (US$ 534) in loans, 30 while a further
NZ$600m has been provided to ensure freight connections remain open.31
• The package is equivalent to 0.4 per cent of New Zealand’s GDP.
Finland
• The Finnish Government have offered a 600 million euro loan to Finnair, the flag-carrier.
The airline is already majority state-owned.32
• The loan guarantee is equivalent to 0.23 per cent of Finland’s GDP.
Taiwan
• The Taiwanese Government has offered both subsidies and loans to its two major carriers
– China Air and Eva Air.
• The package is worth US$994 million, and also includes waging all landing and parking
fees.33
• The package is equivalent of 0.16 per cent of Taiwan’s GDP.
United States
• The US has offered a US$32 billion support package to various airlines, which mainly
consists of direct grants to keep airlines afloat.
• The package is the equivalent of 0.14 per cent of GDP, and is expected to be extended as
the crisis continues.
Norway
• Norwegian Airlines has received support from the Norwegian Government in the form of
a US$537 million line of credit.
• The package is the equivalent of 0.09 per cent of Norway’s GDP.
India
• The Indian Government, which has offered minimal economic support during the COVID-
19 pandemic, has offered IndiGo and SpiceJet waivers and deferrals for fees and taxes
levied on the airlines34.
• The package is expected to cost around US$1.6 billion, or 0.05 per cent of GDP.
www.mckellinstitute.org.au 22South Korea
• South Korean airline Korean Air is lobbying for a US$250m line of credit, however, as of
April 22 2020, the South Korean Government is yet to formalise any direct support to the
airline or the industry.35
Sweden and Denmark (Scandinavian Airlines)
• The Governments of Sweden and Denmark are offering a combined total of US$300
million in liquidity to keep Scandinavian Airlines afloat.36
• The package is the equivalent of 0.03 per cent of the combined GDPs of Denmark and
Sweden.
Hong Kong
• The Kong Kong Government have provided waivers and deferrals of fees to Cathay Pacific,
worth a total of US$453 million.
• The package is the equivalent of 0.03 per cent of Hong Kong’s GDP.
Italy
• The Italian Government moved quickly to nationalise Alitalia, a flagship carrier that had
been struggling prior to COVID-19. The nationalisation cost 500 million euros, or US$543
million, equating to 0.02 per cent of Italy’s GDP.
www.mckellinstitute.org.au 23References
1 Travel restrictions, border shutdowns by country. (2020). Retrieved 29 April 2020, from
https://www.aljazeera.com/news/2020/03/coronavirus-travel-restrictions-border-shutdowns-country-
200318091505922.html
2 IATA Economics (2020). COVID-19 Airlines’ Liquidity Crisis. Presentation, IATA.
3 IATA Economics (2020). Initial Impact* Asessment of the novel Coronavirus. Presentation, IATA.
4 Perce, B. (2020). COVID-19 Updated Impact Assessment. Presentation, IATA.
5 IATA Economics (2020). IATA Economics’ Chart of the Week. Presentation, IATA.
6 Perce, B. (2020). COVID-19 Updated Impact Assessment. Presentation, IATA.
7 International Civil Aviation Organization (2020) Effects of Novel Coronavirus (COVID‐19) on Civil Aviation: Economic
Impact Analysis, 3 December 2020, at
https://www.icao.int/sustainability/Documents/COVID-19/ICAO_Coronavirus_Econ_Impact.pdf
8 Bureau of Infrastructure and Transport Research Economics (2020), Aviation statistics: International Aviation Activity, at
https://www.bitre.gov.au/statistics/aviation/international (retrieved 1 December 2020).
9 Commonwealth of Australia (2020), Budget Paper No, 1 - Budget Strategy and Outlook 2020-21, The Treasury, p. 2-6.
10 Aviation. (2020). Retrieved 11 May 2020, from https://nationalindustryinsights.aisc.net.au/industries/transport/aviation
11 https://www.afr.com/companies/transport/3000-jobs-to-go-as-virgin-charts-new-flight-path-20200804-p55ifm
12 https://www.qantasnewsroom.com.au/media-releases/update-on-proposed-outsourcing-of-qantas-australian-airports-
ground-handling-services/
13 Air Transport Professionals includes: 8,000 aeroplane pilots; 1,700 Air Traffic Controllers; 870 Flying Instructors; 1,100
Helicopter Pilots; 1,200 Other
14 Weekly Full-Time Pay for Other Mobile Plant Operators of which Aircraft Baggage Handlers and Airline Ground Crews
represent 44%
15 ABS: 6333.0 Characteristics of Employment, Australia, August 2019
16 ABS. (2020). ABS Catalogue 5249.0 - Australian National Accounts: Tourism Satellite Account, 2018-19.
17 Department of Education, Skills and Employment. (2020). Higher education staff FTE for 2018. Department of Education.
18 Tourism Research Australia. (2020). State Tourism Satellite Account, 2017-18. Austrade.
19 Commonwealth of Australia, Budget Strategy and Outlook: Budget Paper No. 1 2020-21, p 1-33.
20 ABS, National Accounts: National Income Expenditure and Product, Table 35.
https://www.abs.gov.au/statistics/economy/national-accounts/australian-national-accounts-national-income-expenditure-
and-product/latest-release
21 Abate, M., Christidis, P., & Purwanto A.J. (2020) ‘Government support to airlines in the aftermath of the COVID-19
pandemic’ Journal of Air Transport Management 89 (2020) at
https://doi.org/10.1016/j.jairtraman.2020.101931
22 Abate, M., ibid.
23 Abate, M., ibid.
24 Schlumberger, C. (2020) Taking off during the COVID storm: Challenges in reopening international aviation in the Asia
Pacific Region, The World Bank, 27 August 2020.
25 https://www.routesonline.com/news/29/breaking-news/286313/busiest-routes-in-the-world-the-top-100/
26 ABS (2020) Weekly Payroll Jobs and Wages in Australia - Payroll Jobs Indexes by Statistical Area Level 4 (SA4) and
Statistical Area Level 3 (SA3), at 16 December 2020, at https://www.abs.gov.au/statistics/labour/earnings-and-work-
hours/weekly-payroll-jobs-and-wages-australia/latest-release
27 China rolls out cash support to domestic, foreign airlines amid coronavirus outbreak. (2020). Retrieved 30 April 2020,
from https://www.reuters.com/article/us-health-coronavirus-china-aviation/china-rolls-out-cash-support-to-domestic-
foreign-airlines-amid-coronavirus-outbreak-idUSKBN20R1I7
28 Singapore Airlines gets $13bn lifeline as airlines beg for help. (2020). Retrieved 30 April 2020, from
https://www.aljazeera.com/ajimpact/singapore-airlines-13bn-lifeline-airlines-beg-200327052053429.html
29 George-Cosh, D. (2020). Morneau eyes credit 'bridge' for Air Canada, WestJet after energy aid - BNN Bloomberg.
Retrieved 30 April 2020, from https://www.bnnbloomberg.ca/morneau-eyes-credit-bridge-for-air-canada-westjet-after-
energy-aid-1.1423192
30 Baird, L. (2020). Air New Zealand bailed out. Retrieved 30 April 2020, from
https://www.afr.com/companies/transport/air-new-zealand-bailed-out-20200320-p54c37
31 Government support for the aviation sector | Ministry of Transport. (2020). Retrieved 30 April 2020, from
https://www.transport.govt.nz/air/government-support-for-the-aviation-sector/
32 Kaminski-Morrow, D. (2020). Finnish government agrees to guarantee €600m loan to Finnair. Retrieved 30 April 2020,
from https://www.flightglobal.com/airlines/finnish-government-agrees-to-guarantee-600m-loan-to-finnair/137430.article
33 Chua, A. (2020). Taiwan extends financial lifeline to its airlines. Retrieved 30 April 2020, from
https://www.flightglobal.com/airlines/taiwan-extends-financial-lifeline-to-its-airlines/137359.article
www.mckellinstitute.org.au 2434 India mulls up to $1.6 billion rescue plan for aviation sector after coronavirus. (2020). Retrieved 30 April 2020, from
https://economictimes.indiatimes.com/industry/transportation/airlines-/-aviation/india-mulls-up-to-1-6-billion-rescue-
plan-for-aviation-sector-after-coronavirus/articleshow/74702715.cms?from=mdr
35 Ash, L. (2020). Korean Airlines Seeking Bailout As Airlines Cut Costs - Simple Flying. Retrieved 30 April 2020, from
https://simpleflying.com/korean-airlines-bailout/
36 Nikel, D. (2020). Denmark, Sweden Governments Offer SAS $302 Million Backing Over Coronavirus Crisis. Retrieved 30
April 2020, from https://www.forbes.com/sites/davidnikel/2020/03/18/denmark-sweden-governments-offer-financial-
support-to-sas-over-coronavirus-crisis/
www.mckellinstitute.org.au 25You can also read