Environmental Life Cycle Assessment - SUMMARY - American Hardwood ...
←
→
Page content transcription
If your browser does not render page correctly, please read the page content below
Environmental Life Cycle Assessment
SUMMARY sil fuels for power generation in Australia3.
The latest U.S. forest inventory data confirms that the hard- Overall the results highlight that, from an environmental
woods used to manufacture the Seed to Seat designs are an perspective, the issue of “product miles” – sometimes used
expanding resource and that harvesting of these species is to justify preference for local materials over imported prod-
not threatening biodiversity or forest carbon storage. It takes ucts – is much less relevant when procuring wood products
less than three seconds for the five cubic meters of hard- than the relative efficiency of processing operations and
wood logs harvested to manufacture all Seed to Seat designs waste management and variations in the energy mix in the
to be replaced by new growth in the U.S. forest. processing locations.
On a cradle-to-factory-gate basis, the total GWP or “carbon The Seed to Seat products are well designed for longevity - a
footprint” of all the Seed to Seat designs is 0.54 tonnes of tribute to the skills of the designers and manufacturers and
CO2 equivalent. That’s about the same as a 2850 km drive1 to the beauty and durability of U.S. hardwoods. Long life in
and equal to the carbon emissions of the average Australian use would significantly mitigate the environmental effects of
over a nine day period2. the designs. The less need for replacement, the less repeti-
The carbon footprint of the American hardwood lumber de- tion of impacts. There is the additional benefit that long-
livered to the factory in Australia and New Zealand is better lived wood products supplement the carbon store in the
than carbon neutral. This means that other less visible ma- forest and help to keep CO2 out of the atmosphere. The six
terials have a disproportionately large impact on the carbon designs together store the equivalent of 0.41 tonnes of CO2.
footprint. Although metals, glues and coatings accounted for
only 6% of the total mass of the finished designs, they are 1. Australian average carbon emissions from new passenger and light com-
mercial vehicles were 192 g/km in 2013 according to ‘Carbon Dioxide Emis-
responsible for 23% of the total carbon footprint.
sions from New Australian Vehicles 2013’ by Australian National Transport
A relatively large share of carbon emissions and other Commission, May 2014
environmental impacts of the finished designs occurred dur- 2. Based on OECD showing Australian carbon emissions (excluding land
ing the manufacturing stage in Australia and New Zealand. use change) of 522.4 million tonnes and population of 23.5 million in 2014
Manufacturing emissions were particularly high in Australia (stats.oecd.org)
3. 94% of primary energy consumption in Australia derived from fossil fuel in
due to the lengthy time required on CNC machines with a
2013-14 - based on Australian National Energy Statistics
high power rating, combined with heavy dependence on fos- (www.industry.gov.au/Office-of-the-Chief-Economist/Pages/default.aspx)
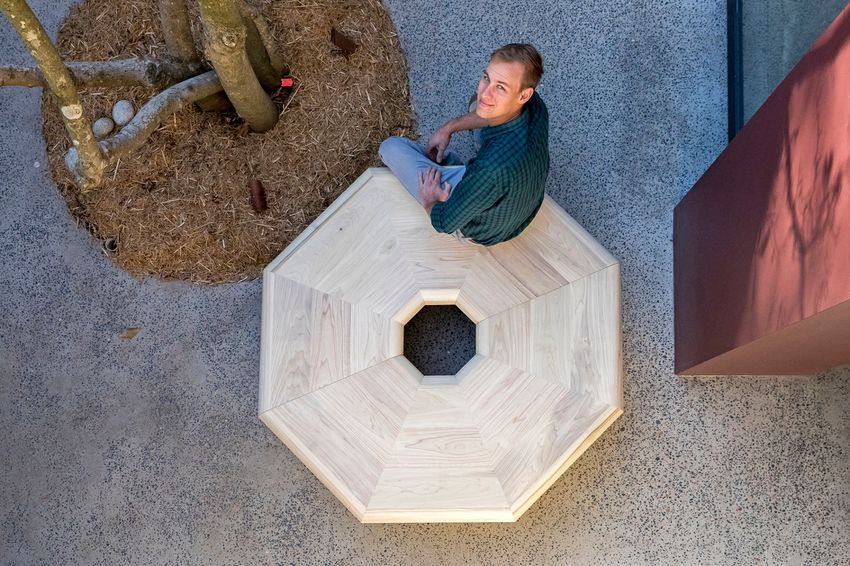
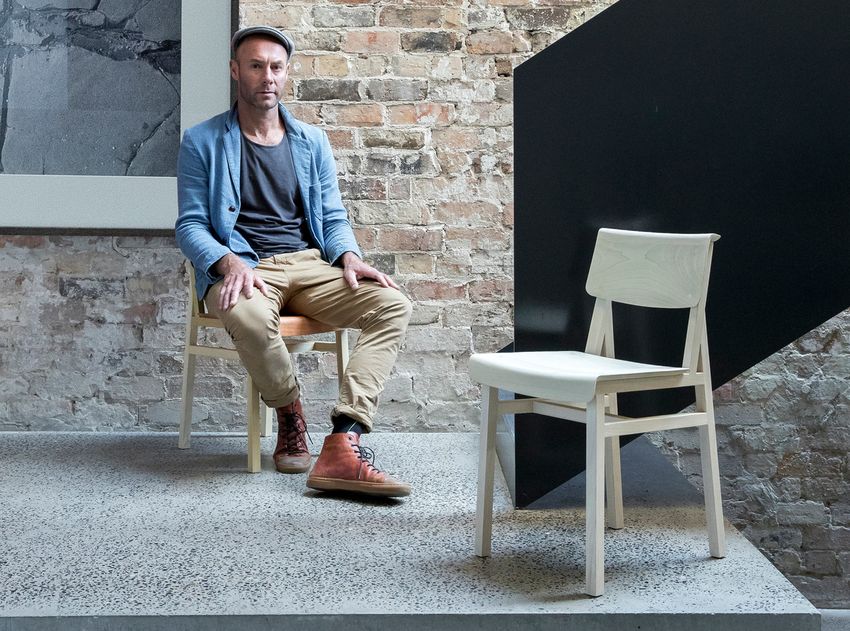
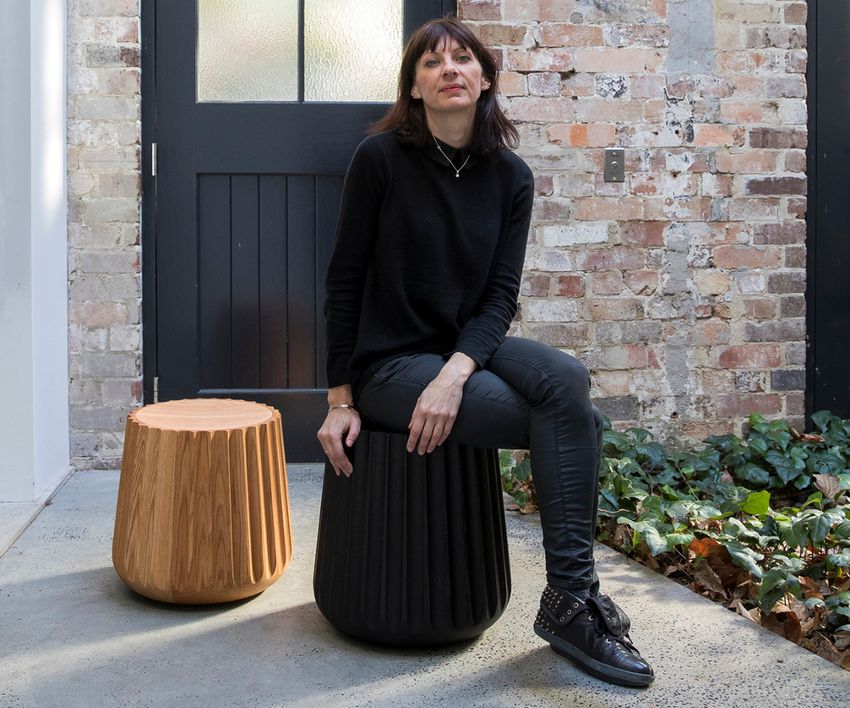
Seed to Seat designs & designers
(from left): Ben Percy,
Anne-Claire Petre,
Adam Goodrum,
Todd Hammond,
Greg Natale
Report client: Roderick Wiles, AHEC
Oceania, tel: +65 6641 2486,
email: rod@americanhardwood.org
Prepared by: Rupert Oliver, Forest Indus-
tries Intelligence, tel: +44 7553 346410,
email: rupert@forestindustries.info PHOTO CREDIT: TOM FERGUSON
INTRODUCTION                                          increased from 99 million hectares in 1953 to 111 million hectares
The Life Cycle Assessment (LCA) covers the series of six Seed to            in 2012. Area increased consistently throughout the 60-year period
Seat designs, including five manufactured by Evostyle in Australia,         and continued at a rate of 401,000 hectares per year between 2007
respectively by Anne-Claire Petre, Ben Percy, Greg Natale, Adam             and 2012. Between 2007 and 2012, the volume of hardwood stand-
Goodrum and Todd Hammond, and the Aleni bench designed and                  ing in the U.S. increased at a rate of 124 million m3 a year.
manufactured by David Trubridge in New Zealand. Figure 1 sum-               Drawing on this data, and adjusting for the differing growth rates
marises the environmental impact of all six designs on a cradle-to-         of the species used (cherry, red oak and tulipwood), it is estimated
factory-gate basis. The LCA of each individual design is provided           that it takes less than three seconds for the five cubic meters of
separately on pages 6 through to 11. Quantitatitive assessment is           hardwood logs harvested to manufacture all Seed to Seat designs
provided against six environmental impact categories of particular          to be replaced by new growth in the U.S. forest.
relevance to wood products and for which there is broad scientific          U.S. forest inventory data confirms that hardwood harvesting is not
agreement on methodology (Figure 2). There is also qualitative as-          threatening biodiversity by replacing older more diverse forests
sessment of impact on forest condition drawing on the LCA of U.S.           with plantations. In 2012, natural forests accounted for 97% of the
sawn hardwood prepared by PE International (now Thinkstep) in               area of hardwood and mixed hardwood-softwood forest types in
July 2012 and latest data from the U.S. Forest Service Forest Inven-        the U.S. and only 3% were plantations. U.S. hardwood forests are
tory and Analysis (FIA) Program.                                            also aging and more trees are being allowed to grow to size before
                                                                            being harvested. The volume of hardwood trees with diameters
                                                                            48 cm or greater increased nearly four-fold from 0.73 billion m3 in
            BIODIVERSITY AND LAND USE                                       1953 to 2.7 billion m3 in 2012.
The LCA of U.S. hardwood undertaken by PE International con-
cludes that ‘in the system under investigation the main material –
wood – comes from naturally re-grown forests. The harvested areas                 GLOBAL WARMING POTENTIAL (GWP)
had undergone several iterations of harvesting and re-growth. After         On a cradle-to-factory-gate basis, the total GWP or “carbon foot-
harvesting, the land is returned to forest so there is no direct land       print” of all the Seed to Seat designs is 0.54 tonnes of CO2 equiva-
use change to account for in the timeline of few hundred years.’            lent. That’s equal to the carbon emissions of the average Australian
On biodiversity impacts, PE International concludes: ‘conversion of         over a nine day period.
any other commercial land into the hardwood forest would most               The carbon footprint of the American hardwood lumber delivered
probably have a positive impact on the land quality including biodi-        to the factory in Australia and New Zealand is better than carbon
versity and associated ecosystem services.’                                 neutral – in the sense that the carbon stored in the wood dur-
U.S. Forest Service inventory data shows that the total area of             ing growth (0.79 tonnes of CO2 equivalent) exceeds the carbon
hardwood and mixed hardwood-softwood forest types in the U.S.               emissions during all stages of material extraction, processing and

FIGURE 1: CRADLE TO FACTORY GATE ENVIRONMENTAL IMPACT OF SIX SEED TO SEAT DESIGNS

transport from the U.S. (0.45 tonnes of CO2 equivalent). Of these during the manufacturing stage in Australia and New Zealand.
emissions, those associated with processing (52% - mostly kiln Emissions due to use of grid electricity during manufacturing were
drying) exceed those due to transport (42%) despite the extremely 0.46 tonnes of carbon dioxide equivalent. Emissions were par-
long shipping distances involved. Only 6% of carbon emissions to ticularly high in Australia due to the lengthy time required on CNC
deliver the American lumber occurred during forestry operations. machines with a high power rating, combined with heavy depend-
A large share of carbon emissions of the finished designs occurred ence on fossil fuels for power generation in Australia. 94.1% of
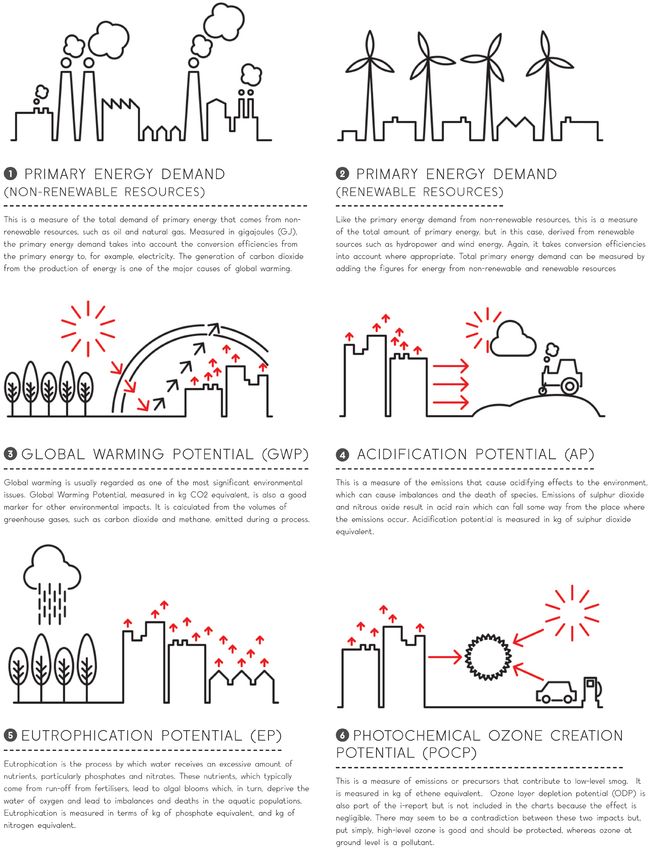
FIGURE 2: ENVIRONMENTAL IMPACT CATEGORIES
primary energy consumption in Australia derived from fossil fuel in
2013-14. This contrasts with New Zealand where 39% of primary
energy consumption in 2014 derived from renewables and only
37.8% from oil and coal.
Wood’s dual role as a material for product fabrication and as
biomass for energy production has implications for the carbon
footprint. Carbon emissions are partially offset by 0.08 tonnes of
CO2 equivalent resulting from substitution of fossil fuels through
incineration of the wood waste created during manufacturing.
Because the American hardwood used for the designs is better than
carbon neutral, other less visible materials have a disproportion-
ately large impact on the carbon footprint. Although metals, glues
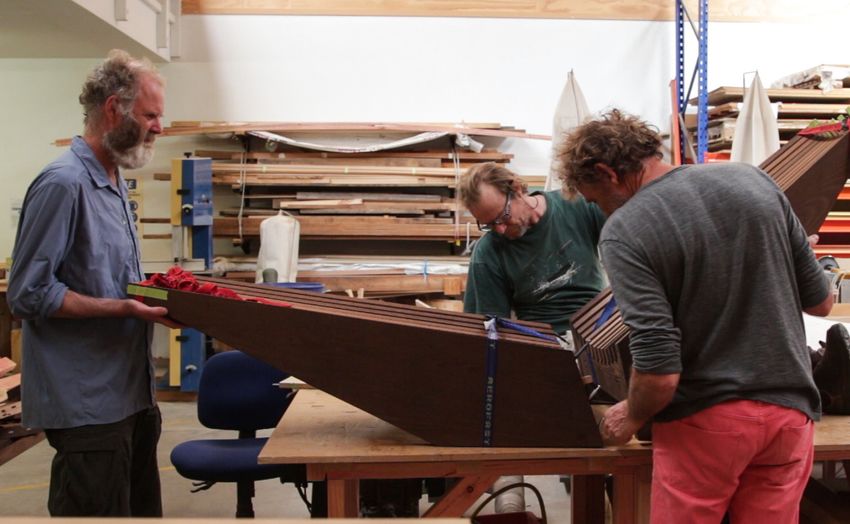
and coatings accounted for only 6% of the total mass of the finished PHOTO CREDIT: DAVID TRUBRIDGE
designs, they are responsible for 0.12 tonnes of CO2 equivalent,
23% of the total carbon footprint.
FIGURE 3: MATERIAL AND CARBON BALANCE: U.S. ACIDIFICATION POTENTIAL
The total acidification potential of all the Seed to Seat designs is
HARDWOOD DELIVERED TO FACTORY GATE 5.6 kg of SO2 (sulphur dioxide) equivalent. Acidification is caused
mainly by the burning of fossil fuels and the scale of impact is
directly related to their sulphur content.
37% of the acidification potential is due to emissions during genera-
tion of the electricity used at the manufacturing stage and is due to
the high proportion of fossil fuels, particularly coal, in the Austral-
ian energy mix.
27% of the acidification potential is due to emissions during
hardwood processing in the United States. A significant propor-
tion is due to use of grid electricity, mainly to power fans during
the lengthy kiln drying cycles. Two thirds of energy for electricity
generation in the U.S. derives from fossil fuel, half of which is coal.
Some acidification potential is also due to biomass combustion to
provide the thermal energy for kiln drying.
A further 37% of the acidification potential of the Seed to Seat
designs is due to emissions during shipping of hardwoods from
the U.S. to Australia and New Zealand and partly reflects the as-
sumptions made about sulphur content of marine fuels. The LCA
assumes an average sulphur content of 2.7% for the fuel used
on the ships transporting the wood from the U.S. This may well
1) Volume of boards delivered to the furniture factory in Australia/New be an over-estimate. It exceeds the global average figure of 2.4%
Zealand actually used for manufacture of the prototype - excludes unused estimated for 2010 by the International Maritime Organisation, an
sections of boards diverted to other product streams. Where necessary average already skewed by relatively high figures for shipping in the
mass is calculated from volume using density of boards measured on site Middle East and Asia. Progress is also being made to further reduce
(for designs manufactured by Evostyle in Australia) and standard destiny the sulphur content of these fuels under the International Conven-
of Cambia Ash taken from Cambia website (for bench manufactured by tion for the Prevention of Pollution from Ships (MARPOL) which
David Trubridge in New Zealand) sets a global target of only 0.5% from 2020 onwards.
2) Replacement time is time in seconds it takes for new growth in the
U.S. hardwood forest of the specific species to replace that required to be PHOTOCHEMICAL OZONE CREATION
harvested to supply wood for the project. It is assumed that log volume POTENTIAL (POCP)
required to be harvested is double volume of delivered boards (i.e. 50% The Seed to Seat designs have a combined POCP of 0.93 kg of
conversion efficiency from logs to boards). Hardwood forest growth data ethene equivalent. Around 85% occurs at the hardwood process-
is derived from the USDA Forest Inventory and Analysis (FIA) Program. ing stage in the U.S. and is due to emissions of terpenes, volatile
3) Data for carbon emissions is taken from updated LCA model developed organic compounds (VOCs) released from wood resins. Terpenes
by Thinkstep (formerly PE International) as part of the US hardwood LCA are released naturally as trees grow, but processes in which wood is
study commissioned by AHEC and includes all emissions from point of ex- heated (such as a kiln drying) result in more significant emissions. In
traction in the U.S. through all processing stages and transport to factory practice there is substantial variation in the level of VOC emissions
gate in Australia and New Zealand. Based on density of boards on site and between species and they also depend on drying times and on
standard industry drying practices, it is assumed that red oak is dried to other factors such as the mix of heartwood and sapwood.
10% moisture content and all other species to 12% moisture content. Most U.S. hardwood processing happens in rural areas with the
4) Biogenic carbon is the carbon stored in wood material during growth implication that terpene emissions are less likely to contribute to
and is treated as a negative emission. Due to difficulties of tracing carbon urban smog. Terpenes have a short atmospheric lifespan and the
flows at every stage of the life cycle, carbon storage is calculated directly highest photo-oxidant concentrations are expected within five
from the mass of the delivered hardwood assuming that 46% of dry mass hours after the emission takes place, and within a distance of 50
consists of carbon (where 1 kg of carbon is equivalent to 44/12 kg - i.e. km. The environmental impact of terpenes also varies widely de-
3.666 kg - of carbon dioxide). pending on the local presence of other pollutants, notably nitrogen
5) Carbon footprint is calculated as the balance between emissions and oxides. For the general public, the smell around wood-processing
biogenic (stored) carbon. A negative figure indicates carbon storage in the units is likely to be the most noticeable environmental effect.
wood exceeds all emissions associated with delivery of the boards to the Nevertheless, the photo-oxidants created due to terpene emissions
factory gate. can cause forest and crop damage, and they are harmful to humans
as they cause irritation in the respiratory tract and in sensitive
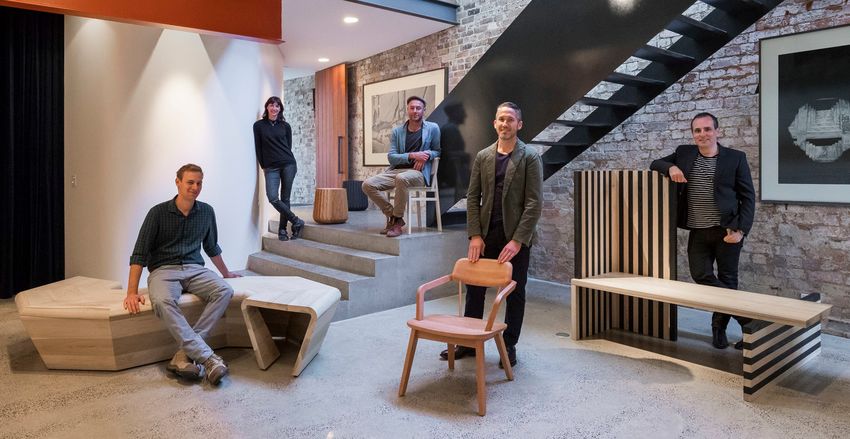
FIGURE 4: MATERIAL AND CARBON BALANCE: FINISHED DESIGN LEAVING THE FACTORY

 1) Mass of finished design in kg and quantities of non-wood materials in various units as provided by Evostyle in Australia and David Trubridge in New Zealand.
 With the exception of the Stripped bench by Greg Natale which has a brass component of estimated 5.1 kg, non-wood materials are exclusively steel screws
 and other fixings, glues and coatings. Wood content is calculated as the difference between mass of finished design and the estimated mass of non-wood
 components. Dry mass of coatings and glues is estimated to be 60% of wet mass.
 2) Due to lack of detailed data on follow-on usage and disposal, impacts of saw dust and shavings are not modelled and all impacts associated with produc-
 tion of these materials allocated to the Seed to Seat design. In the case of Evostyle in Australia, saw dust and shavings are not wasted but sent to commercial
 poultry farms to be used in bedding and then used again in gardening mix for plants.
 3) It is assumed that waste recorded by Evostyle in Australia and larger offcuts identified by David Trubridge in New Zealand are incinerated for energy produc-
 tion.
 4) Includes all emissions during extraction, processing, and transport of wood and non-wood materials to the factory gate and with manufacturing in Australia
 and New Zealand. Due to lack of detailed LCA data on non-wood materials sourced in Australia and New Zealand (including steel screws, glues, coatings, and
 brass), data is used for the closest surrogates available in the thinkstep GABI database and transport in each case is assumed to be 10000 km by ship and 1000
 km by truck (sufficient to deliver products to the factory from China for example). The analysis excludes onward delivery of the products. Due to lack of data it
 also excludes the small volumes of sandpaper and polish used during finishing.
 5) Carbon storage is calculated directly from the mass of the hardwood contained in the finished design and assumes that 46% of dry mass consists of carbon.
 This carbon will remain stored for the life-time of the design, an additional benefit of durability in hardwood products (alongside reduced need for replace-
 ment).
 6) The offset due to production of energy from incineration of wood offcuts which replaces for use of fossil fuels.
 7) Carbon footprint is calculated as the balance between emissions on the one hand, and the process waste offset and biogenic (stored) carbon on the other.

parts of the lungs. This finding highlights the need for more work                                       VALUE OF A LONG LIFE
to understand the specific impacts of terpene emissions within the                   This is not a cradle-to-grave assessment due to lack of data on
context of US hardwood kilning facilities and the actions required to                product life and disposal. However, qualitative analysis suggests the
mitigate these impacts.                                                              Seed to Seat products are well designed for longevity - a tribute to
                                                                                     the skills of the designers and manufacturers and to the beauty and
             EUTROPHICATION POTENTIAL                                                durability of U.S. hardwoods. Long-lived wood products supple-
The total eutrophication potential of all the Seed to Seat designs is                ment the carbon store in the forest and help to keep CO2 out of the
0.63 kg of phosphate equivalent – about the same as that caused                      atmosphere. The six designs together store the equivalent of 0.41
each year by conventional farming of 300 square meters of land for                   tonnes of CO2.
wheat in the UK. So while not negligible, the eutrophication poten-                  At end of life, since 95% of the mass of the Seed to Seat designs
tial is not as significant an issue for the Seed to Seat designs as the              comprise wood which can be readily separated from non-wood
acidification potential or POCP.                                                     components, the waste material may be incinerated and thereby
Perhaps surprisingly, hardly any of the eutrophication associ-                       offset use of fossil fuels (if these are still widely used at that time).
ated with the Seed to Seat designs is linked to the growth of U.S.                   These designs will therefore go a long way to fulfilling the require-
hardwood. Fertilisers are very rarely needed to encourage growth                     ments for “extended producer responsibility” whereby the manu-
of American hardwoods since they thrive under natural condi-                         facturer takes responsibility for the entire life cycle of the product,
tions. Instead, nearly all eutrophication potential of the Seed to                   especially the recycling and final disposal.
Seat designs is due to nitrate emissions during burning of fuels for
transport and processing of materials.

               PRIMARY ENERGY DEMAND
12.86 GJ of non-renewable (fossil fuel) energy is required during all
life cycle stages to finish the designs, mainly grid electricity in the
U.S. and Australia and during the transport phases.
The 16.1 GJ input of renewable energy is due partly to the high
proportion of thermal energy from burning of wood waste during
hardwood kiln drying. At least 90% of all thermal energy used for
kiln drying in the U.S. hardwood sector is derived from biomass.
The high proportion of renewable energy attributed to the forestry
stage is a feature of life cycle inventory rules for wood designs and
has nothing to do with the energy for forestry operations. It is the
solar energy absorbed by the tree during growth and converted
into chemical energy within the wood itself. In other words, it is
the energy that would have been released if the wood were burnt
immediately after harvest.                                                              PHOTO CREDIT: TOM FERGUSON
STRIPPED BENCH BY GREG NATALE
The environmental profile of the Stripped bench differs in some            bespoke furniture design, with 60% of the lumber delivered to the
notable respects from the other Seed to Seat designs. Despite              Australian factory to fabricate the bench ending up in the finished
being one of the larger pieces, the bench has the second lowest            design, 12% being utilised for energy generation, and 28% wastage
carbon footprint – at 85 kg CO2 equivalent, about the same as a 450        as sawdust and shavings.
km drive and equal to the carbon emissions of the average
Australian over a 40-hour period. Emissions of 181 kg CO2
eq. are offset by 11 kg CO2 eq. due to burning of wood
offcuts at the factory in Australia (which substituted for fos-
sil fuel) and 85 kg CO2 eq. of carbon stored in the wood.
The electrical energy required to manufacture the bench in
Australia is around half that required for the other Austral-
ian Seed to Seat designs – mainly because, unlike the other
designs, the bench requires very little time on the CNC
machine. This means that environmental impacts at other
stages of the life cycle – such as hardwood processing and
transport - are relatively more important.
The bench also utilises more non-wood materials than the
other Seed to Seat designs, including a brass strip of five
kilograms and a larger number of screw fixings. However,
American hardwood is still very dominant and the major
determinant of environmental profile.
86% of the mass of the bench comprises a mix of red oak
and tulipwood, two of the most abundant American hard-
wood species. It takes less than one third of a second for
forest growth to replace the hardwoods used to manufac-
ture the bench.
                                                                  PHOTO CREDIT: TOM FERGUSON
Conversion efficiency is relatively high for a high-quality

CRADLE TO FACTORY GATE ENVIRONMENTAL IMPACT OF STRIPPED BENCH
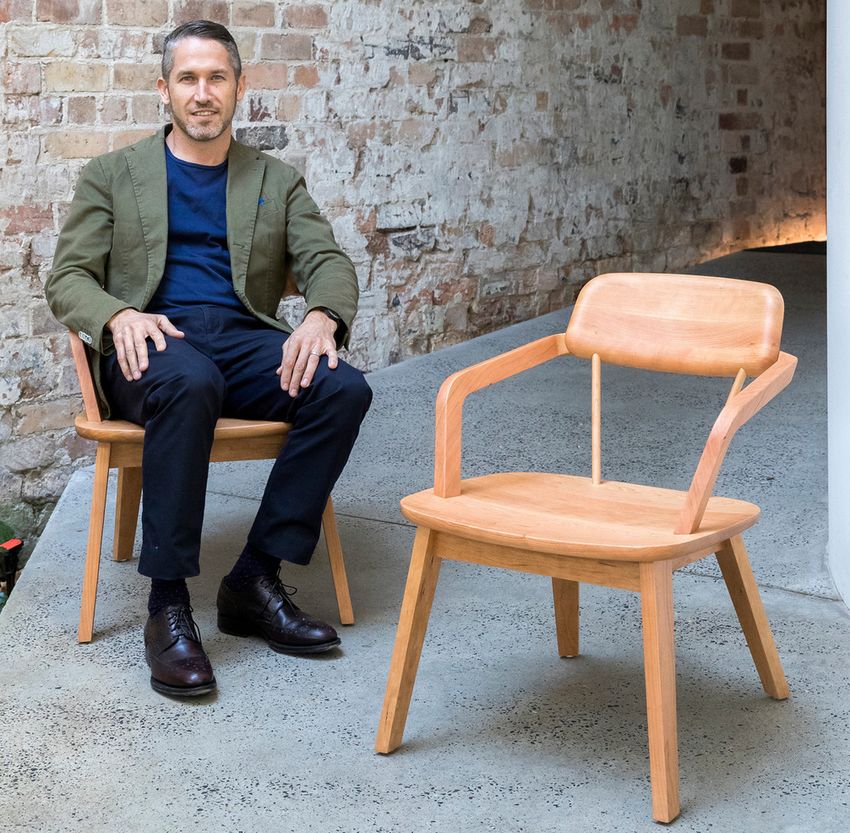
J.A.C. ARMCHAIRS BY TODD HAMMOND
Use of American cherry in a simple elegant design contributes to             ian over a 2-day period. Emissions of 146 kg CO2 eq are offset by
a strong environmental profile. With forest volume of around 400             8 kg CO2 due to burning of wood offcuts at the factory in Australia
million cubic meters, cherry accounts for 3% of the U.S. hardwood            (which substituted for fossil fuel) and 34 kg CO2 eq. of carbon
resource. Every year, the volume of cherry in U.S. forests grows             stored in the wood of the finished design. A product with such
on average by 11.7 million cubic meters, of which only 4.3 million           timeless appeal should store carbon for many decades.
is harvested. This means the volume standing in U.S. hardwood
forests expands by 7.4 million cubic meters every year. It takes
                                                                                                                   PHOTO CREDIT: TOM FERGUSON
around half a second for forest growth to replace the cherry used
to manufacture the three armchairs.
Cherry has been out of fashion now for several years, reducing in-
centives for sustainable forest management in those areas where it
predominates, notably the Allegheny Plateau of Pennsylvania, Ohio,
Michigan, New York, and West Virginia.
The conversion efficiency of the armchairs is slightly lower than
some of the other Seed to Seat designs – a consequence of the
fine curved cherry wood elements introduced into the design. 40%
of the lumber delivered to the Australian factory to fabricate the
armchairs is incorporated into the finished design, 15% is utilised
for energy generation, and 45% is waste sawdust and shavings.
The design also requires fairly heavy use of electricity for machines,
particularly the CNC machine, moulder and various saws, and a sig-
nificant proportion of environmental impact is therefore attributed
to the manufacturing stage in Australia.
Nevertheless, the carbon footprint is modest for such high quality
bespoke furniture, at 105 kg CO2 eq. for the three J.A.C armchairs
manufactured for the Seed to Seat project, about the same as a 550
km drive and equal to the carbon emissions of the average Austral-

CRADLE TO FACTORY GATE ENVIRONMENTAL IMPACT OF THREE J.A.C ARMCHAIRS
EMI PODS BY ANNE-CLAIRE PETRE
The Emi pods are made in red oak, the most abundant American                  pacts of prototype or bespoke designs, which involve more trial and
hardwood with forest volume of around 2,500 million cubic meters,             error, tend to be high relative to individual standardised items from
18% of the total U.S. hardwood resource. Every year, the volume of            a production line. If the pods were to be produced on a large scale,
red oak in U.S. forests grows on average by 55 million cubic meters,          the manufacturer would invest in tooling to greatly reduce the time
of which only 34 million is harvested. This means the volume stand-           required on the CNC machine (perhaps to no more than a quarter
ing in U.S. hardwood forests expands by 21 million cubic meters               of the time required on the prototype). This factor, combined with
per year. It takes little more than one tenth of a second for forest          more efficient utilisation of the wood, could well reduce the carbon
growth to replace the red oak used to manufacture the pods.                   footprint by as much as 50%.
The carbon footprint of the finished pods is 155 kg CO2 equivalent,
about the same as an 810 km drive and equal to the carbon emis-
sions of the average Australian over a 3-day period. Emissions of
222 kg CO2 eq. are offset by 12.5 kg CO2 eq. due to burning of wood
offcuts at the factory in Australia (which substituted for fossil fuel)
and 55 kg CO2 eq. of carbon stored in the wood.
Nearly half of total carbon emissions, and a large share of the
acidification and eutrophication potential of the Emi pods, occurred
during manufacturing in Australia and are almost entirely due to
the long time required (over 8 hours) on a CNC machine powered
by electricity from the national grid. This highlights that environ-
mental impacts are heavily dependent on the energy source during
manufacturing. Australia’s national grid relies mainly on fossil fuels
so any manufacturing requiring large inputs of electricity in the
country tends to have a high environmental footprint – and major
improvements in environmental performance may be achieved by
manufacturers shifting to alternative renewable energy sources
such as solar.
                                                                               PHOTO CREDIT: TOM FERGUSON
The LCA of the EMI pods also highlights that the environmental im-

CRADLE TO FACTORY GATE ENVIRONMENTAL IMPACT OF TWO EMI PODS
O.C.S. BENCH BY BEN PERCY
The O.C.S bench is made in tulipwood, one of the most abundant                drive and equal to the carbon emissions of the average Australian
American hardwoods with forest volume of over 1000 million cubic              over a 42-hour period. Emissions of 234 kg CO2 eq. are offset by 20
meters, 7% of the total U.S. hardwood resource. Every year, the               kg CO2 eq. due to burning of wood offcuts at the factory in Australia
volume of tulipwood in U.S. forests grows on average by 32 million            (which substituted for fossil fuel) and 122 kg CO2 eq. of carbon
cubic meters, of which only 13 million is harvested. This means the           stored in the wood of the finished design.
volume standing in U.S. hardwood forests expands by 19 million
cubic meters every year. It takes just over half
a second for forest growth to replace the tulip-
wood used to manufacture the bench.
Tulipwood is under-utilised – in the sense that
far more grows in the U.S. forest than can be
used for commercial applications which under-
mines investment in sustainable forest man-
agement. The bench highlights that tulipwood
is a beautiful, easily worked, and environmen-
tally-friendly material with potential for use in
a wide range of applications.
Although carbon emissions associated with
manufacturing the O.C.S. bench are high
relative to the other Seed to Seat designs,
these are offset by the high wood content
(and therefore carbon stored) in the finished
design. Wood wastage was lower than for the
other Seed to Seat designs with 63% of the
lumber delivered ending up in the final design.
The carbon footprint of the O.C.S. bench is 92         PHOTO CREDIT: TOM FERGUSON
kg CO2 equivalent, about the same as a 480 km

CRADLE TO FACTORY GATE ENVIRONMENTAL IMPACT OF O.C.S. BENCH
DON CHAIRS BY ADAM GOODRUM
The wood content of the Don chairs is the major determinant of en- due to nearly four hours spent on the CNC machine. Emissions
vironmental impact. Very few non-wood materials are used and the during the manufacturing stage could be significantly reduced for
relative simplicity of the designs allows the wood to speak for itself mass-production through investment in product-specific tooling.
and avoids the need for elaborate processing
and finishing.
The chairs are manufactured in cherry and
PHOTO CREDIT: TOM FERGUSON
tulipwood, both of which are widely available
and under-utilised American hardwood spe-
cies. It takes less than a quarter of a second
for forest growth to replace the hardwoods
used to manufacture the set of three Don
chairs manufactured for the Seed to Seat
project.
The carbon footprint is quite low, particu-
larly for a prototype, at 99 kg CO2 equivalent
for the three chairs. That’s about the same
as a 520 km drive and equal to the carbon
emissions of the average Australian over a
45-hour period. Emissions of 127 kg CO2 eq.
are offset by 7 kg CO2 eq. due to burning
of wood offcuts at the factory in Australia
(which substituted for fossil fuel) and 21 kg
CO2 eq. of carbon stored in the wood of the
finished design.
A large proportion of carbon emissions and
other environmental impacts occur at the
manufacturing stage in Australia, primarily
CRADLE TO FACTORY GATE ENVIRONMENTAL IMPACT OF THREE DON CHAIRS
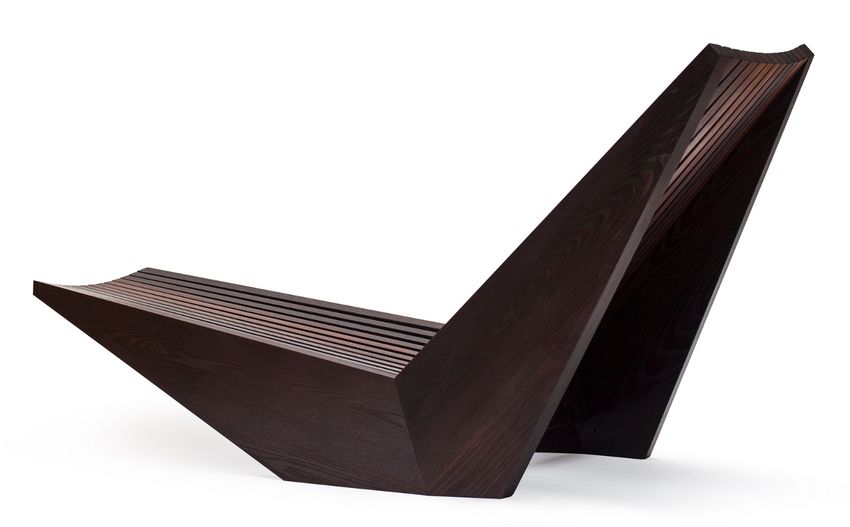
10ALENI BENCH BY DAVID TRUBRIDGE
The Aleni bench is manufactured in New Zealand using American
PHOTO CREDIT:
ash, a species with forest volume of 670 million cubic meters,
DAVID TRUBRIDGE
around 5% of the U.S. hardwood resource. Every year, the volume
of ash in U.S. forests grows on average by 12 million cubic meters,
of which only 6 million is harvested. This means the volume stand-
ing in U.S. hardwood forests expands by 6.0 million cubic meters
every year. It takes little more than one second for forest growth to
replace the ash used to manufacture the bench.
The ash is thermally modified, a process which while consuming
relatively little energy, considerably enhances the durability of the
hardwood. This combines with high quality design to ensure that
the bench will remain in use for many years, providing a long-term
carbon store and reducing the need for regular replacement – a
particularly relevant issue for outdoor furniture which often has
a short lifetime in use. Another benefit of thermal modification is required on energy-intensive equipment like the CNC machine. Use
that it avoids use of chemical preservatives and thereby facilitates of electricity also tends to be less environmentally costly in New
disposal, either by incineration or in land-fill, at end of life. Zealand, where a large proportion is hydro power, than in Australia
The carbon footprint of the bench is extremely low, only 4.1 kg which depends more on fossil fuels. David Trubridge Ltd further
CO2 equivalent, about the same as a 22 km drive and equal to the reduces the impact by purchasing power through Meridian Energy
carbon emissions of the average Australian over a 2-hour period. which generates electricity from 100% renewable energy sources
Emissions of 123.8 kg CO2 eq. are offset by 22.8 kg CO2 eq. due to (hydro and wind).
burning of wood offcuts at the factory in New Zealand (which sub- The Aleni bench vividly illustrates how, if measures are taken to
stituted for fossil fuel) and 96.8 kg CO2 eq. of carbon stored in the reduce environmental impacts during manufacturing, furniture
wood in the finished design. products made in American hardwood can be close to, or even
Relatively low carbon footprint and other environmental impacts better than carbon neutral. This applies even when the American
compared to the other Seed to Seat designs is largely explained by hardwood is shipped over a long distance, in this case from the
much lower impacts during the manufacturing stage. Less time is Eastern United States to New Zealand.
CRADLE TO FACTORY GATE ENVIRONMENTAL IMPACT OF ALENI BENCH
11WHAT IS LCA? WHAT ASSUMPTIONS ARE MADE?
Life-cycle environmental assessment (LCA) involves the col- In any LCA there will be data gaps and various assumptions
lection and evaluation of quantitative data on all the inputs have to be made. The analysis errs on the side of caution
and outputs of material, energy and waste flows associated and aims to over-estimate rather than to under-estimate
with a product over its entire life cycle so that the environ- environmental impact, for example:
mental impacts can be determined. LCA quantifies environ- nU.S. hardwood is assumed to be delivered to Australia and
mental effects against a range of impact categories. LCA may New Zealand by a particularly long and tortuous route: by
also provide qualitative assessment of other environmental truck from central harvest point to an East Coast port in the
impacts, such as on biodiversity and land-use, that are less U.S., by container ship through the Suez Canal to Singapore,
easy to quantify. transfer to another ship for Australia and New Zealand, and
then an additional 100 km to the factory gate.
WHAT IS INCLUDED IN THE LCA? nOther materials such as glues and coatings are assumed to
The LCA of the Seed to Seat designs covers all processes be solvent based and sourced at least as far away as China.
from extraction of wood and other raw materials, transport
nWood waste from manufacturing in Australia and New
of these materials to processing location, all processing steps
Zealand is assumed to be burnt in a standard municipal
(notably sawing and kilning in the case of wood), transport
waste incinerator with relatively low efficiency. In practice,
of processed products to the factory in Australia or New Zea-
much higher levels of energy output may be achieved in
land, and manufacture of the finished design. Due to lack of
modern specialised biomass incinerators.
information on durability, maintenance and disposal at end-
of-life, the LCA is not a full “cradle-to-grave” assessment, and nSulphur content of marine fuels is assumed to be 2.7%
compared to estimated international average of 2.4%.
instead determines the environmental impact of the design
when delivered to the customer.
THESE ARE PROTOTYPES NOT PRODUCTION
WHO PREPARED THE LCA? MODELS - HOW DOES THAT EFFECT THE LCA?
The environmental impacts of prototypes will be relatively
The LCA is commissioned by the American Hardwood Export
high per unit of production. When producing at scale,
Council (AHEC) and prepared by Rupert Oliver, Director of
manufacturers are able to adjust material procurement and
Forest Industries Intelligence Ltd, a U.K. based consultant
production techniques to significantly increase efficiency and
with over 25 years experience of sustainability issues in the
reduce waste.
forest products sector.
The importance of this factor for the Seed to Seat designs
is particularly evident from the large amount of time - and
HOW IS THE LCA CARRIED OUT?
therefore relatively high energy input - required for CNC
The LCA draws on a two-year study, commissioned by AHEC
milling in Australia (over 8 hours in the case of one design).
and undertaken by PE International (now Thinkstep), to
Under normal circumstances, the manufacturer would have
assess environmental impacts linked to delivery of U.S.
tooling made for this specific design, reducing the time on
hardwood into world marketsa. This involved a wide-ranging
the CNC machine to around a quarter of that required for
independent assessment of hardwood forestry practices and
the prototype.
a survey of the hundreds of U.S. companies engaged in the
processing and export of hardwood products. Information a. The thinkstep LCA study of U.S. sawn hardwood is avail-
from the LCA of U.S. hardwoods is combined with the latest able at http://www.americanhardwood.org/fileadmin/docs/
U.S. government forest inventory datab and data gathered sustainability/Final_LCA_Lumber_report.pdf
during manufacturing at Evostyle in Australia and by David b. Latest U.S. forest inventory data is drawn from the U.S.
Trubridge in New Zealand. It is also combined with Think- Forest Service Forest Inventory and Analysis (FIA) database
step’s existing life-cycle inventory database which covers an at http://apps.fs.fed.us/fia/fido/index.html (last accessed in
expanding range of non-wood materials and products. January 2016 and using 2014 data for most U.S. states)
12You can also read


