Detecting canopy damage caused by Uromycladium acaciae on South African Black Wattle forest compartments using moderate resolution satellite imagery
←
→
Page content transcription
If your browser does not render page correctly, please read the page content below

South African Journal of Geomatics, Vol. 8. No. 1, March 2019

Detecting canopy damage caused by Uromycladium acaciae on South
African Black Wattle forest compartments using moderate resolution
                         satellite imagery
      Muhammad Sheik Oumar1, 2, Kabir Peerbhay2,3, Ilaria Germishuizen2,3, Onisimo Mutanga2,
                                      Zakariyyaa Oumar4
              1
                 NCT Forestry, Pietermaritzburg, South Africa. muhammad@nctforest.com
2
    University of KwaZulu-Natal, School of Environmental Sciences, Pietermaritzburg, South Africa.
              3
                Institute for Commercial Forestry Research, Pietermaritzburg, South Africa.
     4
       University of Witwatersrand, School of Geography, Archaeology and Environmental Studies,
               Private Bag 3, Witwatersrand 2050, South Africa - zakoumar1@gmail.com

DOI: http://dx.doi.org/10.4314/sajg.v8i1.5

Abstract

   Uromycladium acaciae, also known as wattle rust, is a rust fungus that has adversely impacted
black wattle (Acacia mearnsii) in South Africa. This study assessed the potential of the Landsat 8
multispectral sensor to detect canopy damage caused by wattle rust on two plantation farms near
Richmond, KwaZulu-Natal. The Landsat 8 bands and vegetation indices detected forest canopy
damage caused by Uromycladium acaciae with an accuracy of 88.24% utilising seven bands and
the Partial Least Squares Discriminate Analysis (PLS-DA) algorithm. Additionally, the model was
optimised using the Variable Importance in Projection (VIP) method which only selected the most
influential bands in the model. The coastal aerosol band (430nm-450nm), red band (640nm-
670nm), near infrared (850nm-880nm) and NDVI were exclusively used in the optimised model and
an accuracy of 82.35% was produced. The study highlighted the potential of remote sensing to
detect canopy damage caused by a rust fungus and contributes towards a monitoring framework for
analysing trends using freely available Landsat 8 imagery.

1. Introduction
   Plantation forestry covers about 1.2 million hectares and predominantly occupies the
Mpumalanga and KwaZulu-Natal provinces located in the eastern seaboard of the country.
Softwood tree species include Pinus species while hard wood species are dominated by Eucalyptus
and Acacia species (Forestry South Africa, 2017). One of the most common species grown by
wattle growers in South Africa is Acacia mearnsii, which is also known as Black Wattle.
Approximately 112 029 ha of land is planted with Acacia mearnsii which contributes 7.4% to the
market for timber and pulp production (Meyers et al., 2001). The bark of Black Wattle is
considered to contain one of the richest sources of tannins which has various industrial uses,
including that of leather tanning (Sherry, 1971). Apart from its characteristic in the bark, wattle
trees are also utilised in soil reclamation, as wind breaks, fire fuel, mining timber and paper pulp
(Rusk et al., 1990; Sherry, 1971). In South Africa, Black Wattle is mostly grown for chip export
and the production of charcoal (Crickmay and Associates, 2010). Furthermore, there are large areas

                                                 69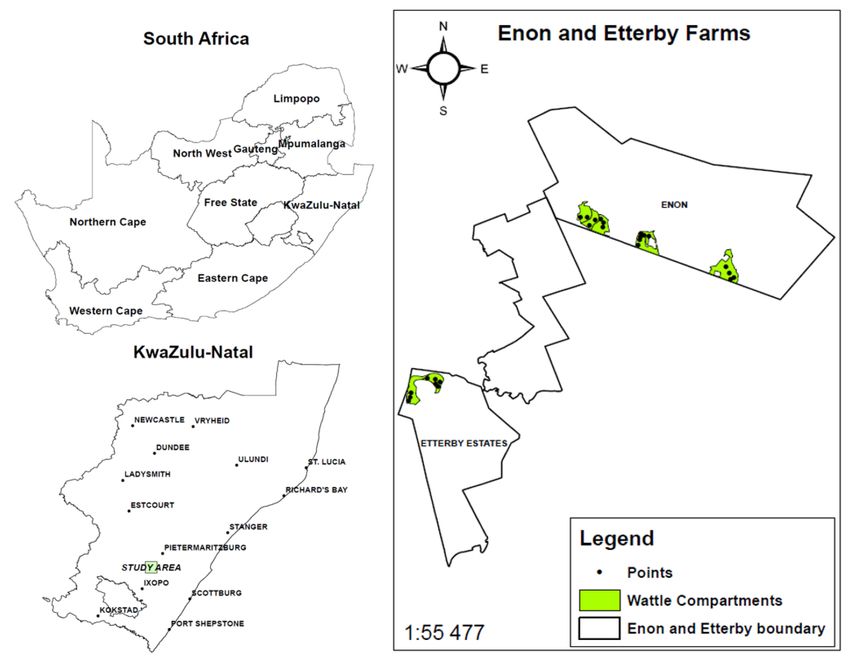
South African Journal of Geomatics, Vol. 8. No. 1, March 2019

of unmanaged wattle stands and woodlots which contributes towards the livelihoods of rural
communities. Black Wattle is therefore an economically important tree species for plantations and
is also socially important to the rural communities of South Africa. Nonetheless, with the constant
increase in demand for timber products, forest production is under pressure and the future
sustainability of the industry is at risk. One of the major threats identified by the South African
National Forest Protection Strategy and adopted by the Department of Agriculture, Forestry and
Fisheries (DAFF) is the escalating impact of pests and pathogens (Dyer et al., 2010).

    During 2013, an outbreak of a new disease has been observed in Black Wattle around the
KwaZulu-Natal Midlands area, caused by a rust fungus. The pathogen has spread fast to all wattle
growing areas in the country, becoming a major concern for wattle growers in the region
(McTaggart et al., 2015). A concerted research effort has been undertaken by the Tree Protection
Co-operative Programme (TPCP) together with the Institute for Commercial Forestry Research
(ICFR) and industry partners to develop an effective management strategy to reduce the impact of
the rust. Recent DNA sequencing techniques have been used to identify the rust as Uromycladium
acaciae (McTaggart et al., 2015). Some of the symptoms of the affected trees include leaf spots,
petiole and rachis deformation, defoliation, gummosis, stunting and dieback of seedlings (Figure 1).
Fungicides are currently being tested for the control of Uromycladium acaciae. However, more
research needs to be undertaken to understand the seasonal cycle of the rust and environmental
triggers of outbreaks to optimise the timing of interventions.

                                                70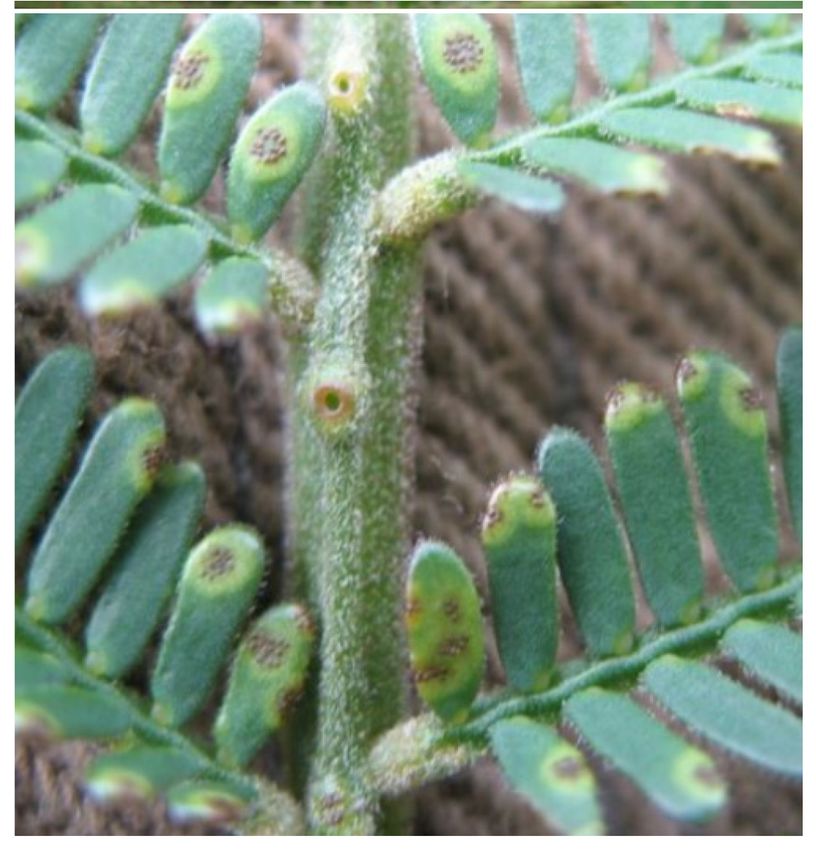
South African Journal of Geomatics, Vol. 8. No. 1, March 2019

Image                          Picture                              Symptom

Image A                                                             The slime as seen on black
                                                                    wattle in Enon an Etterby
                                                                    plantations.

Image B                                                             Leaf curl seen on a few
                                                                    trees.

Image C                                                             Telia present on the leaves.

Image D                                                             Uredinia present on leaves
                                                                    and stem.

                Figure 1. Uromycladium acaciae impacts on Acacia mearnsii trees.

   To effectively respond to the impact and spread of the rust, forest managers and researchers
require up-to-date information related to the current spatial extent, variability and severity of such
infestation. Monitoring and surveillance are in fact a key component of an effective pest and

                                                 71
South African Journal of Geomatics, Vol. 8. No. 1, March 2019

disease management strategy, however, there is currently no system in place in response to this
need. More generally, the need for a forest health surveillance system has been identified as a
priority for the South African forestry sector (Dyer et al., 2010). Current capabilities are inadequate
with conventional field-based methods being prohibitively expensive, labour intensive and time
consuming. According to Oumar and Mutanga (2010) field-based assessments are the most accurate
in determining forest health, however, this is not a feasible option when larger areas of forest health
estimates are needed. Earth observation technologies such as satellites provide local to global
coverage on larger areas where field measurements are unfeasible on a regular basis. Remote
sensing technologies as an alternative, offer the potential to enhance forest management strategies
by providing a synopsis of forest health rapidly and over vast geographic extents (Wanger et al.,
2010).

   This study seeks to develop an impact detection methodology that can be used for mapping and
monitoring the presence of wattle rust using remote sensing technologies. The development of such
methodology will not only play a key role for the management of the wattle rust to ensure the
sustainability of wattle resources into the future (Forestry South Africa, 2017) but will also
contribute towards the development of a broad national forest health monitoring system.

   New generation, moderate resolution space-borne imagery can be an inexpensive, effective
technology for the mapping, monitoring and risk assessment of new canopy pests and pathogens
(Asner et al., 2011; Wang et al., 2010). This technology has been widely adopted for the monitoring
of forest health and in support of integrated pest management strategies (Kennedy et al., 2010;
Meigs et al., 2011; Verbesselt et al., 2010; Wulder et al., 2012). For example, the Landsat sensor is
particularly sensitive to changes in forest structure in the near infrared and short-wave infrared
channels (Wulder et al., 2006). Image transformations in the near infrared and short-wave infrared
regions have shown an 86% success rate in mapping subtle changes in canopy due to Mountain pine
beetle red-attack damage. This result was achieved utilising a logistic regression approach (Wulder
et al., 2006). Ismail and Mutanga (2006) visually assessed damage to pine compartments triggered
by Sirex noctilio attacks. The visual inspections were classed in a severity scale of damage. Using
high resolution imagery (5m x 5m) they could show significant differences in the vegetation indices
derived from the imagery between healthy and visually damaged pine compartments (Ismail and
Mutanga, 2006). Oumar and Mutanga (2013) used the WorldView-2 sensor to detect
Thaumastocoris peregrinus (Bronze Bug) damage in Eucalyptus plantations. Vegetation indices and
environmental variables were entered separately into a Partial Least Squares (PLS) regression
model and then combined in one model to test the collective strength of predicting Thaumastocoris
peregrinus damage. An accuracy of 71% was achieved using the PLS regression model and bands
in the red-edge and near infrared were identified as important predictors of damage (Oumar and
Mutanga, 2013). Lottering and Mutanga (2015) successfully mapped levels of Gonipterus
scutellatus damage in commercial Eucalyptus stands utilising a pan-sharpened WorldView-2 image.
NDVI, Simple Ratio and Enhanced Vegetation Index were used as variables to detect damage. As

                                                  72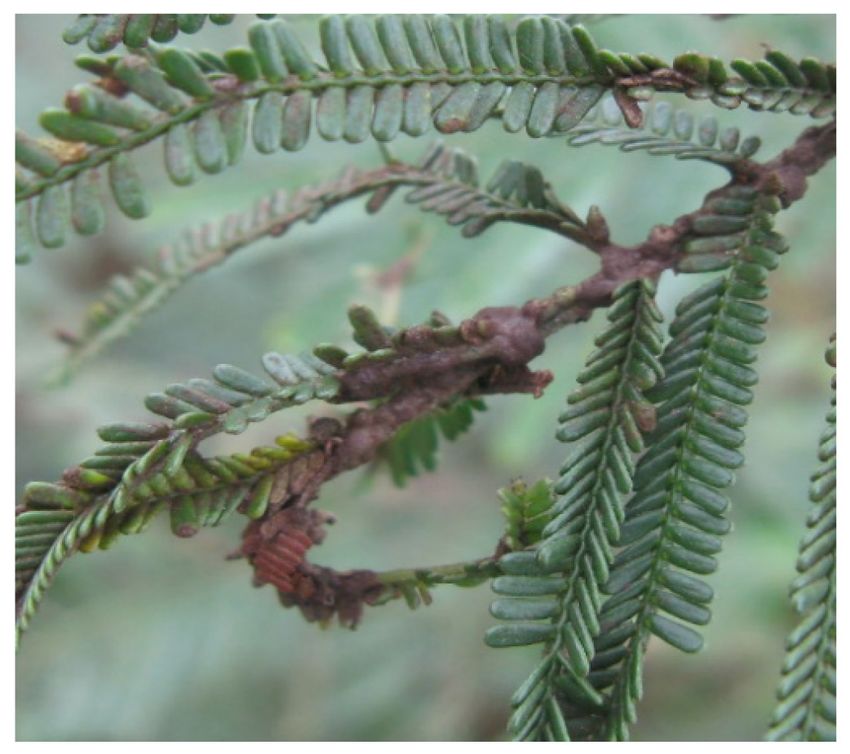
South African Journal of Geomatics, Vol. 8. No. 1, March 2019

with previous studies (e.g. Oumar and Mutanga, 2013) it was observed that NDVI values were most
significant in detecting defoliation in forest plantations.

   In summary, the sudden outbreak of Uromycladium acaciae has caused serious concerns towards
the sustainability of the South African wattle industry. Black wattle is one of the most profitable
tree species per hectare due to its bark and wood properties and requires urgent mitigation against
the rust fungus. It is within this context, that this study aims to detect damage and map the current
spatial extent of damaged plantations using medium resolution and cost-effective Landsat 8
operational land imager (OLI). The Landsat 8 sensor has seven spectral bands with a spatial
resolution of 30 meters and would be advantageous for site interventions if successful in detecting
disease defoliation in plantation forestry. A Partial Least Squares Discriminant Analysis (PLS-DA)
framework is adopted in this study owing to the recent success in forest type applications globally
(dos Santos et al., 2017; Peerbhay et al., 2013; Peerbhay et al., 2014; Peerbhay et al., 2016) and to
the best of our knowledge the method has not being used for forest defoliation mapping using
remotely sensed data in South Africa.

2. Methods and materials
2.1. Study area

   The study area is located near Richmond (29.8667° S, 30.2667° E) in the KwaZulu-Natal
province of South Africa. It covers an area of 875ha and is situated at an altitude range between
900m and 1400m above sea level. The area receives annual rainfall ranging from 800mm to
1280mm and has an average annual temperature of 17 Celsius. The area has deep well drained
soils where timber and sugar cane are the primary resources planted across the arable land. Acacia
mearnsii and Eucalyptus smithii are the most common tree species planted. The study area was
chosen due to intense oubreaks of wattle rust and the noticable decline in tree health and
productivity (Mucina and Rutherford, 2006).

                                                 73
South African Journal of Geomatics, Vol. 8. No. 1, March 2019
Figure 2. Location of the study area with the boundary of Enon and Etterby forest plantations.
2.2. Landsat 8
The Landsat 8 image has a scene size of 170km north-south by 180km east-west. The image
consists of seven spectral bands and 30 meters’ resolution (Table 1). NDVI values were also
calculated due to the success in previous studies to detect forest defoliation (Oumar and Mutanga,
2013). The image area under investigation was acquired from the United States Geological Survey
website (www.usgs.com) and prepared for image processing. The image was atmospherically
converted to radiance and then surface reflectance using the dark image subtraction method
(Chavez, 1988). Using the field survey plots, image spectra were extracted using ENVI 4.8 to
develop an input dataset into the PLS-DA model for discrimination (Congalton and Green, 1999).
74South African Journal of Geomatics, Vol. 8. No. 1, March 2019
Table 1. Landsat 8 Operational Land Imager (OLI) bands and wavelength
Bands Wavelength (nanometres) Resolution (meters)
Band 1 - Coastal aerosol 430-450 30
Band 2 - Blue 450-510 30
Band 3 - Green 530-590 30
Band 4 - Red 640-670 30
Band 5 - Near Infrared (NIR) 850-880 30
Band 6 - SWIR 1570-1650 30
Band 7 - SWIR 2110-2290 30
2.3. Field data collection
Following the industry protocol developed in conjunction with the TPCP and Forest Agricultural
Biotechnology Institute (FABI), 79 field plots were set in wattle compartments between the ages of
7 and 9 years and which were greater than 7ha (approximately 9 pixels) to avoid spectral noise from
adjacent land cover. Each field plot was surveyed to determine the presence, level of infestation and
impact of the rust, Uromycladium acaciae, on the forest canopy. Each field plot consisted of a
rectangular plot of 30m x 30m consisting of 100 trees planted at a spacing of 3m x 3m. A
differentially corrected handheld GPS was used and recordings were taken at each plot centre. Since
the presence of the rust was surveyed to be widespread with no clear identification of a non-infected
wattle stand, 31 plots showing no symptoms of the wattle rust were used as control plots and were
located in the Mpumalanga region.
3. Statistical Analysis
3.1. Partial Least Squares Discriminant Analysis (PLS-DA)
PLS-DA is a regression based prediction model that identifies a correlation between the predictor
variable (X = spectral bands) and the response variable (Y = wattle rust) (Wold et al., 2001). The
goal of using PLS is to provide dimension reduction in the dataset. In this study, the response
variable was the wattle rust which is binary and classed into presence of damage and absence of
damage. The PLS-DA model creates a few eigenvectors which explain the variance of the spectral
reflectance as well as the correlation with the response variable (Peerbhay et al., 2013).
Due to the large number of correlated variables in a PLS-DA model, a cross validation analysis
was performed to test the significance of each component using Tanagra statistical software
(Rakotomalala et al., 2005). Components were added numerically until the lowest coefficient of
variation (CV) error rate was obtained. The purpose of cross-validation is to avoid using too many
low order components which may reduce the model accuracy (Peerbhay et al., 2013).
The Variable Importance in the Projection (VIP) method was used to select bands that have the
highest importance in a PLS-DA model:
75South African Journal of Geomatics, Vol. 8. No. 1, March 2019
[1]
Where VIPk is the importance of the kth waveband based on a model with α components. Wαk is
the corresponding loading weight of the kth waveband in the αth PLS-DA component. ta, wa and qa
are the ath column vectors, and K is the total number of wavebands of X (Gomez et al., 2008).
This method scores each waveband in the dataset and ranks them in order of importance. Bands
that score higher than one have the highest influence in the model. The model was then re-run using
the VIP bands to test if the classification accuracy improved or regressed (Peerbhay et al., 2013).
3.2. Accuracy assessment
Approximately, 70% of the data was used for model training and 30% for model testing. A
confusion matrix was used to validate the accuracy. The overall accuracy was tested using kappa
(KHAT) statistic which is a measure of how well the classifier predicts the reference data. KHAT
values range from -1 to +1, where +1 represents perfect accuracy between training and test datasets
(Congalton and Green, 1999)
4. Results
4.1. Mean Uromycladium acaciae reflectance
The mean reflectance of Uromycladium acaciae infected trees is shown in Figure 3. The
reflectance indicates a normal spectral vegetation curve with low reflectance in the visible spectrum
and a sharp spike in the Red and Near Infrared regions.
25
20
REFLECTANCE (% )
15
10
5
0
450 510 590 670 880 1650 2290
WAVELENGTH (nm)
Figure 3. Reflectance of Uromycladium acaciae infected trees from Landsat 8 bands (n =7)
76South African Journal of Geomatics, Vol. 8. No. 1, March 2019
4.2. PLS-DA model optimization
The addition of components to the PLS-DA model reduced the error rate as depicted in Figure 4.
Using the first component which produced an error rate of 17.89. However, as more components
were progressively added to the model, the error began to decrease with the lowest error recorded
by 6 components at 4.09%. The model thereafter stabilised on the 7th and 8th component. Using 6
components, the PLS-DA model was then developed with all 7 bands including NDVI.
20%
1 7 .8 9 %
18%
Cross-validated error (%)
16% 1 4 .3 2 %
14% 1 2 .1 0 %
12% 1 0 .7 5 %
10% 8 .2 3 %
8%
6% 4 .8 6 %
4 .0 9 % 4 .1 9 %
4%
2%
0%
1 2 3 4 5 6 7 8
Number of components
Figure 4. Testing PLS-DA components to determine the lowest CV error with 7 bands and NDVI
using tenfold cross-validation.
4.3. PLS-DA Classification
The confusion matrix in Table 2 below indicates the performance of PLS-DA in classifying the
presence and absence of Uromycladium acaciae damage on Acacia mearnsii. The PLS-DA model
classified the presence of damage and absence of damage with an overall accuracy of 88.24% with
a KHAT value of 0.76.
Table 2. Confusion matrix using 7 Landsat bands.
Class Absence of damage Presence of damage Row total
Absence of damage 60 0 60
Presence of damage 20 90 110
Column total 80 90 170
Producer accuracy 75% 100% Overall accuracy 88.24%
User accuracy 100% 82% Kappa
0.76
77South African Journal of Geomatics, Vol. 8. No. 1, March 2019
4.4. PLS-DA model optimization using VIP bands
The next step was to determine the VIP scores for the 7 bands including the NDVI variable.
PLS-DA provides a hierarchal scoring system which lists wavebands which are most relevant in the
model. Costal Aerosol (1.05), Red (1.03), Near Infrared (1.23) and NDVI (1.14) were selected by
the VIP method. Band 5 Near Infrared had the highest significance.
1.4
1.2
VARIABLE IMPORTANCE IN THE
1.0
0.8
PROJECTION
0.6
0.4
0.2
0.0
Coastal Blue Green Red Near Short Short NDVI
Aerosol Infrared wave IR 1 wave IR 2
BANDS
Figure 5. Waveband importance as determined by the VIP method. The important wavebands are
those with VIP values greater than one.
The model was then run again using only the VIP bands as depicted in Figure 6. When
optimising the model, four components yielded the lowest CV error rate of 6.88% as seen below in
Figure 6.
16% 1 4 .6 0 %
Cross-validated error (%)
14%
12%
9 .9 2 %
10%
7 .4 7 %
8% 6 .8 8 %
6%
4%
2%
0%
1 2 3 4
Number of components
Figure 6. Testing PLS-DA components to determine the lowest CV error using the four VIP bands
and NDVI.
78South African Journal of Geomatics, Vol. 8. No. 1, March 2019
The confusion matrix in Table 3 below indicates the performance of PLS-DA in classifying the
presence and absence of Uromycladium acaciae damage with only the four VIP bands. The PLS-
DA model classified the presence of damage and absence of damage with an overall accuracy of
82.35% and with a KHAT value of 0.66.
Table 3. Confusion Matrix based on PLS-DA algorithm and variables selected by the VIP.
Class Absence of damage Presence of damage Row total
Absence of damage 70 30 100
Presence of damage 0 70 70
Column total 70 100 170
Producer accuracy 100% 70% Overall accuracy 82.35%
Kappa
User accuracy 70% 100%
0.66
5. Discussion
This study has shown the potential of the freely available multispectral Landsat 8 satellite to
detect the impact on trees infected with Uromycladium acaciae, in South African wattle plantations.
The results show the success of the PLS-DA technique combined with remote sensed variables for
disease damage detection in plantation forestry and contributes towards developing a routine
monitoring system for repeated Uromycladium acaciae monitoring. Moreover, this study has shown
that in addition to recent remote sensing techniques, utilizing PLS for pest detection (Oumar and
Mutanga, 2010) and species classification (Peerbhay et al., 2013), the algorithm can also be
successfully utilized for disease damage detection.
5.1. Mapping Uromycladium acaciae damage using Landsat 8 and PLS-DA
The ability to detect Uromycladium acaciae damage remotely provides a practical tool for
identifying outbreaks thus contributing to mapping trends and the continuous monitoring of the
disease. The freely available imagery of Landsat 8 and revisit time of 16 days make it a cost
effective solution for monitoring Uromycladium acaciae damage (Oumar, 2016). Using the Landsat
8 bands, PLS-DA successfully used 6 components to detect defoliation caused by Uromycladium
acaciae and produced an accuracy of 88.24% and kappa value of 0.76. The accuracy obtained in
this study is comparable to that of other studies which have identified other forest pathogens in
South Africa using remotely sensed information (Poona and Ismail, 2013; Poona and Ismail, 2014).
For example, Poona and Ismail (2013) used Quickbird imagery and artificial neural networks to
detect pitch canker disease in Pinus radiata forests. Several vegetation indices were used to
discriminate healthy tree crowns from infected tree crowns. The neural network model managed to
produce an overall accuracy of 82.15%. Similarly, Poona and Ismail (2014) used a handheld field
spectrometer to detect asymptomatic Fusarium circinatum stress in 3 months old Pinus radiata
79South African Journal of Geomatics, Vol. 8. No. 1, March 2019
seedlings. The random forest algorithm and the Boruta algorithm were used for classification and
dimension reduction respectively. The Boruta algorithm highlighted the most important bands as
well as the least important to discriminate between infected and healthy seedlings. Between the
various classes of seedlings sampled in the study, the KHAT values ranged from 0.79 to 0.84.
Additionally, by utilising only the most significant wavebands, the classification accuracy
improved.
5.2. Mapping Uromycladium Acaciae using VIP variables and PLS-DA
PLS-DA provides valuable information on important variables based on the VIP method. The
analysis of important variables selected by VIP has shown that the highest scores in the PLS-DA
model were the Coastal Aerosol (430nm - 450nm), Red (640nm - 670nm) and NIR (850nm -
880nm) regions of the electromagnetic spectrum respectively. The results obtained by the VIP
model produced a slightly reduced overall classification accuracy of 82.35%. This is a reduction of
5.89% when compared to using all seven bands. However, this process shows the capability of
using fewer important bands to produce a high classification accuracy greater than 80%.
The results of this study were in contrast to the study conducted by Peerbhay and Mutanga
(2013), whereby the VIP analysis improved the classification of forest species. Peerbhay et al.,
(2013) found the accuracy improved to 88.78% utilising VIP bands (n =78) compared to utilising
all AISA Eagle bands (n =230) which produced an overall accuracy of 80.61%. A possible reason
for the different results between the two studies is the number of bands utilised. Landsat 8 has 7
bands whereas AISA Eagle has a total of 230. The many bands of AISA Eagle may have caused
over-fitting of the model and therefore reduced the overall accuracy. Landsat 8 has a fewer number
of bands thus reducing the number of bands from 7 to 4 (VIP) lowers the sensors ability to detect
spectral variation. Future work should consider the utility of employing higher spectral resolution
multispectral sensors such as Sentinel, with 13 bands or WoldView-3 with 16 bands, to improve on
detection results.
The Near Infrared and NDVI indices calculated from Landsat 8 were classified as the most
important variables for detecting Uromycladium acaciae damage. Vegetation indices calculated
from Red and Near Infrared are sensitive to plant phenology and thus provide a good measure of
forest health (Oumar, 2016). This highlights the potential to detect forest damage using the visible
wavebands. Furthermore, this study illustrates the usefulness of PLS-DA in managing spatial data
as well as successfully classifying areas that have been damaged by Uromycladium acaciae.
5.3. Future work
One of the disadvantages of broad band sensors is the discreet changes in spectral reflectance by
stressed vegetation which can be hidden by field geometry, lighting and the density of the canopy
(Ismail, Mutanga and Bob, 2007). Hence, the results of this study may be influenced by such factors
and thus opens up the possibility of analysing the impacts of Uromycladium acaciae under a
80South African Journal of Geomatics, Vol. 8. No. 1, March 2019
hyperspectral sensor and using a finer spatial resolution to investigate the changes in reflectance
throughout the entire electromagnetic spectrum. The narrow bands may reduce the aforementioned
limiting effects of multispectral sensors and may be capable of distinguishing stages of the impacts
evident in the life cycle of the rust such as the leaf curl or the occurrence and intensity of the
teleospores which hold infected spores for dispersal. Such information may be valuable in detecting
risk before an outbreak occurs and plan for precautionary interventions. Nonetheless, the
opportunity exists to investigate higher spatial and spectral multispectral sensors combined with
ancillary information related to the surrounding environment of the pathogen. These may include
bioclimatic, topographic and edaphic factors in the landscape for an in-depth spatial mapping
framework.
6. Conclusion
The aim of this study was to assess the potential of Landsat 8 multispectral imagery in
conjunction with PLS-DA to detect damaged caused by Uromycladium acaciae at farm level in two
KwaZulu-Natal forest plantations. The results revealed that the Landsat 8 multispectral sensor
successfully detected the trees which were under stress by Uromycladium acaciae and that the
methodology developed in this study may be adopted to implement a monitoring system for the
wattle rust at a landscape level. Additionally, the VIP PLS-DA method was successful in
determining the subset of bands which are most useful to detect Uromycladium acaciae canopy
impact. In this case, bands within the 430nm - 880nm range were most effective. This opens up the
possibility to investigate Uromycladium acaciae under a higher resolution sensor to bolster
monitoring efforts as well assess the pathogen at different lifecycles, where smaller symptoms of
the pest are not detectable using multispectral imagery.
7. Acknowledgments
We thank the ICFR and Sector Innovation Fund (SIF) for financial assistance that made this
study possible. We acknowledge the support and guidance of the Wattle Rust Working Group. We
are also grateful to NCT Forestry Co-operative Limited for their in-kind sponsorship and the
National Research foundation (NRF) of South Africa (114898).
8. References
Asner, GP & Hicke JA & Lobell DB, 2003, “Per-Pixel Analysis of Forest Structure”, in Wulder
MA & Franklin SE (eds.), Remote Sensing of Forest Environments, Springer, Boston, MA.
Breiman, L. 2001, “Random forests”. Machine Learning, vol. 45, no. 129, pp. 15-32.
Chavez, Jr. 1988, “An improved dark-object subtraction technique for atmospheric scattering
correction of multispectral data”, Remote Sensing of Environment, vol. 24, no. 3, pp. 459-479.
Congalton, RG & Green, K 1999, Assessing the Accuracy of Remotely Sensed Data: Principles and
Practices, Lewis Publishers, Boca Raton.
81South African Journal of Geomatics, Vol. 8. No. 1, March 2019
dos Santos, A & Oumar, Z & Arnhold, A & da Silva, N & Silva, CO & Zanetti, R 2017,
“Multispectral characterization, prediction and mapping of Thaumastocoris peregrinus
(Hemiptera: Thamascoridae) attack in Eucalyptus plantations using remote sensing”, Journal of
Spatial Science, vol. 62, no. 1, pp. 127-137.
Dyer C, Upfold S, Edwards M, Smith C, Roux J, Wingfield M, Peter M and Heath R. 2010, “The
development of an integrated national forest protection strategy for South Africa”, Draft Report
N. 42731. Department of Agriculture, Forestry and Fisheries (DAFF), South Africa.
FAO 2007, “Overview of forest pests, South Africa” Forest Health & Biosecurity Working Papers,
Working Paper FBS/30E. Forest Resources Development Service, Forest Resources Division.
FAO, Rome.
Ismail, R & Mutanga, O & Bob, U 2007, “Forest health and vitality: The detection and monitoring
of Pinus patula trees infected by Sirex noctilio using digital multispectral imagery (DMSI)”,
Southern Hemisphere Forestry Journal, vol. 69, no. 1, pp. 39-47.
Kennedy, RE & Yank, Z & Cohen, WB 2010, “Detecting trends in forest disturbance and recovery
using yearly Landsat time series: 1. LandTRendr - Temporal segmentation algorithm”, Remote
Sensing of Environment, vol. 114, no. 1, pp. 2897-2910.
Kumar, KK & Nagai, M & Witayangkurn, A & Kritiyutanant, K & Nakamura, S 2016, “Above
Ground Biomass Assessment from Combined Optical and SAR Remote Sensing Data in Surat
Thani Province, Thailand”, Journal of Geographic Information System, vol. 8, no. 1, pp. 506-
516.
Lottering, R & Mutanga, O 2016, “Optimising the spatial resolution of World View-2- pan-
sharpened imagery for predicting levels of Gonipterus scutellatus in KwaZulu-Natal, South
Africa”, ISPRS Journal of Photogrammetry and Remote Sensing, vol. 112, no. 1, pp. 112, 13-22.
McTaggart, AR & Doungsa-ard, C & Wingfield, MJ 2015, “Uromycladium acaciae, the cause of a
sudden, severe disease epidemic on Acacia mearnsii in South Africa”. Australian Plant
Pathology, vol. 44, no. 6, pp. 637-645.
Mucina, L and Rutherford, M.C. 2006 (eds.), The Vegetation of South Africa, Lesotho and
Swaziland. Strelitzia 19, South African National Biodiversity Institute, Pretoria.
Peerbhay, K & Mutanga, O & Ismail, R 2013, “Commercial tree species discrimination using
airborne AISA Eagle”. ISPRS Journal of Photogrammetry and Remote Sensing, vol. 79, no. 1,
pp. 19–28.
Peerbhay, K & Mutanga, O & Ismail, R 2014, “Does simultaneous variable selection and dimension
reduction improve the classification of Pinus forest species?”, Journal of Applied Remote
Sensing, vol. 8, no. 1, DOI: 10.1117/1.JRS.8.085194
Poona, NK & Ismail, R 2013, “Discriminating the occurrence of pitch canker fungus in Pinus
radiata trees using QuickBird imagery and artificial neural networks”, Southern Forests: A
Journal of Forest Science, vol. 75, no. 1, pp. 29-40.
Poona, NK & Ismail R 2014, “Using Boruta-selected spectroscopic wavebands for the
asymptomatic detection of Fusarium circinatum stress”, IEEE Journal of Selected Topics in
Applied Earth Observations and Remote Sensing, vol. 7, no. 1, pp. 3765-3772.
Mayers, J & Evans, J & Foy, T 2001, Raising the stakes: impacts of privatisation, certification and
partnerships in South African forestry, IIED, London.
Meigs, GW & Kennedy, RE & Cohen, WB 2011, “A Landsat time series approach to characterise
bark beetle and defoliator impacts on tree mortality and surface fuels in conifer forests”. Remote
Sensing of Environment, vol. 115, no. 12, pp. 3703-3718.
Mucina, L & Rutherford, MC 2011, The Vegetation of South Africa, Lesotho and Swaziland.
Strelitzia 19, South African National Biodiversity Institute, Pretoria. ISBN: 978-1919976-21-1
82South African Journal of Geomatics, Vol. 8. No. 1, March 2019
Oumar, Z & Mutanga, O 2010, “Predicting plant water content in Eucalyptus grandis forest stands
in KwaZulu-Natal, South Africa using field spectra resampled to the Sumbandila Satellite
Sensor”, International Journal of Applied Earth Observation and Geoinformation, vol. 12, no. 1,
pp. 158-164.
Oumar, Z 2016, “Assessing the Utility of the SPOT 6 Sensor in Detecting and Mapping Lantana
camara for a Community Clearing Project in KwaZulu-Natal, South Africa”, South African
Journal of Geomatics, vol. 12, no. 2, pp. 214-226.
Rusk, GD & Pennefather, M & Cronje, C 1990, “Forestry costs in South Africa. In: South African
Timber Growers Association Economics Division”, Pietermaritzburg. Document no. 74/1990.
Sherry, SP 1971, The Black Wattle (Acacia mearnsii de Wild), University of Natal Press,
Pietermaritzburg.
Verbesselt, J & Hyndman, R & Newham, G & Culvenor, D 2010, “Detecting trend and seasonal
changes in satellite image time series”, Remote Sensing of Environment, vol. 114, no. 1, pp. 106-
115.
The United States Geological Survey 2015, The United States Geological Survey, Reston, USA,
viewed 31 July 2015, https://www.usgs.gov/.
Wang, J & Sammis, TW & Gutschick, VP & Gebremichael, M & Dennis, SO & Harrison, RE
2010, “Review of satellite remote sensing use in forest health studies”, The Open Geography
Journal, vol. 3, no. 1, pp. 28-42.
Wulder, MA & Masek, JG & Cohen, WB & Loveland, TR & Woodcock, CE 2012, “Opening the
archive: How free data has enabled the science and monitoring promise of Landsat”, Remote
Sensing of Environment, vol. 122, no. 1, pp. 2-10.
83You can also read