The Economic Potential of Article 6 of the Paris Agreement and Implementation Challenges - SEPTEMBER 2019
←
→
Page content transcription
If your browser does not render page correctly, please read the page content below
The Economic Potential of
Article 6 of the Paris Agreement
and Implementation Challenges
SEPTEMBER 2019

AUTHORS
                        Jae Edmonds (Pacific Northwest National Laboratory)
                        Dirk Forrister (International Emissions Trading Association)
                        Leon Clarke (Pacific Northwest National Laboratory)
                        Stefano de Clara (International Emissions Trading Association)
                        Clayton Munnings (International Emissions Trading Association)

                        ACKNOWLEDGEMENTS
                        This report was prepared by the International Emissions Trading Association (IETA) and
                        the University of Maryland with support from the Carbon Pricing Leadership Coalition
                        (CPLC), and valuable contributions from Chevron, the European Bank for Reconstruction
                        and Development (EBRD), the Government of Germany, the Government of Norway, the
                        Government of the United Kingdom, the Institute for Global Environmental Strategies,
                        Shell, and the Swedish Energy Agency.

                        DISCLAIMER
                        The findings, interpretations, and conclusions expressed in this report do not necessarily
                        reflect the views of the organizations the authors represent. The CPLC does not guarantee
                        the accuracy of the data included in this work.

                        RIGHTS AND PERMISSIONS
                        This work is available under the Creative Commons Attribution 3.0 IGO license
                        (CC BY 3.0 IGO) http:// creativecommons.org/licenses/by/3.0/igo. Under the Creative
                        Commons Attribution license, you are free to copy, distribute, transmit, and adapt this work,
                        including for commercial purposes, under the following conditions:

                        Attribution—Please cite the work as follows: “The Economic Potential of Article 6 of the
                        Paris Agreement and Implementation Challenges”, IETA, University of Maryland and CPLC.
                        Washington, D.C. License: Creative Commons Attribution CC BY 3.0 IGO.

                        Adaptations—If you create an adaptation of this work, please add the following disclaimer
                        along with the attribution: This is an adaptation of an original work by the CPLC. Views and
                        opinions expressed in the adaptation are the sole responsibility of the author or authors
                        of the adaptation, and are not endorsed by the CPLC.

                        Editing and design: Clarity Editorial, www.clarityeditorial.net

                        Cover image: Shutterstock, www.shutterstock.com

                        Page 17–18 photography: Max Thabiso Edkins, Connect4Climate, www.connect4climate.org
TECHNICAL REPORT 2019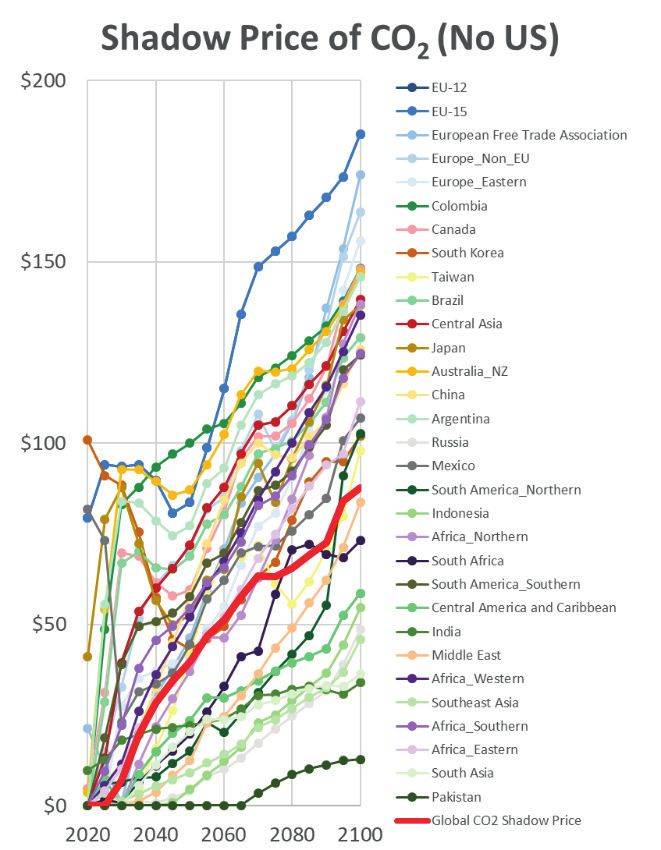
CONTENTS
ABSTRACT AND KEY MESSAGES                                          1

INTRODUCTION                                                       2

METHODOLOGY                                                        3

RESULTS                                                            6

DISCUSSION                                                         15

FUTURE RESEARCH                                                    16

REFERENCES                                                         19

LIST OF FIGURES
FIGURE 1: GLOBAL FOSSIL FUEL AND INDUSTRIAL CO2 EMISSIONS IN THE
          REFERENCE, I-NDC, C-NDC, AND E-NDC SCENARIOS             4

FIGURE 2: SHADOW PRICES OF CO2 IN THE I-NDC, C-NDC,
          AND E-NDC SCENARIOS                                      4

FIGURE 3: GLOBAL TOTAL GHG EMISSIONS IN 2025 AND 2030
          UNDER DIFFERENT SCENARIOS                                5

FIGURE 4: ENERGY AND INDUSTRY CO2 EMISSIONS (2015–2050)
          AND EMISSIONS MITIGATION BY REGION 2030, 2050 AND 2100   7

FIGURE 5: REDUCTION IN ECONOMIC COST (GLOBAL AND REGIONAL)         8

FIGURE 6: ENHANCED AMBITION ENABLED BY ARTICLE 6                   9

FIGURE 7: SHADOW PRICES OF CO2 IN THE I-NDC-UCT SCENARIO           10

FIGURE 8: CO2 EMISSIONS TRADED AND THE SIZE OF CARBON MARKET       10

FIGURE 9: GLOBAL FOSSIL FUEL AND INDUSTRIAL CO2 EMISSIONS
          IN THE I-NDC AND I-NDC (NO U.S.) SCENARIOS               11

FIGURE 10: CO2 EMISSIONS AND CARBON MARKET WITHOUT U.S.
           PARTICIPATION                                           12

FIGURE 11: GLOBAL FOSSIL FUEL AND INDUSTRIAL CO2 EMISSIONS IN
           THE I-NDC-INCREASED AND C-NDC-INCREASED SCENARIOS       13

FIGURE 12: CO2 EMISSIONS AND CARBON MARKET WITH MORE
           AMBITIOUS POST-2030 MITIGATION                          14
                                                                        TECHNICAL REPORT 2019
ABSTRACT

                        T
                                  his technical paper investigates the potential
                                  economic and environmental outcomes              Key messages
                                  associated with the use of Article 6 of the      §§ The potential benefits to cooperation
                                  Paris Agreement by participating countries.         in achieving the NDCs under Article 6
                        The extent to which countries use Article 6, and how          are large and all parties could benefit.
                        they use it, will be informed by design choices agreed        Potential cost reductions over independent
                        upon by negotiators in forthcoming Conference of              implementation of countries’ NDCs total
                        the Parties (COP) meetings, particularly the next             about $250 billion per year in 2030.
                        one to be held at COP 25 in Chile and by the                  Cost reductions from cooperative
                        agreements made between participating parties.                implementation are achieved through
                        We use the Global Change Assessment Model                     improved economic efficiency.
                        (GCAM), an integrated assessment model, to
                        quantify the economic potential of Article 6.              §§ If countries are inspired to invest these cost
                        We go on to discuss real world considerations                 savings in enhanced ambition, then Article 6
                        and potential implications of design choices                  could facilitate additional abatement under
                        currently under consideration by negotiators.                 the Paris Agreement by 50 percent or
                                                                                      ~5 GtCO2/year in 2030.
                        We find that Article 6 has the potential to reduce
                        the total cost of implementing nationally determined       §§ The rules are critical. If written poorly, then
                        contributions (NDCs) by more than half (~$250 billion/        rather than facilitate additional emissions
                        year in 2030), or alternatively facilitate the removal        reductions they could frustrate meeting
                        of 50 percent more emissions (~5 gigatonnes of                current contributions and undercut progress.
                        carbon dioxide per year [GtCO2/year] in 2030), at no
                        additional cost.

                        We note, however, that careful framing in both the
                        design and implementation of Article 6 is essential.
                        A poorly designed and implemented framework
                        could frustrate the achievement of Paris goals, while
                        a well-designed and implemented framework could
                        further them. We conclude by identifying gaps in
                        the research that would be useful to address before
                        COP 25 in Chile.
TECHNICAL REPORT 2019

   1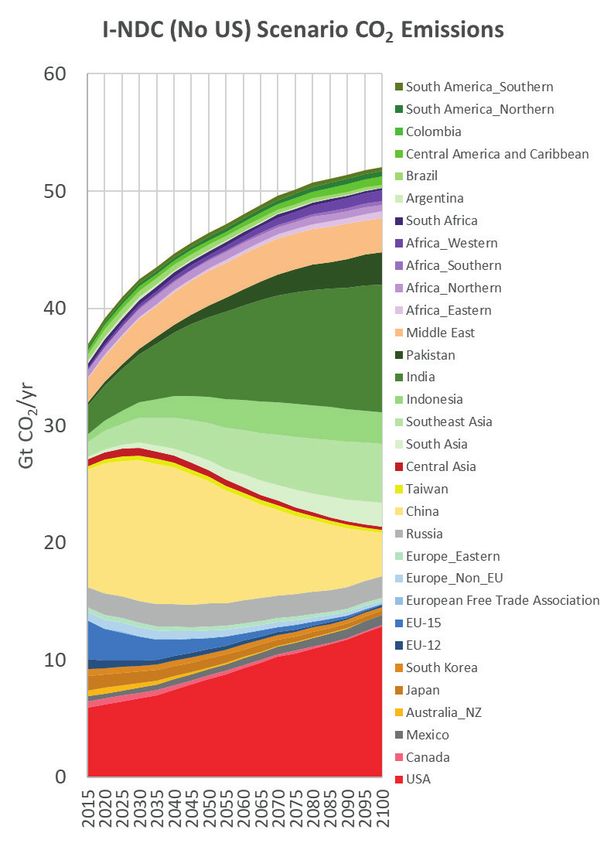
INTRODUCTION

W
                  e begin by providing background          The most recent negotiations at COP 24 in Katowice
                  on the Paris Agreement and Article       completed the Paris Agreement Work Programme
                  6 to contextualize the current state     and yielded The Rulebook, which provided valuable
                  of negotiations and characterize         elaboration and guidance for several Articles of the
the main design choices being contemplated by              Paris Agreement, but not including Article 6. Ministers
negotiators. The Paris Agreement established a             worked hard to find agreement on Article 6, but
new international framework to addressing climate          compromise could not be reached.
change rooted in a bottom-up process that relies on
national action. Parties establish short-term domestic     The Rulebook does refer to Article 6 in certain places,
goals (i.e., through 2030) in NDCs and report their        including in Article 13, which includes a section on
progress through a transparency framework. Current         basic market accounting of transfer and use of ITMOs.
pledges are insufficient to limit average surface          Ultimately, the majority of work on Article 6 must
temperature increase to 1.5°C (IPCCC, 2018) despite        continue throughout 2019, with an objective to adopt
the overarching goal of the Paris Agreement, which         guidance at COP 25 in Chile, where Article 6 will
pursues efforts to limit the temperature increase to       presumably take the mainstage. It will be crucial to
1.5°C (United Nations, 2015). This gap highlights the      successfully negotiate Article 6 in Chile, but it will also
importance of enhancing ambition quickly over time.        be challenging since the few detractors in Katowice
                                                           brought legitimate concerns.
Article 6 of the Paris Agreement allows parties to
lower the costs of abatement by working together in        Despite intense focus by diplomats and analysts on
“cooperative approaches” that create internationally       how to implement Article 6, little work has focused on
transferred mitigation outcomes (ITMOs). These             quantifying the potential economic and environmental
outcomes enable countries to achieve efficiency gains      opportunities offered by Article 6. We analyze both
by taking advantage of their differing marginal costs of   aspects by addressing two questions: What are
abatement and thereby potentially facilitate enhanced      the potential cost savings from full cooperation in
ambition (Aldy et al., 2016; Mani et al., 2018).           implementing NDCs? If those savings were applied
                                                           to enhanced mitigation goals, how much additional
Article 6 allows for many cooperative systems,             ambition could countries achieve? We then discuss
including linkages among homogeneous policies              the real-world challenges associated with realizing
(e.g., multiple market-based policies); linkages           this potential enhanced ambition. We finally discuss
among heterogeneous policies (e.g., carbon tax and         considerations for negotiators as they develop rules
performance standards) (Bodansky et al., 2016); and,       to implement Article 6 for COP 25.
potentially, other innovative approaches (e.g., regional
carbon clubs) (Nordhaus, 2015). The hope is that lower
abatement costs realized through cooperation may
                                                                                                                         TECHNICAL REPORT 2019

increase political appetite for more ambitious targets
when NDCs are reviewed (Keohane and Oppenheimer,
2016). About half of the NDCs signal interest in using
forms of international cooperation through Article 6
(World Bank and Ecofys, 2018).

                                                                                                                             2
METHODOLOGY

                        W
                                         e use the Global Change Assessment                                            Instead of assessing whether countries are on track to
                                         Model (GCAM) to estimate the                                                  achieve their NDC goals, we assume that these goals
                                         potential value of Article 6. GCAM is                                         are met and explore how different mechanisms (i.e.
                                         an open-source, global integrated                                             independent vs. cooperative implementation) affect
                        assessment model (Joint Global Change Research                                                 emissions and abatement costs of countries.
                        Institute [JGCRI], 2017 and 2018). It links energy,                                            In addition, we assume that countries achieve their
                        economy, agriculture, and land-use systems and has                                             NDCs and post-2030 mitigations through a uniform
                        32 geopolitical regions. The full documentation of                                             price on carbon across sectors, whereas, in reality,
                        GCAM is available on Github (http://jgcri.github.io/                                           countries would reduce their emissions through a
                        gcam-doc/). The version of the model used in our                                               variety of policies and programs. To the extent that
                        study is the same as the one used in Fawcett et al.                                            economically inefficient policies are utilized, our
                        (2015), which is fully documented and available online                                         cost estimates and the potential gains from idealized
                        (http://www.globalchange.umd.edu/gcam/indc/).                                                  implementation of Article 6 will be underestimated.
                        This section describes how we use the model to
                        construct different scenarios, how we ensure the                                               The I-NDC scenario assumes that countries implement
                        model is well calibrated relative to the literature,                                           their NDC goals independently and continue to
                        and how we calculate potential enhanced ambition                                               decarbonize their economies on their own after 2030.
                        facilitated by Article 6.                                                                      In this scenario, we translate each country’s NDC into
                                                                                                                       an emission limit following the method of Fawcett et al.
                        CONSTRUCTION OF SCENARIOS                                                                      (2015).1 Each country is assumed to achieve its NDC
                        We simulate four alternative scenarios using GCAM:                                             emissions limit through economically efficient policies
                        a reference scenario, independent implementation of                                            (i.e., carbon tax on fossil and industrial emissions).
                        NDCs (I-NDC), cooperative implementation (C-NDC),                                              From 2030 to 2100 we assume “continued ambition”
                        and enhanced ambition (E-NDC). The reference                                                   as in Fawcett et al. (2015).
                        scenario assumes no new policies or actions to reduce
                                                                                                                       The C-NDC scenario assumes that countries
                        greenhouse gas (GHG) emissions after 2010 (i.e.,
                                                                                                                       cooperatively implement their NDC goals and reduce
                        the calibration year of GCAM). Therefore, it does not
                                                                                                                       emissions beyond 2030 under Article 6 of the Paris
                        include any implementation of NDCs. The reference
                                                                                                                       Agreement. In this scenario, countries can purchase
                        scenario serves as a counterfactual scenario to
                                                                                                                       and sell ITMOs, which are assumed to accurately
                        compare with the mitigation scenarios described
                                                                                                                       represent actual emissions mitigation implied by
                        in this report. This approach has been widely used
                                                                                                                       NDCs, to achieve their decarbonization goals.
                        in the literature.
                                                                                                                       (The translation step between NDC and ITMOs is a
                        The I-NDC and C-NDC scenarios assume that                                                      non-trivial step that we will discuss later in this paper.)
                                                                                                                       Because the marginal abatement costs vary widely,
TECHNICAL REPORT 2019

                        countries meet their NDC commitments through 2030
                        and continue at the same level of decarbonization                                              for some countries it is more cost effective to trade
                        effort required to achieve their NDCs beyond 2030.                                             with other countries with lower abatement costs than
                                                                                                                       to reduce emissions on their own. The actual emissions

   3                    1
                            This includes the U.S. 2015 NDC, though the U.S. has signaled its intention to withdraw from the Paris Agreement.
                             We explore how the assumption that the U.S. does not participate affects our results in supplemental materials.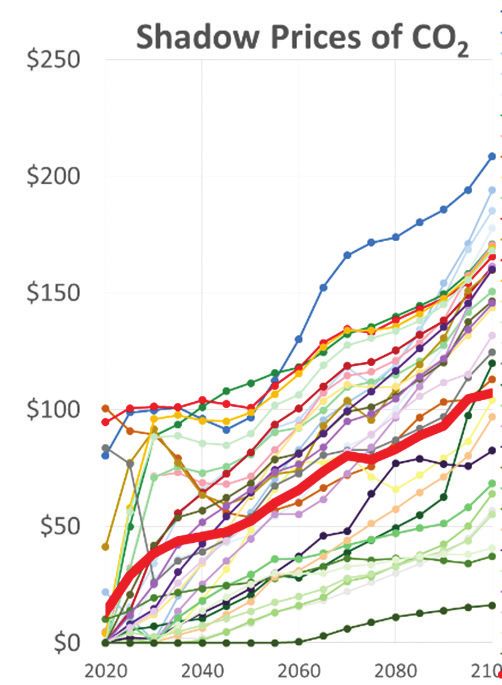
of countries are different between I-NDC and C-NDC                FIGURE 2 Shadow prices of CO2 in the I-NDC, C-NDC, and E-NDC scenarios
scenarios, although each country keeps the same level
of ambition in these two scenarios. Note that double-
counting, a key issue in COP 24 negotiations, does not
occur in our modeling framework.

To explore the degree to which Article 6 could be used
to enhance ambition without increasing the economic
burden on Paris Agreement participants, we create
an E-NDC scenario that assumes that the cost each
country would have incurred had it implemented its
NDC independently reflects its willingness to pay to
mitigate carbon emissions. We use each country’s
I-NDC costs to recalculate additional ambition that
could be achieved if economic efficiency gains
are harnessed through cooperative mechanisms.                     enhance ambition (Figure 1). Meanwhile, the shadow
Compared with the independent implementation of                   price of carbon would also increase, compared with
NDCs, cooperative implementation would be more                    C-NDC, to reach higher ambition (Figure 2).
efficient, reduce costs, and allow countries to achieve
more with the same costs. The E-NDC scenario                      CALIBRATION WITH OTHER MODELS
explores how much additional ambition could be                    Targets established in NDCs come in a variety of forms
enabled through cooperative implementation of                     and modeling them requires a translation of each
mitigation commitments, while maintaining the same                NDC into an absolute target. Our specific translation
global mitigation cost as that in the I-NDC scenario.             of NDC obligations is largely consistent with other
Because cooperative implementation is more                        translations performed in the literature. In Figure 3,
efficient, with the same mitigation costs, cooperative            we compare our estimates of GHG emissions resulting
implementation could achieve more mitigation and                  from NDC obligations for the period 2025 to 2030
                                                                  with those reported by Rogelj et al. (2016). Since we
                                                                  only constrain global CO2 emissions from energy and
FIGURE 1 Global fossil fuel and industrial CO2 emissions in the
             reference, I-NDC, C-NDC, and E-NDC scenarios         industry in the I-NDC and C-NDC scenarios, the total
                                                                  GHG emissions are different under these two scenarios
                                                                  due to the underlying differences in the energy and
                                                                  land-use systems and non-CO2 emissions. The efficient
                                                                  allocation of resources in the C-NDC scenario leads to
                                                                  less GHG emissions than in the I-NDC scenario. The
                                                                                                                                           TECHNICAL REPORT 2019

                                                                  E-NDC scenario, because of its higher ambition, has
                                                                  low levels of GHG emissions; in 2025 GHG emissions in
                                                                  the E-NDC scenario fall within the range of achieving
                                                                  2°C (46—50 GtCO2e in 2025 in Rogelj et al., 2016).

                                                                                                                                               4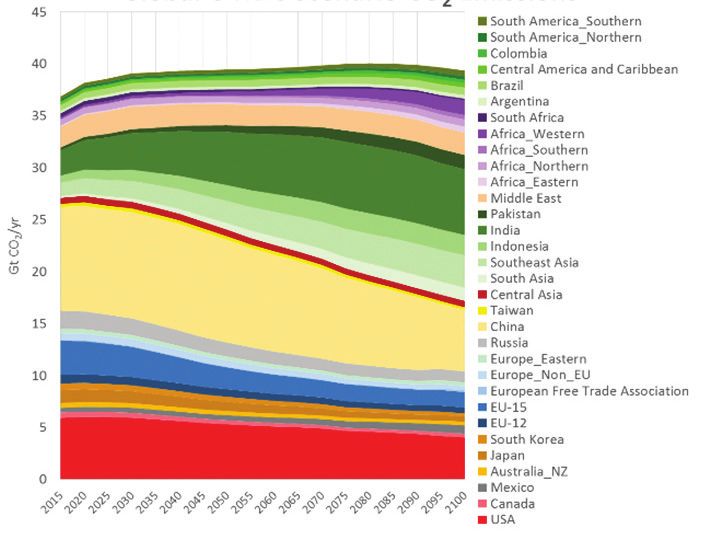
FIGURE 3 Global total GHG emissions in 2025 and 2030 under                                  CALCULATION OF POTENTIAL
                                       different scenarios
                                                                                                                     ENHANCED AMBITION
                                                                                                                     Showcasing the potential enhanced ambition that
                                                                                                                     could result from efficiency gains achieved by
                                                                                                                     Article 6 represents a key conceptual and empirical
                                                                                                                     contribution of this paper. It is therefore important to
                                                                                                                     be specific regarding how we calculate this potential.
                                                                                                                     The calculation of enhanced ambition by each of the
                                                                                                                     world’s regions, r, in each period, t, A(r,t)ENDC, is a
                                                                                                                     multi-step process that underpins our E-NDC scenario.
                        *The global GHG emissions in the literature were obtained from Rogelj et al. (2016)          We begin by defining several variables.

                                                  E(r,t)INDC = emissions in region r associated with that region’s NDC in period t.
                                             E(r,t)ENDC = emissions in region r when that region faces a carbon price P(t) in period t.
                                                                      P(t)ENDC = the global carbon price in period t.
                                                             C(r,t)INDC = cost of implementing region r’s NDC in period t.
                                   C(r,t)ENDC = cost of emissions mitigation in region r when that regions faces a carbon price P(t) in period t.
                                                     ET(r,t)ENDC = emissions sales by region r at a carbon price P(t) in period t.
                                                                              CT(r,t)ENDC = P(t)*ET(r,t)ENDC
                                           We begin by calculating total global cost of emissions mitigation for the I-NDC scenario, GC(t).
                                                                             We then find P(t) such that:

                                                                                         GC(t) =
                                                                                                   ∑C(r,t) =∑ C(r,t)
                                                                                                              INDC            ENDC
                                                                                                                                     .

                                   We then calculate the transfer payment needed in order to make the cost of independent implementation
                                    of the original NDC equivalent to the net cost of emissions mitigation with the global carbon price, P(t),
                                  including revenue (or payments) from net sales (or purchases) of emissions from the global carbon market.
                                                                    The value of net sales of ITMOs to the market are CT(r,t)E-NDC.
                                                                                           CT(r,t)ENDC = C(r,t)INDC - C(r,t)ENDC
                                                    The net transfer of ITMOs to other parties (or purchases if negative) is ET(r,t)E-NDC
                                                                                              ET(r,t)ENDC = CT(r,t)ENDC/P(t)
                                                                       Finally, the increase in ambition is calculated as the sum:
                                                                                   A(r,t)ENDC = E(r,t)ENDC – E(r,t)INDC – ET(r,t)ENDC

                        ASPECTS OUTSIDE OF SCOPE
                        There are some design choices that we do not explicitly                                      many references in the Paris Agreement that aim to
                        model. For example, we do not allow double counting,                                         avoid double counting. In addition, we do not model
                        something that is prohibited by the Paris Agreement.                                         transfers “inside or outside” of NDCs. The models
                        We assume environmental integrity in all transactions.                                       assume that countries transfer only from sectors that
                        Some proposed rules could result in double counting.                                         are quantified and correspondingly adjusted in their
                        Such transactions can be modeled, but are counter to                                         emissions accounts. Finally, we do not contemplate
TECHNICAL REPORT 2019

                        both the letter and the spirit of the Paris Agreement.                                       the use of pre-2020 Kyoto units. If these were allowed
                        Some parties have proposed that units issued from                                            for use without corresponding adjustments, it would
                        6.4 would not require a corresponding adjustment.                                            have the same effect of weakening the contributions
                        In discussions with analysts and modelers, such                                              of the parties involved in the transfers. Conversely, if
                        unaccounted sales would simply weaken the targets                                            these were allowed with corresponding adjustments,
                        from seller countries by the amounts transferred                                             then it would offer more integrity. Each of these design
                        —presuming that buyers would be willing to purchase                                          elements could make for useful topics addressed in
   5                    and use such units. Such a practice would conflict with                                      future research.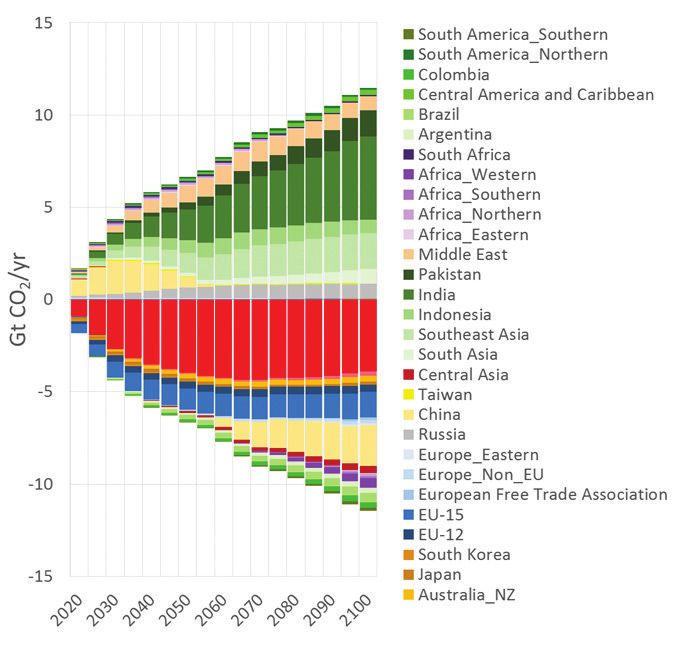
RESULTS

I
   n this section, we first estimate economic savings      ECONOMIC SAVINGS AND POTENTIAL
   that Article 6 could potentially provide in meeting     ENHANCED AMBITION
   NDCs as currently registered. We then investigate
                                                           I-NDC CO2 emissions for each of the 32 GCAM regions
   three alternative modeling assumptions. First, we
                                                           from 2015 to 2100 are displayed in Panel A of Figure 4.
investigate the effect of an alternative land-use policy
                                                           For several regions (e.g., China, Europe, and the U.S.),
assumption to understand the impact of this sector
                                                           continued ambition implies steadily declining
on overall cost-effectiveness. In our base scenario,
                                                           emissions. Shadow prices for the I-NDC are shown in
we assume that non-agricultural lands are protected
                                                           Panel C of Figure 4. In 2030 the shadow prices range
against deforestation, however, we make no attempt
                                                           from zero for minimal ambition to $101/tCO2 ($0 to
to expand forest areas for the purpose of increasing
                                                           $111/tCO2 in 2050; $16 to $209/tCO2 in 2100). The large
carbon storage. In our land-use sensitivity scenario,
                                                           variation in shadow prices implies large potential gains
we allow for policies to expand forest areas to increase
                                                           from collaborative actions.
carbon storage in land systems. Second, we investigate
the impact of the withdrawal of the United States (U.S.)   The common shadow price of carbon from the C-NDC
from the Paris Agreement. Third, we explore continued      scenario is shown in solid red in Panel C of Figure 4
and increased abatement efforts post-2030.                 with values of $38/tCO2 in 2030, $52/tCO2 in 2050,
                                                           and $107/tCO2 in 2100. Regional emissions consistent
                                                           with the common carbon shadow price are shown in
                                                           Panel B of Figure 4.

                                                           The regional differences between C-NDC and I-NDC
                                                           are shown in Panel D of Figure 4. The sum of positive
                                                           values (regions with increases in mitigation) represents
                                                           the size of the virtual physical (as opposed to financial)
                                                           carbon market, about 4.3 GtCO2/year in 2030,
                                                           roughly half of total global mitigation. A cooperatively
                                                           implemented, efficient emissions mitigation effort
                                                           would redistribute roughly 10 percent of emissions in
                                                           2030, growing to about 30 percent in 2100.

                                                                                                                        TECHNICAL REPORT 2019

                                                                                                                            6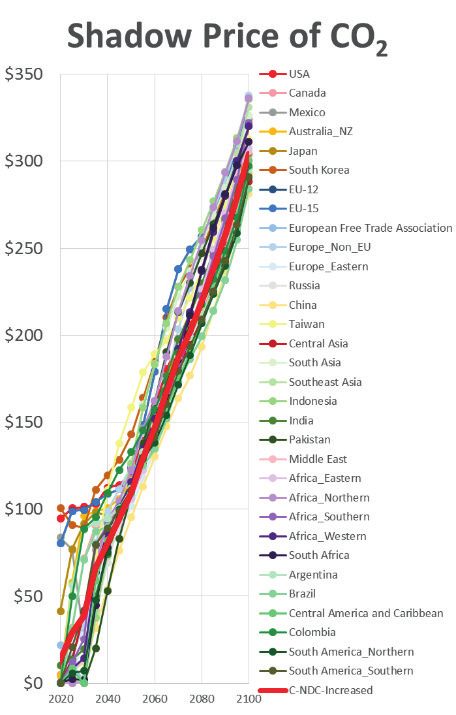
FIGURE 4 Energy and industry CO2 emissions (2015–2050) and emissions mitigation by region 2030, 2050 and 2100

                        Panel A: Global I-NDC scenario CO2 emissions                                               Panel B: Global C-NDC scenario CO2 emissions

                           Panel C: Shadow prices of CO2 I-NDC and C-NDC                                           Panel D: Change in CO2 emissions C-NDC less I-NDC

                                                                           2100

                        Compared with I-NDC, in the C-NDC scenario there are 11 regions that would increase their emissions mitigation in
                        every period through 2100, four would consistently mitigate less, and 17 regions are at different times on either side
TECHNICAL REPORT 2019

                        of the transaction. Since I-NDC and C-NDC scenarios have identical global emissions, the sum of differences is zero.

                        The financial size of the virtual carbon market is about $167 billion/year in 2030, increasing to $347 billion/year
                        in 2050 and reaching $1.2 trillion/year in 2100. Our estimate falls within the range of the World Bank’s estimate
                        of $100 billion to $400 billion in 2030 (World Bank and Ecofys, 2018) but is significantly greater than the Fujimori
                        et al. (2016) estimate of $58 billion (2015 $) in 2030, though aggregate physical carbon transfers are roughly equal.
                        The lower price likely traces to alternative assumptions regarding land-use change mitigation under Article 6. We
                        explore the implications of alternative land-use emissions mitigation policies similar to those of Fujimori et al. (2016)
   7                    in the next section.
FIGURE 5 Reduction in economic cost (global and regional)
Panel A: Reduction policy cost ($) Panel B: Climate policy cost (billion 2015 $/year)
Panel C: Global I-NDC mitigation costs (billion 2015 $/year) Panel D: Net annual GDP change (I-NDC less C-NDC;billion 2015 $)
Panel A of Figure 5 shows the global emissions mitigation costs under I-NDC and C-NDC, where economic
cost is measured as the integral under the marginal abatement supply schedule (JGCRI, 2018). Compared with
TECHNICAL REPORT 2019
I-NDC, C-NDC reduces costs by $249 billion (2015 $) per year (63 percent), $345 billion per year (41 percent), and
$988 billion per year (30 percent), in 2030, 2050, and 2100 respectively (Panel B of Figure 5). Annual undiscounted
I-NDC mitigation costs are shown in Panel C of Figure 5 and net reductions in cost are shown by region in Panel D
of Figure 5. Benefits accrue to all parties.
8One of the goals of Article 6 is to facilitate increased While all regions increase ambition under the E-NDC
ambition through cooperative implementation. We scenario, those enhanced ambitions are unavailable
estimate the potential enhanced ambition through absent Article 6 mechanisms. The common carbon
Article 6 by comparing E-NDC and I-NDC. Panel A of price that enables enhanced ambition is shown in
Figure 6 shows total global emissions under the I-NDC Panel B of Figure 6. Enhanced ambition under the
and E-NDC scenarios and the additional ambition for E-NDC scenario roughly doubles the marginal cost of
each region in the first commitment period. In 2030 carbon in 2030 compared to the C-NDC scenario, but
annual global carbon emissions mitigation is roughly keeps net annual mitigation costs by region constant
5 GtCO2/year greater under E-NDC than under I-NDC. at I-NDC levels. The requisite financial transfers to
The cumulative additional mitigation enabled by leave each region with identical total cost as in the
perfect implementation of Article 6, with continued I-NDC scenario are shown in Panel C of Figure 6.
ambition as per Fawcett et al. (2015), over the course These are equivalent to the value of ITMOs that would
of the century exceeds 520 GtCO2. The enhanced be created to implement Article 6 transactions in the
emissions mitigation scenario enables 50 percent E-NDC scenario. The implied physical emissions trades
more mitigation compared to I-NDC. between regions under the E-NDC scenario would
be about 4.4 GtCO2/year in 2030, similar to emissions
redistributed under C-NDC.
FIGURE 6 Enhanced ambition enabled by Article 6
Potential first commitment period enhanced ambition
Panel A: Global CO2 emissions from energy and industry
Panel B: Shadow Price of CO2 for the C-NDC and E-NDC scenarios Panel C: Financial transfers necessary to equate mitigation cost in each
region in the E-NDC and I-NDC scenarios, valued at the E-NDC shadow
price of carbon in the E-NDC scenario
TECHNICAL REPORT 2019
9IMPACT OF RESTRICTING FIGURE 8 CO2 emissions traded and the size of carbon market
LAND-USE SECTOR
Panel A: Buyers and sellers under Article 6 (UCT)
Land-use policies are important for the cost-
effectiveness of climate change mitigation. We
develop an alternative scenario that constrains CO2
emissions with policies in both land-use change and
energy and industry. In the universal carbon tax (UCT)
scenario, CO2 emissions from the terrestrial system are
valued equally with CO2 emissions from fossil fuel and
industrial sources. The total CO2 emissions from land
and energy systems in the UCT scenario is the same
as those in the I-NDC scenario, but the I-NDC scenario
assumes “protected lands” whereas the UCT scenario
assumes a universal carbon tax applied equally to all
emissions regardless of their origin.
The comprehensive approach of integrating terrestrial
and energy systems could lower the cost of meeting
the same mitigation target, consistent with findings of
other studies (Tavoni et al., 2007; Wise et al., 2009). The
shadow price of carbon in 2030 is as low as $8/tCO2 in
the UCT scenario (Figure 7), similar to the estimate of
Fujimori et al. (2016). The physical amount of carbon
traded in the virtual market is roughly 5.4 GtCO2
in 2030, 25 percent bigger than that in the I-NDC
scenario. However, because of the lower shadow price,
the financial size of carbon market is much smaller Panel B: Emissions trading market size
in 2030, about $43 billion (Figure 8). Meanwhile, the
potential sellers and buyers in the virtual carbon
market also change. Brazil and Africa become the
largest sellers before 2050, as shown in other studies
(EDF, 2016), and China, one of the major sellers in
the first half of the century under the I-NDC scenario,
becomes a buyer in the UCT scenario.
FIGURE 7 Shadow prices of CO2 in the I-NDC-UCT scenario
TECHNICAL REPORT 2019
10IMPACT OF U.S. WITHDRAWAL The U.S. does not take any mitigation actions after
The U.S. announced its intention to withdraw from 2010 in the C-NDC (No U.S.) scenario and does not
the Paris Agreement in 2017. We have developed participate in the emissions trading under Article 6.
two alternative scenarios to assess the potential
CO2 emissions for each of the 32 GCAM regions under
implications of this action for the implementation
the No U.S. scenarios are shown in Figure 10, panels
of Article 6. The I-NDC (No U.S.) scenario assumes
A and B. The other 31 regions keep the same level
that countries except the U.S. meet their NDC
of ambition as the I-NDC scenarios, whereas U.S.
commitments through 2030 and continue at the same
emissions continue to rise. With no mitigation effort
level of decarbonization effort required to achieve
in the U.S., the global CO2 emissions from energy and
their NDCs beyond 2030. In this scenario, the U.S.
industry increase by 9 percent in 2030 (18 percent
takes no mitigation effort to reduce GHG emissions
in 2050 and 32 percent in 2100), compared with the
after 2010, while other countries are held to the
I-NDC scenario.
same level of mitigation as in the I-NDC scenario. It is
worth noting that this scenario design is a bounding
The changes in emissions for each region between
scenario. It assumes that the U.S. remains on its
independent and cooperative implementation
reference trajectory, moderately only by interactions
scenarios without U.S. participation differ from
with other countries through international energy and
changes between the I-NDC and C-NDC scenarios,
commodity markets. It does not include the effects
as the size of the virtual physical carbon market is
of measures undertaken to reduce emissions by
different and smaller without U.S. participation. The
states and local governments and non-government
shadow prices of carbon are also lower, ranging from
actors, which could have a significant impact on U.S.
$0 to $94/tCO2 in 2030, $0 to $100/tCO2 in 2050,
emissions (America’s Pledge, 2018). The No U.S.
and $13 to $185/tCO2 in 2100 in the independent
scenario shown in Figure 9 is an upper bound on
implementation case. The variation in shadow prices
U.S. and global I-NDC emissions.
across regions implies potential collaboration in
mitigation. Cooperative implementation would reduce
FIGURE 9 Global fossil fuel and industrial CO2 emissions the shadow price due to its economic efficiency
in the I-NDC and I-NDC (No U.S.) scenarios
—$7/tCO2 in 2030, $40/tCO2 in 2050, and $88/tCO2
in 2100 (Figure 10, Panel C).
The size of the virtual physical carbon market is
much smaller without the U.S. participation—only
2.1 GtCO2/year in 2030 (4.3 GtCO2/year in 2030 with
U.S. participation). The financial size of the virtual
carbon market is also much smaller, about $15 billion
in 2030, $164 billion in 2050, and $855 billion in 2100.
The potential sellers and buyers are similar with and
without U.S. participation, but the impact on China
is substantial. The U.S. is the second largest GHG
emitter globally. Without its participation, both China’s
role and the amount of carbon it purchases change
The C-NDC (No U.S.) scenario assumes that significantly. China changes in 2045 from a potential
countries except the U.S. collaboratively implement seller to a potential buyer, whereas this change
TECHNICAL REPORT 2019
their NDCs and reduce emissions beyond 2030. happens in 2060 with U.S. participation. The amount
Following Article 6 of the Paris Agreement, they can of carbon China purchased from the virtual market
purchase and sell ITMOs to achieve decarbonization also increases, from 2.2 GtCO2/year in 2100 with U.S.
goals collaboratively. The aggregate of energy participation to 3.3 GtCO2/year in 2100 without U.S.
and industrial CO2 emissions from these countries participation.
throughout the 21st century are the same in the
I-NDC (No U.S.) and C-NDC (No U.S.) scenarios.
11FIGURE 10 CO2 emissions and carbon market without U.S. participation
Panel A: I-NDC (No U.S.) scenario CO2 emissions Panel B: C-NDC (No U.S.) scenario CO2 emissions
Panel C: Shadow prices of CO2 (No U.S.) Panel D: Buyers and sellers under Article 6 (No U.S.)
TECHNICAL REPORT 2019
12INCREASED AMBITION POST-2030 With more ambitious post-2030 mitigation actions,
Current commitments in NDCs are not sufficient all regions, including regions with less robust NDCs,
to limit global temperature rise well below 2°C have a significant reduction in CO2 emissions (Panel A
(Fawcett et al., 2015; Rogelj et al., 2016; IPCC, 2018). of Figure 12). Compared with continued ambition
To meet the long-term temperature goal set by the scenarios, the shadow prices of carbon in the
Paris Agreement, countries need to increase their increased ambition scenarios are much higher and
ambitions over time. Here we develop alternative more consistent across regions, as all regions have
scenarios to assess the value of Article 6 when more robust mitigation efforts. As shown in Panel
countries increase their ambitions after 2030. B of Figure 12, the shadow prices of carbon in the
I-NDC-Increased scenario range from $95/tCO2 to
We examine two scenarios with increased ambition $159/tCO2 in 2050 and $281/tCO2 to $338/tCO2 in 2100.
—I-NDC-Increased and C-NDC-Increased, In the C-NDC-Increased scenario, the common shadow
which indicate independent and cooperative prices of carbon are $110/tCO2 and $304/tCO2 in 2050
implementation of NDCs and commitments and 2100 respectively.
afterwards. Both scenarios assume that countries
meet their NDC commitments through 2030, which The region-by-region difference between independent
are the same as our main I-NDC and C-NDC scenarios, and cooperative mitigation efforts is shown in Panel C
and then increase the level of decarbonization of Figure 12. Compared with the continued ambition
effort beyond 2030. In the increased ambition scenarios, the size of the virtual physical carbon
scenarios, we assume that countries decarbonize market is much smaller now—about 3.8 GtCO2/year in
their economies at an accelerating rate—a higher 2050 and 5.3 GtCO2/year in 2100—because of more
minimum decarbonization rate of 5 percent per ambitious mitigation efforts in each of the 32 regions.
year, which is consistent with the Paris-Increased However, the financial flow is more significant due to
Ambition scenario in Fawcett et al. (2015). the higher shadow price of carbon. The market size
in financial values is about $419 billion in 2050 and
Compared with the main scenarios with continued reaches $1.6 trillion in 2100. The potential buyers and
ambition, the increased ambition scenarios reduce sellers also change, especially in the second half of
global CO2 emissions by 34 percent in 2050 and the century. With a large-scale energy system and
83 percent in 2100 (Figure 11) and decrease the more flexibility of fuel switching and reducing carbon
probability of temperature change exceeding 2°C emissions at lower costs, China is the biggest seller in
in 2100 by 26 percent (see Fawcett et al. for the the virtual carbon market throughout the century, and
probabilities of temperature rise). the U.S. also becomes a seller towards the end of the
century.
FIGURE 11 Global fossil fuel and industrial CO2 emissions in the
I-NDC-Increased and C-NDC-Increased scenarios
TECHNICAL REPORT 2019
13FIGURE 12 CO2 emissions and carbon market with more ambitious post-2030 mitigation
Panel A: I-NDC increased scenario CO2 emissions C-NDC increased scenario CO2 emissions Panel B: Shadow price of C02
Panel C: Buyers and sellers under Article 6 Panel D: Emissions trading market size
Sellers
Buyers
TECHNICAL REPORT 2019
14DISCUSSION
S
The challenges of realizing the full potential cost
ubstantial potential exists for parties to work
savings and enhanced ambition of Article 6 should
together via Article 6 to either lower the costs
not be underestimated. However, Article 6 may
of achieving their pledges under the Paris
become a necessary tool if NDCs are to approach
Agreement or increase their ambition in the
zero. Since parties will have different capacities for
first commitment period. Achieving that potential
net-negative emissions and different amounts of
remains a formidable challenge.
residual unabatable emissions, Article 6 trading will
likely be necessary to incentivize parties with excess
In the near term, just writing the rules has proved
capacity to go net-negative to balance out remaining
difficult. It is not obvious how to facilitate the
emissions from parties without the ability to mitigate
creation and trade of ITMOs under Article 6 given
to net zero. Furthermore, dynamic technology and
the heterogeneity in targets and policies across
capital investment effects need to be evaluated.
NDCs (Das, 2015; Hood and Soo, 2017; Mehling et al.,
Cooperation will tend to shift emissions mitigation
2018; Rose et al., 2018). Metcalf and Weisbach (2011)
to places with a comparative advantage along with
initiated an active vein of the economics literature
capital investment and infrastructure for emissions
(e.g, Bodansky et al., 2016) that investigates how to
mitigation. But it also shifts mitigation, capital and
establish linkages between disparate programs,
infrastructure investments away from regions
such as emissions trading systems and carbon taxes
with the highest ambition.
or regulatory schemes, while avoiding double-
counting or emissions leakage.
Using modeling tools to test the implications of
rules to implement Article 6 is essential for a clear
In order to meet the Paris goals, initial commitments
understanding of the feedbacks and interactions
need to be enhanced in second and subsequent
across scales. It has been demonstrated that rules
commitment periods. To limit climate change to
that seem effective at project scales can behave
1.5°C or 2°C, it is essential that these cost savings
very differently at macro scales (Calvin, et al. 2015;
translate into enhanced ambition, rather than simply
Rockström et al., 2017). The issue of leakage will be
rewarding lack of further ambition after countries
important to explore including differential leakage
achieve initial pledges (Metcalf and Weisbach, 2011;
across sectors.
Calvin et al., 2015; Ostrom, 2010; Lutter and Shogren,
2002; Becker, 2000; Höhne et al., 2017). Rules to
The Paris Agreement Rulebook, under development
guard against this could include options such as
and due for adoption at COP 25, is expected to
limiting ITMO sales by an inverse proportion to actual
elaborate the rules and implementation guidance
emissions, or the phase-in of ratcheting mechanisms.
needed to operationalize the Paris Agreement,
This may be necessary to avoid the linkage of
including Article 6. Wisely written rules could result in
programs leading to an increase in overall emissions.
substantial cost savings that translate into enhanced
Article 6 might also provide peer pressure insofar as
TECHNICAL REPORT 2019
mitigation, while poorly written rules could frustrate
climate clubs emerge, since many countries say that
the performance of the Paris Agreement.
they will only link or import from countries that have
credible NDCs (Mehling et al., 2018; Iyer et al., 2015;
La Hoz Theuer, 2018; Peters et al., 2017).
15FUTURE RESEARCH
T
here is a plethora of future research topics to The rigorous analysis of how market access through
explore on Article 6 and the Paris Agreement, “carbon clubs” could encourage use of specific
some of which are amenable to quantitative ratcheting mechanisms, intended to incentivize
methodologies, including integrated enhanced ambition over time, would likely be
assessment models, while others are better suited particularly helpful as negotiators continue their work
for qualitative analysis. As an extension to this paper, to fill the well-known emissions gap. Characterizing
the role of the land-use sector under Article 6 of the these combinations of clubs and ratcheting
Paris Agreement would benefit from more quantitative mechanisms then modeling them in a quantitative
analysis via an integrated assessment model. However, framework is a promising area for future research and
a qualitative analysis that describes protocols for offset will facilitate the identification of actionable strategies
quality related to the land-use sector and assesses that negotiators can incorporate into negotiating text.
strategies for addressing leakage of emissions would
complement further quantitative analysis.
This paper explored a scenario that assumes that
cost savings from international carbon trading were
reinvested back into enhanced ambition. Further
quantitative explorations regarding the implications
of this assumption and potential mechanisms to
encourage that outcome could be useful extensions.
In particular, an elaboration on the extent to which
cost savings from international trading under Article 6
increases the probability of achieving a 2ºC or lower
target would provide insights on how to fill the well-
known emissions gap between current pledges and
climate targets. In addition, a qualitative analysis that
contemplates the extent to which countries will choose
to reinvest cost savings into enhanced ambition,
rather than simply keeping those savings, would test
an underlying assumption of this paper and provide
a starting point for creating incentives and rules that
encourage countries participating in international
carbon trading to assertively enhance their ambition.
TECHNICAL REPORT 2019
16REFERENCES
1 Aldy J., et al. 2016. “Economic tools to promote transparency 15 Keohane, R.O. and Oppenheimer, M. 2016. “Paris: Beyond the
and comparability in the Paris Agreement.” Nature Climate Climate Dead End through Pledge and Review?” Politics and
Change, 6, 1000. Governance, 4.
2 America’s Pledge Initiative on Climate. 2018. “Fulfilling 16 Fujimori, S. et al. 2016. “Will international emissions trading help
America’s Pledge: How States, Cities, and Business Are Leading achieve the objectives of the Paris Agreement?” Environmental
the United States to a Low-Carbon Future.” Report. Bloomberg Research Letters, 11, 104001.
Philanthropies Support: New York. https://www.bbhub.io/
17 La Hoz Theuer, S., Schneider, L., and Broekhoff, D. 2018. “When
dotorg/sites/28/2018/09/Fulfilling-Americas-Pledge-2018.pdf
less is more: Limits to international transfers under Article 6 of
3 Becker, G.S. 2000. “A Comment on the Conference on Cost- the Paris Agreement.” Climate Policy, 1–13.
Benefit Analysis.” The Journal of Legal Studies, 29, 1149–1152.
18 Lutter, R. and Shogren, J. F. 2002. “Tradable permit tariffs: How
4 Bodansky, D.M., Hoedl, S.A., Metcalf, G.E., and Stavins, R.N. local air pollution affects carbon emissions permit trading.”
2016. “Facilitating linkage of climate policies through the Paris Land Economics, 78, 159–170.
outcome.” Climate Policy, 16, 956–972.
19 Mani, M,. Hussein, Z., Gopalakrishnan, B.N., and Wadhwa, D.
5 Calvin, K. et al. 2015. “Global climate, energy, and economic 2018. “Paris Climate Agreement and the Global Economy.”
implications of international energy offsets programs.” World Bank Group, South Asia Region, Office of the Chief
Climatic Change, 133, 583–596. Economist.
6 Das, K. 2015. “Climate clubs: Carrots, sticks and more.” 20 Mehling, M.A., Metcalf, G.E., and Stavins, R.N. 2018. “Linking
Economic & Political Weekly, 50, 24–27. climate policies to advance global mitigation.” Science, 359,
997–998.
7 Environmental Defense Fund. 2016. “Cost-effective emissions
reductions beyond Brazil’s international target: Estimation 21 Nordhaus, W. 2015. “Climate clubs: Overcoming free-riding in
and valuation of Brazil’s potential climate asset.” Report. international climate policy.” American Economic Review, 105,
Environmental Defense Fund: New York. 1339–1370.
8 Fawcett, A.A., et al. 2015. “Can Paris pledges avert severe 22 Metcalf, G.E. and Weisbach, D. 2011. “Linking policies when
climate change?” Science, 350, 1168–1169. tastes differ: Global climate policy in a heterogeneous world.”
Review of Environmental Economics and Policy, 6, 110–129.
9 Höhne, N. et al. 2017. “The Paris Agreement: resolving
the inconsistency between global goals and national 23 Ostrom, E. 2010. “Polycentric systems for coping with collective
contributions.” Climate Policy, 17, 16–32. action and global environmental change.” Global environmental
change, 20, 550–557.
10 Hood, C. and Soo, C. (2017) “Accounting for mitigation
targets in Nationally Determined Contributions under the 24 Peters, G.P. et al. 2017. “Key indicators to track current progress
Paris Agreement.” Report. OECD: Paris. https://www.oecd. and future ambition of the Paris Agreement.” Nature Climate
org/environment/cc/Accounting-for-mitigation-targets- Change, 7, 118.
in-Nationally-Determined-Contributions-under-the-Paris-
25 Rockström, J. et al. 2-17. “A roadmap for rapid decarbonization.”
Agreement.pdf
Science, 355, 1269–1271.
11 Iyer, G.C. et al. 2015. “The contribution of Paris to limit global
26 Rogelj, J. et al. 2016. “Paris Agreement climate proposals need a
warming to 2°C.” Environmental Research Letters, 10, 125002.
boost to keep warming well below 2°C.” Nature, 534, 631.
12 IPCC. 2018. “Summary for Policymakers.” In Global warming
27 Rose, A., Wei, D., Miller, N., Vandyck, T., and Flachsland, C. 2018.
of 1.5°C: An IPCC Special Report on the impacts of global
“Policy brief—Achieving Paris Climate Agreement pledges:
warming of 1.5°C above pre-industrial levels and related
Alternative designs for linking emissions trading systems.”
global greenhouse gas emission pathways, in the context of
Review of Environmental Economics and Policy, 12, 170–182.
strengthening the global response to the threat of climate
change, sustainable development, and efforts to eradicate 28 Tavoni, M., Sohngen, B, and Bosetti, V. 2007. “Forestry and the
poverty. World Meteorological Organization: Geneva, carbon market response to stabilize climate.” Energy Policy, 35,
Switzerland. 5346–5353.
TECHNICAL REPORT 2019
13 Joint Global Change Research Institute. 2017. Global Change 29 United Nations. 2015. The Paris Agreement.
Assessment Model 4.4. Available at: https://github.com/JGCRI/
gcam-core/releases 30 Wise, M. et al. 2009. “Implications of limiting CO2 concentrations
for land use and energy.” Science, 324, 1183–1186.
14 Joint Global Change Research Institute. 2018. GCAM Wiki
31 World Bank and Ecofys. 2015. State and Trends of Carbon Pricing
Documentation. http://jgcri.github.io/gcam-doc/
2015 (September). World Bank: Washington, D.C.
32 World Bank and Ecofys. 2018. State and Trends of Carbon Pricing
2018 (May). World Bank: Washington, D.C.
19www.carbonpricingleadership.org
You can also read