Changes in uPA, PAI-1, and TGF-β Production during Breast Cancer Cell Interaction with Human Mesenchymal Stroma/Stem-Like Cells (MSC) - MDPI
←
→
Page content transcription
If your browser does not render page correctly, please read the page content below
International Journal of
            Molecular Sciences

Article
Changes in uPA, PAI-1, and TGF-β Production
during Breast Cancer Cell Interaction with Human
Mesenchymal Stroma/Stem-Like Cells (MSC)
Catharina Melzer 1 , Juliane von der Ohe 1 , Hannah Otterbein 2 , Hendrik Ungefroren 2,3
and Ralf Hass 1, *
 1    Biochemistry and Tumor Biology Lab, Department of Obstetrics and Gynecology, Hannover Medical School,
      30625 Hannover, Germany; melzer.catharina@mh-hannover.de (C.M.);
      Ohe.Juliane.von.der@mh-hannover.de (J.v.d.O.)
 2    First Department of Medicine, UKSH, Campus Lübeck, 23538 Lübeck, Germany;
      hannahotterbein@web.de (H.O.); Hendrik.Ungefroren@uksh.de (H.U.)
 3    Department of General Surgery, Visceral, Thoracic, Transplantation and Pediatric Surgery, UKSH,
      Campus Kiel, 24105 Kiel, Germany
 *    Correspondence: hass.ralf@mh-hannover.de; Tel.: +49-511-532-6070

 Received: 28 March 2019; Accepted: 24 May 2019; Published: 28 May 2019

 Abstract: The interactions of cancer cells with neighboring non-malignant cells in the microenvironment
 play an important role for progressive neoplastic development and metastasis. Long-term direct co-culture
 of human MDA-MB-231cherry breast cancer cells with benign human mesenchymal stroma/stem-like
 cells (MSC) MSC544GFP stably expressing mCherry and eGFP fluorescence proteins, respectively, was
 associated with the formation of three-dimensional (3D) tumor spheroids in vitro. The quantification of
 the breast tumor marker urokinase plasminogen activator (uPA) in mono-cultured MDA-MB-231
 cells revealed an approximately 14-fold enhanced expression when compared to five different normal
 human MSC mono-cultures. Moreover, uPA levels in 3D tumor spheroids remained elevated
 9.4-fold above the average of five different human MSC cultures. In contrast, the expression of the
 corresponding plasminogen activator inhibitor type-1 (PAI-1) declined by 2.6-fold in the breast cancer
 cells and was even further reduced by 3.2-fold in the MDA-MB-231cherry /MSC544GFP 3D co-culture
 spheroids when compared to the various MSC populations. The supportive data were obtained for
 the production of TGF-β1, which is an important growth factor in the regulation of tumor growth and
 metastasis formation. Whereas, TGF-β1 release in MDA-MB-231cherry /MSC544GFP co-cultures was
 elevated by 1.56-fold as compared to MSC544 mono-cultures after 24 h; this ratio further increased
 to 2.19-fold after 72 h. Quantitative PCR analyses in MSC544 and MDA-MB-231 cells revealed that
 MSC, rather than the breast cancer cells, are responsible for TGF-β1 synthesis and that TGF-β1
 contributes to its own synthesis in these cells. These findings suggested potential synergistic effects
 in the expression/secretion of uPA, PAI-1, and TGF-β during the co-culture of breast cancer cells
 with MSC.

 Keywords: mesenchymal stem cells; breast cancer; cancer cell interaction; co-culture; tumor
 microenvironment; uPA; PAI-1; TGF-β

1. Introduction
      In the course of tumor development and formation of metastases, cancer cells change cell fate,
adhesive properties, cell movements, and motility during interactions with the microenvironment [1].
The cancer cells interact with components of the extracellular matrix and adjacent stromal
cells, such as tumor-associated macrophages, cancer-associated fibroblasts, different immune cell

Int. J. Mol. Sci. 2019, 20, 2630; doi:10.3390/ijms20112630                        www.mdpi.com/journal/ijms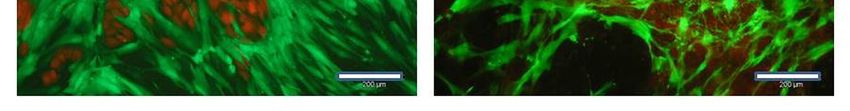
Int. J. Mol. Sci. 2019, 20, 2630                                                                      2 of 12

subsets (lymphocytes, natural killer cells, dendritic cells), adipocytes, endothelial cells, pericytes,
and mesenchymal stroma/stem-like cells (MSC) [2–4]. Moreover, reciprocal release and uptake of
extracellular vesicles and factors, including proteinases and growth factors, contribute to cancer cell
interactions. Among those are the serine proteinase urokinase plasminogen activator (uPA), its inhibitor
plasminogen activator inhibitor type-1 (PAI-1), and the regulatory cytokine transforming growth
factor-β (TGF-β).
      Physiological uPA can exist in different forms, including a high molecular weight (HMW)-uPA
with two amino acid chains that were connected by a disulfide bridge and a low molecular weight
(LMW)-uPA form exhibiting proteolytic activity. The substrates for uPA are several components of
the extracellular matrix and a predominant target of uPA is represented by plasminogen with the
subsequent conversion to plasmin upon uPA-mediated cleavage of a specific Arg-Val amino acid bond.
The activation of uPA and subsequent degradation of target proteins can further relay proteolytic
cascades, which also play an important role during neoplastic development [5].
      PAI-1, which is also known as serpin E1, functions as a serine proteinase inhibitor (serpin)
and it predominantly targets uPA besides tissue plasminogen activator and some distinct matrix
metalloproteinases [6]. The inhibitory activity is mediated by either direct binding of PAI-1 to the active
site of uPA and/or by the association of PAI-1 with the uPA/uPAR receptor complex. Both uPA and PAI-1
play an important role as prognostic factors in breast cancer [7]. In clinical practice, the determination of
uPA and PAI-1 (by ELISA) is used for nodal negative mammary carcinoma with intermediate grading,
whereby uPA and PAI-1 levels are separately evaluated to estimate the necessity of chemotherapy
among other parameters at the highest level of evidence.
      The three isoforms of TGF-β (TGF-β1-3) belong to the TGF-β/BMP/activin superfamily of the
growth and differentiation factors. TGF-β1 controls proliferation, differentiation, apoptosis, and cell
motility, and it is produced by both MSC and breast cancer cells. It acts as a tumor suppressor in normal
epithelial cells and premalignant tumor stages, but it can simultaneously promote tumor progression
through tumor-cell-autonomous and tumor-stroma interactions which can evolve during immune
evasion, stimulation of angiogenesis, and metastatic development [8]. The TGF-β propeptide is part
of a complex together with latent TGF-β binding protein (LTBP), termed latency-associated peptide
(LAP), prior to its secretion. Still inside the cell, the propeptide is cleaved from the precursor, but it
remains associated with LAP via strong non-covalent interactions. The uPA-generated plasmin serum
proteinase as well as the matrix metalloproteinases MMP-2 and MMP-9 can catalyze the release of
active TGF-β from LAP by proteolytic degradation [9].
      In the present work, we demonstrate the alterations in the production of uPA, PAI-1, and TGF-β
during co-culture of MSC with highly malignant breast cancer cells that may support continued
tumor growth.

2. Results and Discussion
     We now tested the role of a MSC population derived from a benign human phyllodes tumor,
while previous works demonstrated various types of indirect and direct interactions between normal
primary human MSC and breast cancer cells [4,10]. In contrast to our normal primary human MSC
that maintain proliferative capacity, cell fate, and marker expression for up to 10 cell passages [11–13],
the neoplastic tissue-derived MSC544 continued to grow and it maintained the expression of typical
MSC markers beyond passage 10 (P10). Thus, flow cytometry analysis of ecto-5’-nucleotidase (CD73),
Thy-1 membrane glycoprotein (CD90), and endoglin (CD105), which is a component of the TGF-β
receptor complex, revealed the simultaneous presence on more than 99% of MSC544 after P22,
suggesting the long-term maintenance of MSC characteristics (Figure 1).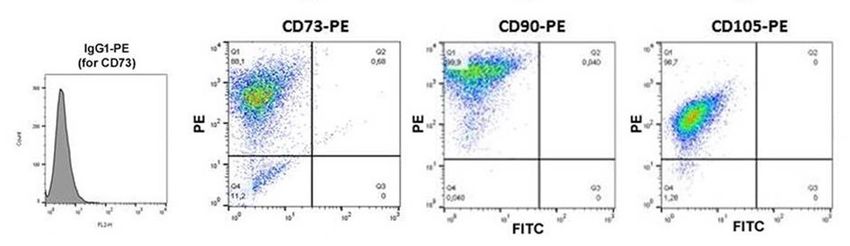
Int. J. Mol. Sci. 2019, 20, 2630 3 of 12
Int. J. Mol. Sci. 2017, 18, x FOR PEER REVIEW 3 of 12
Figure 1. Expression of typical mesenchymal stroma/stem-like cells (MSC) markers in MSC544. Isolated
Figure 1. Expression of typical mesenchymal stroma/stem-like cells (MSC) markers in MSC544.
human MSC544 from a patient with a benign phyllodes tumor were long-term cultured (until P15
Isolated human MSC544 from a patient with a benign phyllodes tumor were long-term cultured (until
(for CD73) and P22 (for CD90 and CD105)), whereby the presence of surface markers that are associated
P15 (for CD73) and P22 (for CD90 and CD105)), whereby the presence of surface markers that are
with a mesenchymal stroma-/stem-like cell phenotype could be characterized.
associated with a mesenchymal stroma-/stem-like cell phenotype could be characterized.
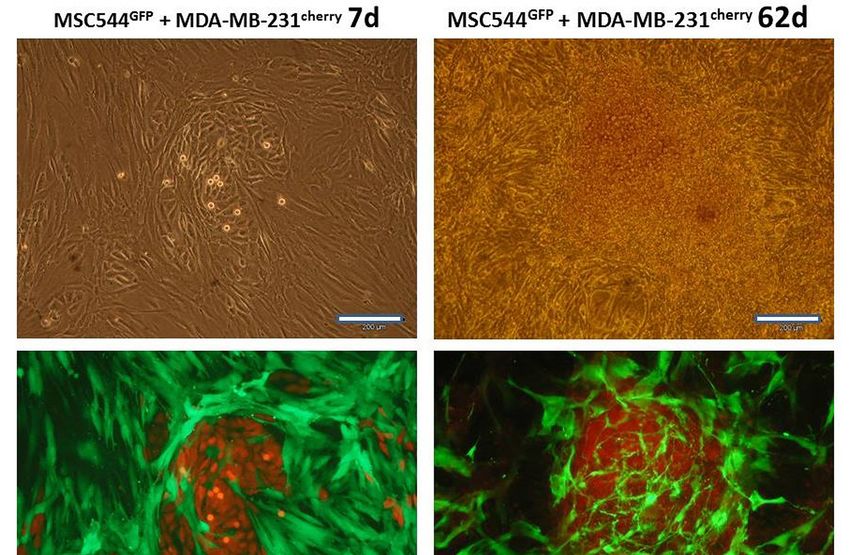
Co-cultures of lentivirus-labeled MSC544GFP populations, together with MDA-MB-231cherry ,
Co-cultures of lentivirus-labeled MSC544GFP populations, together with MDA-MB-231cherry,
demonstrated breast cancer cell colony patches with surrounding MSC after 7d, as documented by
demonstrated breast cancer cell colony patches with surrounding MSC after 7d, as documented by
phase contrast and double fluorescence microscopy (Figure 2, left panels). Similar findings were
phase contrast and double fluorescence microscopy (Figure 2, left panels). Similar findings were
previously observed during the interaction of normal primary human MSC with breast cancer cells [10].
previously observed during the interaction of normal primary human MSC with breast cancer cells
However, recent data have demonstrated that slower proliferating normal primary human MSC are
[10]. However, recent data have demonstrated that slower proliferating normal primary human MSC
rapidly overgrown by breast cancer cells with less than 1% of total cell counts remaining after 14 days
are rapidly overgrown by breast cancer cells with less than 1% of total cell counts remaining after 14
of co-culture both, in vitro and in vivo [14]. In contrast, MSC544GFP also remained proliferation-active
days of co-culture both, in vitro and in vivo [14]. In contrast, MSC544GFP also remainedcherry
proliferation-
in long-term co-culture with breast cancer cells. While co-cultured MDA-MB-231 cherry cells had
active in long-term co-culture with breast cancer cells. While co-cultured MDA-MB-231 cells had
formed three-dimensional (3D) spheroids after 62 days, MSC544GFP established a cellular network
formed three-dimensional (3D) spheroids after 62 days, MSC544 GFP established a cellular network
surrounding these 3D cell clusters (Figure 2, right panels). Nevertheless, the phase contrast micrograph
surrounding these 3D cell clusters (Figure 2, right panels). Nevertheless, the phase contrast
of the 62 days co-culture revealed the complete coverage with cells (Figure 2, upper panel, right
micrograph of the 62 days co-culture revealed the complete coverage with cells (Figure 2, upper
micrograph). While the red fluorescence and the double fluorescence channels revealed red images
panel, right micrograph). While the red fluorescence and the double fluorescence channels revealed
with indistinguishable morphologies, the corresponding selective cell population micrographs were
red images with indistinguishable morphologies, the corresponding selective cell population
obtained from the green fluorescent channel (Figure 2, lower panel, right micrograph), which suggested
micrographs were obtained from the green fluorescent channel (Figure 2, lower panel, right
the presence of a majority of MDA-MB-231cherry breast cancer cells with partial detection of a bright
micrograph), which suggested the presence of a majority of MDA-MB-231cherry breast cancer cells with
cherry cross-fluorescence obtained from the 3D breast cancer spheroids.
partial detection of a bright cherry cross-fluorescence obtained from the 3D breast cancer spheroids.
Moreover, the appearance of multiple 3D breast cancer spheroids and disseminated MDA-MB-231
cells in the co-culture suggested the enhanced liberation and distribution of the breast cancer cells.
Indeed, previous work has demonstrated changes in these organoid structures by MSC-mediated
decrease of E-cadherin in breast cancer spheroids [15,16]. This is also substantiated by high uPA levels
in MDA-MB-231 cells (Figure 3), whereby uPA represents one of the serine proteinases that contribute
to matrix digestion and thus cellular motility. Previous work suggested that elevated uPA levels in
association with the plasminogen activation system correlates with tumor malignancy. Consequently,
partial tumor tissue degradation by the urokinase system, followed by the liberation of cancer cells,
facilitates tissue invasion and contributes to metastasis, which therefore may represent a potential
drug target using anticancer agents [17]. Indeed, the reduction of Migfilin, β-catenin, and uPA via the
depletion of the regulatory vasodilator-stimulated phosphoprotein inhibited tumor spheroid invasion
of MDA-MB-231 cells [18]. More specifically, the down-modulation of uPA by targeting the uPA 3’
untranslated region with microRNA-645 reduced the invasive growth of MDA-MB-231 cells [19].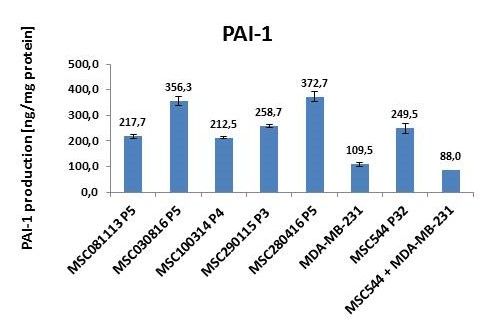
Int. J. Mol. Sci. 2019, 20, 2630                                                                          4 of 12
 Int. J. Mol. Sci. 2017, 18, x FOR PEER REVIEW                                                           4 of 12

     Figure 2. Long-term co-culture of human MSC544       GFP with MDA-MB-231cherry breast cancer cells.
      Figure 2. Long-term co-culture of human MSC544GFP with MDA-MB-231cherry breast cancer cells. Phase
     Phase contrast (upper panel) microscopy, double fluorescence (red + green) microscopy (lower panel,
      contrast (upper panel) microscopy, double fluorescence (red + green) microscopy (lower panel, left
     left micrograph), and only green fluorescence microscopy (lower panel, right micrograph) was
      micrograph), and only green fluorescence  microscopy (lower panel,  right micrograph) was performed
     performed in co-culturesGFP  of MSC544GFP with cherry
                                                       MDA-MB-231cherry breast cancer cells for 7d and
      in co-cultures of MSC544 with MDA-MB-231             breast cancer cells for 7d and 62d, respectively.
     62d, respectively. The highly proliferating and overgrowing breast cancer cells were forming
      The highly proliferating and overgrowing breast cancer cells were forming three-dimensional (3D)
     three-dimensional (3D) spheroids together with MSC after 62d whereby the bright cherry fluorescence
      spheroids together with MSC after 62d whereby the bright cherry fluorescence was partially
     was partially detectable in the green fluorescence channel (lower panel, right micrograph). Scale bars:
      detectable in the green fluorescence channel (lower panel, right micrograph). Scale bars: 200µm.
     200 µm.
      Moreover, the appearance of multiple 3D breast cancer spheroids and disseminated MDA-MB-
231 cells in the co-culture suggested the enhanced liberation and distribution of the breast cancer
cells. Indeed, previous work has demonstrated changes in these organoid structures by MSC-
mediated decrease of E-cadherin in breast cancer spheroids [15,16]. This is also substantiated by high
uPA levels in MDA-MB-231 cells (Figure 3), whereby uPA represents one of the serine proteinases
that contribute to matrix digestion and thus cellular motility. Previous work suggested that elevated
uPA levels in association with the plasminogen activation system correlates with tumor malignancy.
Consequently, partial tumor tissue degradation by the urokinase system, followed by the liberation
of cancer cells, facilitates tissue invasion and contributes to metastasis, which therefore may represent
a potential drug target using anticancer agents [17]. Indeed, the reduction of Migfilin, β-catenin, and
uPA via the depletion of the regulatory vasodilator-stimulated phosphoprotein inhibited tumor
spheroid invasion of MDA-MB-231 cells [18]. More specifically, the down-modulation of uPA by
targeting the uPA 3’ untranslated region with microRNA-645 reduced the invasive growth of MDA-
MB-231 cells [19].
      In contrast to the high uPA levels of 12.51 ng/mg protein in MDA-MB-231 cells, five different
primary MSC populations exhibited uPA levels, with the highest amount reaching 1.6 ng/mg protein
in MSA100314 P4 (Figure 3). Thus, the neoplastic tissue-derived MSC544 P32 displayed 0.68 ng
uPA/mg protein, which is in line with the uPA values that were obtained for the other primary MSC
populations. Together with the non-tumorigenic state of normal MSC, these findings suggested that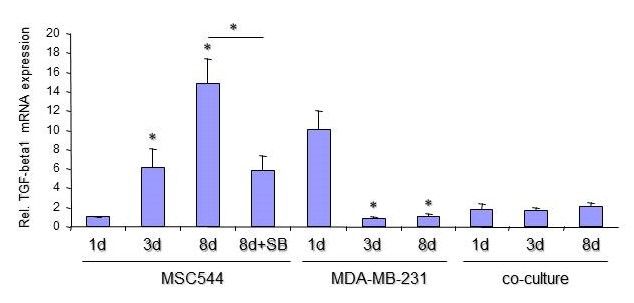
Int. J. Mol. Sci. 2017, 18, x FOR PEER REVIEW 5 of 12
the constitutively low uPA levels in primary MSC and MSC544 do not significantly contribute to the
invasive
Int. J. Mol. properties
Sci. 2019, 20, 2630 of these cell populations. 5 of 12
3. Quantification
Figure Figure of urokinase
3. Quantification of urokinaseplasminogen activator
plasminogen activator (uPA)
(uPA) in different
in different MSC cultures
MSC cultures and and
MDA-MB-231 breast cancer cells. Intracellular amounts of uPA were quantified in five
MDA-MB-231 breast cancer cells. Intracellular amounts of uPA were quantified in five different primary different
primary at
MSC cultures MSC cultures passages
different at different and
passages and compared
compared with MSC544
with MSC544 P32.Moreover,
P32. Moreover, the
thelevels of of uPA
levels
uPA in MSC544 were compared to MDA-MB-231 breast cancer cells and to a 3D spheroid formed
in MSC544 were compared to MDA-MB-231 breast cancer cells and to a 3D spheroid formed after
after long-term co-culture (62 days) between MSC544GFP and MDA-MB-231cherry. Data represent the
long-term co-culture (62 days) between MSC544GFP and MDA-MB-231cherry . Data represent the mean
mean + s.d. (n = 4).
± s.d. (n = 4).
Of interest, the co-cultures of MSC544GFP, together with MDA-MB-231cherry, maintained high uPA
In levels
contrast tong/mg
of 8.34 the high uPA
protein levels
in the of 12.51 indicating
3D spheroids, ng/mg protein in MDA-MB-231
the presence cells,infive
of invasive potential thesedifferent
primary MSC populations exhibited uPA levels, with the highest amount reaching 1.6 ng/mg
organoids (Figure 3). This is substantiated by previous findings that co-cultures of human MSC with protein
breast cancer cells, including MDA-MB-231, closely interact with each
in MSA100314 P4 (Figure 3). Thus, the neoplastic tissue-derived MSC544 P32 displayed 0.68 ng other and they are associated
uPA/mgwith increased proliferative capacity in vitro when compared to the corresponding mono-cultures
protein, which is in line with the uPA values that were obtained for the other primary MSC
[20,21]. Moreover, these co-cultures also contribute to enhanced in vivo tumor growth that I
populations. Together with the non-tumorigenic state of normal MSC, these findings suggested that
associated with elevated formation of metastases and a potential generation of breast cancer stem
the constitutively
cells, which maylowalso
uPA levelsTGF-β,
involve in primary
Rac1, andMSC and
Rac1b MSC544
signaling do not
[22–25]. significantly
Further contribute
studies revealed that to the
invasivecytokines,
properties of these cell populations.
including MSC-released CC-motif chemokine ligand 5 (CCL5 = RANTES), promote tumor
Ofgrowth
interest,andthe metastases
co-cultures formation
of MSC544 GFP , together
upon cross-talk with breast cancer cells [26].cherry
with MDA-MB-231 With, maintained
respect to high
RANTES, quantitative real-time RT-PCR (qPCR)
uPA levels of 8.34 ng/mg protein in the 3D spheroids, indicating analyses revealed thethe
downregulation
presence ofofinvasive
the mRNA potential
in MDA-MB-231 cultures after eight days versus day 1 (71%), and a strong upregulation in MSC544
in these organoids (Figure 3). This is substantiated by previous findings that co-cultures of human
cultures (97.8-fold), whereas only small changes were detected in the co-cultures (Figure S1, upper
MSC with breast
panel). cancer the
Interestingly, cells, including
reverse was trueMDA-MB-231,
for epidermal growth closely
factorinteract with upregulation
(EGF) mRNA, each other in and they
are associated with increased proliferative capacity in vitro when compared
MDA-MB-231 (19-fold) and downregulation in MSC544 cultures to undetectable levels after eight to the corresponding
mono-cultures [20,21].
days of culture. In Moreover,
the co-cultures, these
the co-cultures
EGF transcriptsalso contribute
were to enhanced
two-fold higher on day 8inasvivo tumor
compared to growth
day 1 (Figure
that I associated S1, lower
with elevatedpanel).formation of metastases and a potential generation of breast cancer
A moremay
stem cells, which reciprocal expression
also involve pattern
TGF-β, whenand
Rac1, compared
Rac1b to uPA amounts
signaling in MSC
[22–25]. and MDA-MB-
Further studies revealed
231 cells is displayed by the corresponding inhibitor PAI-1. The five primary human MSC cultures
that cytokines, including MSC-released CC-motif chemokine ligand 5 (CCL5 = RANTES), promote
revealed high constitutive PAI-1 values between 212.5 ng/mg protein for MSC100314 P4 and 372.7
tumor growth and metastases
ng/mg protein for MSC280416 formation upon
P5. Within thecross-talk
range of thesewithMSCbreast cancer
values, thecells [26]. cultured
long-term With respect to
RANTES, quantitative
neoplastic real-time
tissue-derived RT-PCR
MSC544 at P32(qPCR) analyses
displayed revealed
249.5 ng/mg PAI-1the downregulation
protein (Figure 4). of the mRNA
in MDA-MB-231 cultures after eight days versus day 1 (71%), and a strong upregulation in MSC544
cultures (97.8-fold), whereas only small changes were detected in the co-cultures (Figure S1, upper
panel). Interestingly, the reverse was true for epidermal growth factor (EGF) mRNA, upregulation in
MDA-MB-231 (19-fold) and downregulation in MSC544 cultures to undetectable levels after eight days
of culture. In the co-cultures, the EGF transcripts were two-fold higher on day 8 as compared to day 1
(Figure S1, lower panel).
A more reciprocal expression pattern when compared to uPA amounts in MSC and MDA-MB-231
cells is displayed by the corresponding inhibitor PAI-1. The five primary human MSC cultures revealed
high constitutive PAI-1 values between 212.5 ng/mg protein for MSC100314 P4 and 372.7 ng/mg
protein for MSC280416 P5. Within the range of these MSC values, the long-term cultured neoplastic
tissue-derived MSC544 at P32 displayed 249.5 ng/mg PAI-1 protein (Figure 4).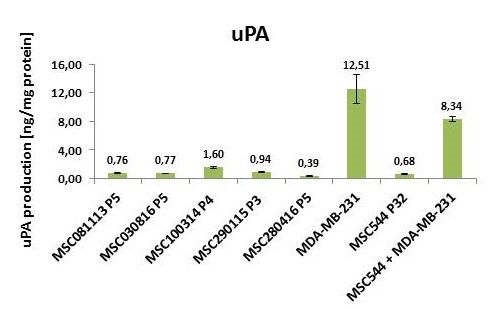
Int. J. Mol.
          Int.Sci.     Sci.20,
                   2019,
               J. Mol.         2630
                           2017, 18, x FOR PEER REVIEW                                                                6 of 12   6 of 12

              4. Quantification
      Figure Figure                  of PAI-1 in different MSC cultures and MDA-MB-231 breast cancer cells.
                     4. Quantification of PAI-1 in different MSC cultures and MDA-MB-231 breast cancer cells. The
      The intracellular   levels  of  PAI-1 were
             intracellular levels of PAI-1   werequantified
                                                     quantified  in in
                                                                    fivefive  different
                                                                          different       primary
                                                                                     primary         MSC cultures
                                                                                              MSC cultures            at different
                                                                                                             at different
      passages  and compared
             passages              with
                        and compared     MSC544
                                       with MSC544P32.P32. Moreover,
                                                            Moreover, the the  amount
                                                                             amount       of PAI-1
                                                                                      of PAI-1       in MSC544
                                                                                               in MSC544         was compared
                                                                                                          was compared
             to MDA-MB-231
      to MDA-MB-231            breast
                          breast       cancer
                                  cancer      cells
                                           cells andand
                                                      totoa a3D3Dspheroid
                                                                   spheroid that
                                                                              thatformed
                                                                                    formed after long-term
                                                                                             after         co-culture
                                                                                                    long-term         (62 (62 d)
                                                                                                               co-culture
             d) MSC544
                between MSC544                                         represent the mean ± s.d. (n = 4).
                                  GFP and MDA-MB-231
                                     MDA-MB-231cherry . .Data
                          GFP and                         cherry Data represent the mean + s.d. (n = 4).
      between

              In contrast, PAI-1 expression in MDA-MB-231 cells was much lower, reaching only 109.5 ng/mg
      In contrast,    PAI-1 expression in MDA-MB-231 cells was much lower, reaching only 109.5 ng/mg
        protein (Figure 4). Previous work in the non-metastatic MCF-7 breast cancer cell line demonstrated
proteinlow
         (Figure   4).  Previous work in the non-metastatic MCF-7 breast cancer cell line demonstrated low
             PAI-1 and uPA levels at the detection limit [27]. According to the function of PAI-1 as an inhibitor
PAI-1 and    uPAlow
        for uPA,    levels
                        PAI-1at amounts
                                the detection     limit cancer
                                          in the breast [27]. According      to expected
                                                                cells would be   the function    ofpartially
                                                                                           to only  PAI-1 as     an inhibitor
                                                                                                              block   high     for
uPA, lowuPA PAI-1    amounts
               activities.  As a in the breast cancer
                                  consequence,            cells would
                                                   uPA remains            be expected
                                                                  more active             to only partially
                                                                                 in MDA-MB-231       cells, e.g.,block
                                                                                                                  for thehigh uPA
        degradation
activities.             of extracellular
            As a consequence,        uPAmatrix
                                           remainsand more
                                                      liberation  of cancer
                                                             active         cells. These effects
                                                                      in MDA-MB-231        cells,are even
                                                                                                  e.g., forenhanced     in
                                                                                                            the degradation     of
        co-cultures   of the breast cancer  cells, with MSC544    reaching  PAI-1  values of 88 ng/mg   protein
extracellular matrix and liberation of cancer cells. These effects are even enhanced in co-cultures of the        (Figure
        4). Together, these findings suggest synergistic interactions during co-cultures of the breast cancer
breast cancer cells, with MSC544 reaching PAI-1 values of 88 ng/mg protein (Figure 4). Together, these
        cells with MSC544 and the formation of the 3D tumor spheroids, whereby PAI-1 expression was
findingsmuch
          suggest
                lowersynergistic
                       when comparedinteractions     during
                                          to that detected in co-cultures    of theMDA-MB-231
                                                              the corresponding      breast cancer andcells  withmono-
                                                                                                        MSC544       MSC544 and
the formation
        cultures.of   the 3D tumor
                   Therefore,    mutualspheroids,
                                         interactionswhereby
                                                       between thePAI-1   expression
                                                                      cancer            was eventually
                                                                             cells and MSC    much lower       when
                                                                                                           impair       compared
                                                                                                                    tissue
to that homeostasis
         detected inand  thepotentially
                              corresponding
                                          promoteMDA-MB-231           and MSC544
                                                    neoplastic development            mono-cultures.
                                                                               and progression   [28].      Therefore, mutual
interactions between the cancer cells and MSC eventually impair tissue homeostasis and potentially
promote neoplastic development and progression [28].
      Both, uPA and PAI-1 are the target genes of TGF-β1 and important mediators of TGF-β bioactivation
and proinvasive/prometastatic function [29]. Therefore, it was of interest to determine its presence
and possible function in MSC and MDA-MB-231 cultures. The release of bioactive TGF-β1 was
quantified in supernatants from MSC544 and MDA-MB-231 mono-cultures, respectively, and in a
corresponding co-culture between the MSC544 and MDA-MB-231 cells. While TGF-β1 release from
10,000 MDA-MB-231 cells/24-well remained below detection limit of the ELISA, a similar cell number
of 10,000 MSC544/24 well produced 5.9 ± 2.2 pg/mL TGF-β1 (n = 3) in the supernatant after 24 h
and 22.4 ± 0.5 pg/mL (n = 3) TGF-β1 after 72 h (Figure 5). The supernatants that were derived from
MSC544 mono-cultures as compared to those that were obtained after co-culture of MSC544 together
with MDA-MB-231 cells revealed progressively higher levels of TGF-β1 in the co-cultures (1.56-fold
after 24 h and 2.19-fold after 72 h) (Figure 5). We performed qPCR analyses of TGF-β1 in MSC544 and
MDA-MB-231 cells that were cultured for one, three, and eight days to reveal whether the increase in
secreted protein is due to enhanced mRNA synthesis. To this end, TGF-β1 mRNA levels in MSC544
cells strongly increased with time in culture (15.56-fold from day 1 to day 8). In contrast, the TGF-β1
mRNA abundance was decreased by ~90% in MDA-MB-231 cells on day 3 and day 8 when compared
to day 1 (Figure 6). However, little, if any, increase in TGF-β1 mRNA levels was detectable in the
co-cultures, which may be due to progressive overgrowing of the MSC544 cells by the (non-TGF-β1
expressing) MDA-MB-231 cells. Moreover, the different turnover kinetics of secreted TGF-β1 protein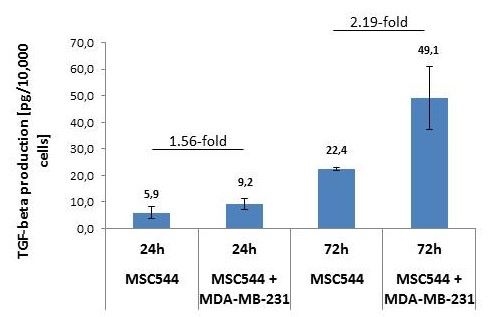
Int. J. Mol. Sci. 2019, 20, 2630 7 of 12
(which accumulates in the supernatant) and mRNA (which is maintained in a steady-state by rapid
synthesis/degradation) contribute to this effect. Finally, the strong increase in TGF-β expression and
secretion in MSC544 mono-cultures and TGF-β1 secretion in the co-cultures prompted us to analyze
whether auto-regulation may operate in these cultures, since TGF-β1 has been shown to be capable
of auto-inducing its own synthesis [30]. As TGF-β1 binding and the activation of the TGF-β type I
receptor is a prerequisite for this to occur, we inhibited its kinase activity with the small molecule
SB431542 [31] in MSC544 cells mono-cultured for eight d. Intriguingly, the TGF-β1 mRNA levels were
Int. J. Mol. Sci. 2017, 18, x FOR PEER REVIEW 7 of 12
suppressed by 59.5% relative to vehicle-treated control (Figure 6).
Figure
Figure 5. 5.Quantification
Quantificationofofsecreted
secreted bioactive
bioactive cytokine transforminggrowth
cytokine transforming growthfactor-β1
factor-β1 (TGF-β1)
(TGF-β1) in in
MSC544
MSC544 mono-cultures
mono-cultures and
andco-cultures
co-culturesofofMSC544
MSC544with
withMDA-MB-231
MDA-MB-231cells.
cells. Release
Release of active TGF-β1
TGF-
from
β1 human
from humanMSC544 cells (10,000
MSC544 cells/24-well)
cells (10,000 was quantified
cells/24-well) by TGF-β1-specific
was quantified ELISA and
by TGF-β1-specific compared
ELISA and
to TGF-β1
compared
Int. J. Mol. Sci. 2017,production
to TGF-β1
18, of co-cultures
REVIEW ofbetween
production
x FOR PEER MSC544
co-cultures betweenandMSC544
MDA-MB-231 cells (5000 +cells
and MDA-MB-231 5000(5000
cells/24-well)
+ 5000
8 of 12
cells/24-well)
after 24 and 72 h, after 24 and 72 Data
respectively. h, respectively. Data
represent the represent
mean ± s.d. the meanindependent
of three + s.d. of three independent
experiments.
experiments.
Both, uPA and PAI-1 are the target genes of TGF-β1 and important mediators of TGF-β
bioactivation and proinvasive/prometastatic function [29]. Therefore, it was of interest to determine
its presence and possible function in MSC and MDA-MB-231 cultures. The release of bioactive TGF-
β1 was quantified in supernatants from MSC544 and MDA-MB-231 mono-cultures, respectively, and
in a corresponding co-culture between the MSC544 and MDA-MB-231 cells. While TGF-β1 release
from 10,000 MDA-MB-231 cells/24-well remained below detection limit of the ELISA, a similar cell
number of 10,000 MSC544/24 well produced 5.9 + 2.2 pg/mL TGF-β1 (n = 3) in the supernatant after
24 h and 22.4 + 0.5 pg/mL (n = 3) TGF-β1 after 72 h (Figure 5). The supernatants that were derived
from MSC544 mono-cultures as compared to those that were obtained after co-culture of MSC544
together with MDA-MB-231 cells revealed progressively higher levels of TGF-β1 in the co-cultures
(1.56-fold
Figure 6.after 24 h and 2.19-fold
Quantification after 72 h) (Figure
of TGF-β1-specific mRNA 5). We performed
in MSC544 qPCR analyses
and MDA-MB-231 of TGF-β1 in
mono-cultures,
Figure
MSC544 6. Quantification of TGF-β1-specific mRNA in MSC544 and MDA-MB-231 mono-cultures, and
and in and MDA-MB-231 cellsco-cultures.
MSC544/MDA-MB-231 that were cultured
Followingfor one, three,
culture for theand eight times
indicated days to reveal
and whether
stimulation
in
theforMSC544/MDA-MB-231
increase in secreted co-cultures.
protein is dueFollowing
to culture
enhanced for
mRNA the indicated
synthesis.times
To and
this stimulation
end, TGF-β1 formRNA
eight days (8 d) with 5 µM SB431542 (SB, only MSC544), the cells were lysed and subjected to
eight days
levels (8 d) with 5 strongly
µM SB431542 (SB, only MSC544),
time inthe cells were lysed andfrom
subjected
day 1totoRNA
RNAinisolation
MSC544 cellsquantitative
and increased
PCR (qPCR) with analyses culture
of TGF-β1.(15.56-fold
Data were normalized day
to 8). In
three
isolation and quantitative PCR (qPCR) analyses of TGF-β1. Data were normalized to three
contrast, TGF-β1 mRNA abundance was decreased by ∼90%
housekeeping genes (β-actin, GAPDH, and TBP) amplified from the same sample and are the mean and
the in MDA-MB-231 cells on day 3 +
housekeeping genes (β-actin, GAPDH, and TBP) amplified from the same sample and are the mean +
day 8 when
s.d. from a compared
representativeto day 1 (FigureThe
experiment. 6). asterisks
However, little, if
indicate any, increase
significance in TGF-β1
relative to the mRNA levels
respective 1 d
s.d. from a representative experiment. The asterisks indicate significance relative to the respective 1 d
was detectable
culture in the
(pInt. J. Mol. Sci. 2019, 20, 2630 8 of 12
These findings suggest that (i) MSC, rather than the breast cancer cells, are responsible for TGF-β1
synthesis, (ii) the upregulation of TGF-β1 expression during mono- and co-culture of MCS544 cells
may involve a positive autocrine feedback loop, and (iii) the effects on TGF-β1 secretion are synergistic
between both populations in the co-cultures.
The potential synergistic effects were also detectable following a time course of uPA and PAI-1
production. Thus, PAI-1 protein levels continuously decreased between day 1 and day 8 in MDA-MB-231
mono-cultures and similar effects were monitored in the co-cultures, while little, if any, changes occurred
in MSC544 mono-cultures between day 1 and day 8 (Figure S2, lower panel). Moreover, the amount of
uPA protein in MDA-MB-231 and MSC544 mono-cultures remained nearly unchanged, but continuously
increased in the co-cultures between day 1 and day 8 (Figure S2, upper panel), which suggested
alterations due to mutual interactions between MSC544 and the breast cancer cells until reaching the
levels that were observed during long-term co-culture and 3D tumor spheroid formation.
3. Conclusions
The present data demonstrate that long-term co-culture of human MSC with the breast cancer cell
line MDA-MB-231 alters uPA, PAI-1, and TGF-β1 expression, which are three factors that favor cancer
cell dissemination and the increased formation of metastasis. For these studies, MSC544 represent a
suitable cellular model because of prominent MSC marker expression, even after long-term culture,
exhibition of appropriate MSC-like morphology, and expression of uPA and PAI-1 at similar levels as
in primary human MSC cultures. Accordingly, the co-culture results suggest an interactive role for
uPA, PAI-1, and TGF-β1 in promoting cancer cell growth.
4. Materials and Methods
4.1. Cell Culture
Primary human mesenchymal stroma/stem-like cells (MSC) were isolated from umbilical cord
tissue explant cultures, as described previously [32]. Briefly, MSC were cultured in MSC growth
medium (αMEM (Sigma Chemie GmbH, Steinheim, Germany) that was supplemented with 10%
allogeneic human AB-serum, 100 U/mL penicillin, 100 µg/mL streptomycin, and 2 mM l-glutamine
(Sigma Chemie GmbH)) and subculture in passages (P) was performed following treatment with
accutase (Capricorn Scientific GmbH, Ebsdorfergrund, Germany) at 37 ◦ C for 3 min. The Ethics
Committee of Hannover Medical School, Project #443 on February 26th, 2009 approved the use of
human MSC and informed written consent was obtained from each patient. For the experiments,
the MSC cultures were used from six different donors: MSC081113 P5, MSC030816 P5, MSC100314 P4,
MSC290115 P3, MSC280416 P5, and MSC544 P32
Human MDA-MB-231 breast carcinoma cells were commercially obtained from American Type
Culture Collection. The triple negative breast cancer cell line MDA-MB-231 was grown in Leibovitz’s
L-15-medium (Life Technologies, Darmstadt, Germany), supplemented with 10 % FCS, 100 U/mL
penicillin, 100 µg/mL streptomycin, and 2 mM L-glutamine (Sigma Chemie GmbH).
All of the cells were tested for mycoplasma by the luminometric MycoAlert Plus mycoplasma
detection kit (Lonza Inc., Rockland, ME, USA), according to the manufacturer’s recommendations.
Previous work confirmed the authentication of the breast carcinoma cell line by short tandem repeat
(STR) fragment analysis using the GenomeLab human STR primer set (Beckman Coulter Inc., Fullerton,
CA, USA).
The stable transduction of MSC544 and MDA-MB-231 cells for discrimination in co-culture
was performed with a third generation lentiviral SIN vector carrying either the mCherry gene
(MDA-MB-231cherry ) or the enhanced green fluorescent protein (eGFP) gene (MSCGFP ). Co-cultures of
MSC544GFP and MDA-MB-231cherry were cultivated in MSC growth medium at a cell ratio of 1:1.Int. J. Mol. Sci. 2019, 20, 2630 9 of 12
4.2. Flow Cytometry Analysis
The samples were first blocked with 2% FCS in PBS for 15 min. at room temperature for flow
cytometric analysis. Following a PBS washing step, the cells were stained with a PE-labeled monoclonal
mouse anti-human CD73 antibody (clone AD2) (BD Bioscience GmbH), a PE-labeled monoclonal CD90
antibody (clone 5E10) (BioLegend via Biozol GmbH, Eching, Germany), or a PE-labeled monoclonal
mouse anti-human CD105 antibody (clone 43A3) (BioLegend via Biozol GmbH) at 4 ◦ C for 15 min.
A PE-labeled IgG1 antibody for CD73 or a double-labeled PE/FITC IgG1 antibody (both from Dako
Denmark AS, Glostrup, Denmark) served as an appropriate control. Thereafter, the cells were washed
again with PBS and subsequently analyzed by flow cytometry using FACScalibur (BD Biosciences
GmbH, Heidelberg, Germany) and then analyzed by FlowJo V10 software.
4.3. Quantification of Human Urokinase Plasminogen Activator (uPA) and Human Plasminogen Activator
Inhibitor-1 (PAI-1) by ELISA
A quantitative determination of uPA and PAI-1 in the protein homogenates of MDA-MB-231
breast cancer cells, the different MSC cell populations, and a homogenate of 3D spheroids
from a MSC544GFP /MDA-MB-231cherry co-culture was performed by appropriate enzyme-linked
immunosorbent assays (ELISA), as described previously [27]. Briefly, the cell cultures and the 3D
spheroid co-culture were frozen in liquid nitrogen and pulverized in the frozen state while using a
Sartorius microdismembrator S (Fisher Scientific GmbH, Schwerte, Germany). The resulting powder
was suspended in extraction buffer (American Diagnostica GmbH, Pfungstadt, Germany) and the
determination of protein content was performed by the colorimetric BCA-assay (Perbio Science
Deutschland, Bonn, Germany). Appropriate protein aliquots were applied to the uPA and PAI-1
ELISA, respectively, by following a protocol according to the manufacturer’s instructions (American
Diagnostica GmbH). The detection limit is 25 pg/mL for the uPA ELISA and 125 pg/mL for the
PAI-1 ELISA.
4.4. TGF-β1 ELISA
MSC544 P17 were plated in 24-well-plates at 10,000 cells/well in 1 mL/well of MSC growth medium.
A co-culture of 5,000 MSC544 P17, together with 5,000 MDA-MB-231 cells in 24-well with 1 mL of
MSC growth medium, was cultured in parallel. Following cell attachment, the cultures were washed
twice with serum-free αMEM, and thereafter incubated in αMEM supplemented with 0.1% allogeneic
human AB-serum for 24 and 72 h. At these times, ELISA removed the aliquots of the cell culture
supernatants for the quantification of bioactive TGF-β1. Plain αMEM that was supplemented with 0.1%
allogeneic human AB-serum and incubated for 24 and 72 h in a 37 ◦ C humidified atmosphere served as
medium control. Following appropriate dilution, the supernatants were subjected to TGF-β1-specific
ELISA (Human/Mouse TGF β1 ELISA Ready-SET-Go!, eBioscience/Affymetrix Inc. San Diego, CA,
USA), according to the manufacturer’s instructions and Ref. [33]. The detection limit of this ELISA is
25 pg/mL.
4.5. qPCR Analysis
Total RNA was purified from MDA-MB-231 and MSC544 cells, and the co-cultures using
the RNeasy Mini Kit (Qiagen, Hilden, Germany), according to manufacturer’s recommendations.
One µg RNA of each sample was subjected to reverse transcription for 1 h at 37◦ C with
M-MLV Reverse Transcriptase (200 U, Life Technologies) and random hexamers (2.5 µM, Life
Technologies) in a total volume of 20 µL. The relative mRNA concentrations of the target genes
were quantified by qPCR on an I-Cycler (BioRad, Hercules, CA, USA) with Maxima SYBR Green
Mastermix (Thermo Fisher Scientific, Waltham, MA, USA). For each sample, the Ct values for
the target genes were normalized to those for TATA box-binding protein (TBP). The following
sense (s) and antisense (as) PCR primers were used (5’–3’): EGF-s: tggatgtgcttgataagcgg, EGF-as:Int. J. Mol. Sci. 2019, 20, 2630 10 of 12
accatgtcctttccagtgtgt; CCL5/RANTES-s: ccagcagtcgtctttgtcac, CCL5/RANTES-as: ctctgggttggcacacactt;
TGF-β1-s: cccagcatctgcaaagctc, TGF-β1-as: gtcaatgtacagctgccgca; β-actin-s: gacgaggcccagagcaagag,
β-actin-as: atctccttctgcatcctgtc; GAPDH-s: ttgccatcaatgaccccttca, GAPDH-as: cgccccacttgattttgga; and,
TBP-s: gctggcccatagtgatcttt, TBP-as: cttcacacgccaagaaacag.
Supplementary Materials: The following are available online at http://www.mdpi.com/1422-0067/20/11/2630/s1.
Author Contributions: Conceptualization, R.H.; methodology, R.H.; investigation, C.M., J.v.d.O., H.O., H.U.;
resources, R.H.; writing—original draft preparation, R.H.; manuscript editing, H.U.; visualization, C.M., J.v.d.O.,
H.U., R.H.; supervision, H.U., R.H.; project administration, R.H.; funding acquisition, R.H.
Funding: This research was funded by a grant from the Erich and Gertrud Roggenbuck-Stiftung for Cancer
Research to Ralf Hass.
Acknowledgments: The authors are grateful to Jutta Beu from Hannover Medical School and Heike Albrecht
from First Department of Medicine, University Hospital Schleswig-Holstein, for technical assistance with the uPA
and PAI-1 ELISA analyses and the TGF-β1 ELISA analysis, respectively.
Conflicts of Interest: The authors declare no conflict of interest.
Abbreviations
eGFP enhanced green fluorescent protein
EGF epidermal growth factor
CCL5 C-C motif chemokine ligand 5
FACS fluorescence-activated cell sorting
FCS fetal calf serum
MSC mesenchymal stroma/stem-like cells
P passage
PAI-1 plasminogen activator inhibitor-1
TGF-β transforming growth factor-β
uPA urokinase plasminogen activator
References
1. Brabek, J.; Mierke, C.T.; Rosel, D.; Vesely, P.; Fabry, B. The role of the tissue microenvironment in the regulation
of cancer cell motility and invasion. Cell Commun. Signal 2010, 8, 22. [CrossRef]
2. Leung, C.T.; Brugge, J.S. Tumor self-seeding: Bidirectional flow of tumor cells. Cell 2009, 139, 1226–1228.
[CrossRef]
3. Dittmer, J. Mesenchymal stem cells: “repair cells” that serve wounds and cancer? Sci. World J. 2010, 10,
1234–1238. [CrossRef]
4. Hass, R.; Otte, A. Mesenchymal stem cells as all-round supporters in a normal and neoplastic
microenvironment. Cell Commun. Signal 2012, 10, 26. [CrossRef]
5. Tang, L.; Han, X. The urokinase plasminogen activator system in breast cancer invasion and metastasis.
Biomed. Pharmacother. 2013, 67, 179–182. [CrossRef]
6. Carter, J.C.; Church, F.C. Obesity and breast cancer: The roles of peroxisome proliferator-activated
receptor-gamma and plasminogen activator inhibitor-1. PPAR Res. 2009, 2009, 345320. [CrossRef] [PubMed]
7. Lampelj, M.; Arko, D.; Cas-Sikosek, N.; Kavalar, R.; Ravnik, M.; Jezersek-Novakovic, B.; Dobnik, S.;
Dovnik, N.F.; Takac, I. Urokinase plasminogen activator (uPA) and plasminogen activator inhibitor type-1
(PAI-1) in breast cancer - correlation with traditional prognostic factors. Radiol. Oncol. 2015, 49, 357–364.
[CrossRef] [PubMed]
8. Ikushima, H.; Miyazono, K. TGFbeta signalling: A complex web in cancer progression. Nat. Rev. Cancer
2010, 10, 415–424. [CrossRef]
9. Yu, Q.; Stamenkovic, I. Cell surface-localized matrix metalloproteinase-9 proteolytically activates TGF-beta
and promotes tumor invasion and angiogenesis. Genes Dev. 2000, 14, 1631–1676.
10. Yang, Y.; Otte, A.; Hass, R. Human mesenchymal stroma/stem cells exchange membrane proteins and
alter functionality during interaction with different tumor cell lines. Stem Cells Dev. 2015, 24, 12051–12222.
[CrossRef] [PubMed]Int. J. Mol. Sci. 2019, 20, 2630 11 of 12
11. Kulterer, B.; Friedl, G.; Jandrositz, A.; Sanchez-Cabo, F.; Prokesch, A.; Paar, C.; Scheideler, M.; Windhager, R.;
Preisegger, K.H.; Trajanoski, Z. Gene expression profiling of human mesenchymal stem cells derived from
bone marrow during expansion and osteoblast differentiation. BMC Genom. 2007, 8, 70. [CrossRef]
12. Otte, A.; Bucan, V.; Reimers, K.; Hass, R. Mesenchymal stem cells maintain long-term in vitro stemness
during explant culture. Tissue Eng. Part C Methods 2013, 19, 9379–9448. [CrossRef]
13. Yang, Y.; Melzer, C.; Bucan, V.; von der Ohe, J.; Otte, A.; Hass, R. Conditioned umbilical cord tissue provides
a natural three-dimensional storage compartment as in vitro stem cell niche for human mesenchymal
stroma/stem cells. Stem Cell Res. Ther. 2016, 7, 28. [CrossRef] [PubMed]
14. Melzer, C.; von der Ohe, J.; Hass, R. In vivo cell fusion between mesenchymal stroma/stem-like cells and
breast cancer cells. Cancers 2019, 11, 185. [CrossRef] [PubMed]
15. Dittmer, A.; Hohlfeld, K.; Lutzkendorf, J.; Muller, L.P.; Dittmer, J. Human mesenchymal stem cells induce
E-cadherin degradation in breast carcinoma spheroids by activating ADAM10. Cell. Mol. Life Sci. 2009, 66,
3053–3065. [CrossRef]
16. Klopp, A.H.; Lacerda, L.; Gupta, A.; Debeb, B.G.; Solley, T.; Li, L.; Spaeth, E.; Xu, W.; Zhang, X.; Lewis, M.T.;
et al. Mesenchymal stem cells promote mammosphere formation and decrease E-cadherin in normal and
malignant breast cells. PLoS ONE 2010, 5, e12180. [CrossRef] [PubMed]
17. Jankun, J.; Skrzypczak-Jankun, E. Molecular basis of specific inhibition of urokinase plasminogen activator
by amiloride. Cancer Biochem. Biophys. 1999, 17, 109–123.
18. Gkretsi, V.; Stylianou, A.; Stylianopoulos, T. Vasodilator-Stimulated Phosphoprotein (VASP) depletion from
breast cancer MDA-MB-231 cells inhibits tumor spheroid invasion through downregulation of Migfilin,
beta-catenin and urokinase-plasminogen activator (uPA). Exp. Cell. Res. 2017, 352, 2812–2892. [CrossRef]
19. Meng, D.; Lei, M.; Han, Y.; Zhao, D.; Zhang, X.; Yang, Y.; Liu, R. MicroRNA-645 targets urokinase
plasminogen activator and decreases the invasive growth of MDA-MB-231 triple-negative breast cancer cells.
OncoTargets Ther. 2018, 11, 7733–7743. [CrossRef]
20. Melzer, C.; Yang, Y.; Hass, R. Interaction of MSC with tumor cells. Cell. Commun. Signal. 2016, 14, 20.
[CrossRef]
21. Melzer, C.; von der Ohe, J.; Hass, R. In Vitro Fusion of Normal and Neoplastic Breast Epithelial Cells with
Human Mesenchymal Stroma/Stem Cells Partially Involves Tumor Necrosis Factor Receptor Signaling.
Stem Cells 2018, 36, 12. [CrossRef] [PubMed]
22. Berndt, B.; Zanker, K.S.; Dittmar, T. Cell fusion is a potent inducer of aneuploidy and drug resistance in
tumor cell/ normal cell hybrids. Crit. Rev. Oncog. 2013, 18, 97–113. [CrossRef]
23. Li, H.J.; Reinhardt, F.; Herschman, H.R.; Weinberg, R.A. Cancer-stimulated mesenchymal stem cells create a
carcinoma stem cell niche via prostaglandin E2 signaling. Cancer Discov. 2012, 2, 8408–8455. [CrossRef]
24. Melzer, C.; von der Ohe, J.; Lehnert, H.; Ungefroren, H.; Hass, R. Cancer stem cell niche models and
contribution by mesenchymal stroma/stem cells. Mol. Cancer 2017, 16, 28. [CrossRef] [PubMed]
25. Melzer, C.; Hass, R.; Lehnert, H.; Ungefroren, H. RAC1B: A Rho GTPase with Versatile Functions in Malignant
Transformation and Tumor Progression. Cells 2019, 8, 21. [CrossRef]
26. Karnoub, A.E.; Dash, A.B.; Vo, A.P.; Sullivan, A.; Brooks, M.W.; Bell, G.W.; Richardson, A.L.; Polyak, K.;
Tubo, R.; Weinberg, R.A. Mesenchymal stem cells within tumour stroma promote breast cancer metastasis.
Nature 2007, 449, 557–563. [CrossRef] [PubMed]
27. Mandel, K.; Seidl, D.; Rades, D.; Lehnert, H.; Gieseler, F.; Hass, R.; Ungefroren, H. Characterization of
spontaneous and TGF-beta-induced cell motility of primary human normal and neoplastic mammary cells
in vitro using novel real-time technology. PLoS ONE 2013, 8, e56591. [CrossRef]
28. Ungefroren, H.; Sebens, S.; Seidl, D.; Lehnert, H.; Hass, R. Interaction of tumor cells with the microenvironment.
Cell. Commun. Signal. 2011, 9, 18. [CrossRef] [PubMed]
29. Santibanez, J.F.; Obradovic, H.; Kukolj, T.; Krstic, J. Transforming growth factor-beta, matrix
metalloproteinases, and urokinase-type plasminogen activator interaction in the cancer epithelial to
mesenchymal transition. Dev. Dyn. 2018, 247, 3823–3895. [CrossRef] [PubMed]
30. Zhang, Q.; Yu, N.; Lee, C. Vicious cycle of TGF-beta signaling in tumor progression and metastasis. Am. J.
Clin. Exp. Urol. 2014, 2, 149–155.
31. Inman, G.J.; Nicolas, F.J.; Callahan, J.F.; Harling, J.D.; Gaster, L.M.; Reith, A.D.; Laping, N.J.; Hill, C.S.
SB-431542 is a potent and specific inhibitor of transforming growth factor-beta superfamily type I activin
receptor-like kinase (ALK) receptors ALK4, ALK5, and ALK7. Mol. Pharmacol. 2002, 62, 657–664. [CrossRef]Int. J. Mol. Sci. 2019, 20, 2630 12 of 12
32. Mandel, K.; Yang, Y.; Schambach, A.; Glage, S.; Otte, A.; Hass, R. Mesenchymal stem cells directly interact
with breast cancer cells and promote tumor cell growth in vitro and in vivo. Stem Cells Dev. 2013, 22,
3114–3127. [CrossRef] [PubMed]
33. Witte, D.; Otterbein, H.; Forster, M.; Giehl, K.; Zeiser, R.; Lehnert, H.; Ungefroren, H. Negative regulation of
TGF-beta1-induced MKK6-p38 and MEK-ERK signalling and epithelial-mesenchymal transition by Rac1b.
Sci. Rep. 2017, 7, 17313. [CrossRef] [PubMed]
© 2019 by the authors. Licensee MDPI, Basel, Switzerland. This article is an open access
article distributed under the terms and conditions of the Creative Commons Attribution
(CC BY) license (http://creativecommons.org/licenses/by/4.0/).You can also read