The Effect of Various Tillage Systems on Productivity of Narrow-Leaved Lupin-Winter Wheat-Winter Triticale-Winter Barley Rotation - MDPI
←
→
Page content transcription
If your browser does not render page correctly, please read the page content below
agronomy
Article
The Effect of Various Tillage Systems on Productivity
of Narrow-Leaved Lupin-Winter Wheat-Winter
Triticale-Winter Barley Rotation
Katarzyna Panasiewicz * , Agnieszka Faligowska , Grażyna Szymańska , Jerzy Szukała,
Karolina Ratajczak and Hanna Sulewska
 Department of Agronomy, Faculty of Agronomy and Bioengineering, Poznań University of Life Sciences,
 Dojazd 11 str., 60-632 Poznań, Poland; agnieszka.faligowska@up.poznan.pl (A.F.);
 grazyna.szymanska@up.poznan.pl (G.S.); jerzy.szukala@up.poznan.pl (J.S.);
 karolina.ratajczak@up.poznan.pl (K.R.); hanna.sulewska@up.poznan.pl (H.S.)
 * Correspondence: katarzyna.panasiewicz@up.poznan.pl

 Received: 15 January 2020; Accepted: 17 February 2020; Published: 21 February 2020

 Abstract: Legumes are increasingly important crops in most European Union (EU) countries because
 of the growing demand for feed protein, and also because they have been shown to improve the
 characteristics of soil. The main part of the crop rotation is taken up by cereals, but they are connected
 with undesirable side effects, such as the unilateral utilization of ingredients and the heightened risk of
 plant diseases, e.g., Fusarium. Simplification of farming methods has become increasingly popular as
 growers search for cheaper production technologies. However, the effects of long-term simplification
 in tillage practices on the production and economics of narrow-leafed lupine (NL) cultivation have
 not been studied. In 2012–2016, we carried out a field experiment in Poland with a one-factorial
 design with four replications. The aim of the experiment was to evaluate the productivity effect of
 conventional tillage (CT), reduced tillage (RT) and no-tillage (NT) on NL-winter wheat (WW)-winter
 triticale (WT)-winter barley (WB), rotation. Our results show that the productivity of this crop rotation
 was lower under RT and NT systems than under CT. From a practical point of view, the reduction of
 cultivation in rotation with 75% of cereals caused a decrease in yield in all species, which can result
 in resign of using the RT and NT in conditions of Albic Luvisols soil, as classified according to the
 World Reference Base (WRB). The highest incomes were found when the CT system was used with
 NL. Although income losses exceeded the value of savings in both minimalized soil tillage systems
 (RT and NT), all tillage systems of NL were profitable.

 Keywords: cereals; economy effect; legumes; soil tillage

1. Introduction
      The post-war agricultural revolution led to the intensification of European agriculture.
This intensification encouraged highly specialized production systems with increasingly short
rotations [1]. This evolution was based on a choice of species that could ensure the best short-term
profitability [2]. Now, Europe is self-sufficient in most agricultural commodities that it can produce and
is even an exporter. This remarkable productivity can be attributed to specialization in high-yielding
cereals and oilseeds grown using synthetic nitrogen fertilizers, and a well-developed supporting
technology [3]. According to EUROSTAT [4] in 2017, the harvested production of cereals (including
rice) in the European Union (EU) was approximately 310 million tonnes. This represented an increase
of 2.7% (8.2 million tonnes) compared to 2016 values. France harvested 68.5 million tonnes of cereals in
2017, a little more than one fifth (22.0%) of total production in the EU. Germany harvested 45.6 million

Agronomy 2020, 10, 304; doi:10.3390/agronomy10020304                         www.mdpi.com/journal/agronomy
Agronomy 2020, 10, 304 2 of 11
tonnes (14.7% of the EU total) and Poland harvested 31.9 million tonnes (10.3%). The overall increase
in harvested production at EU level was driven by strong productivity increases in France (26.4%),
Poland (7.0%) but also Romania (24.7%). Moreover, the EU produced 35.1 million tonnes of oilseeds
in 2017, which was 3.8 million tonnes more than the level harvested in 2016; an increase of 12.0%.
In addition, the harvested production of rape and turnip rape seeds was 21.9 million tonnes (an increase
of 9.5%). Unfortunately, these models of agricultural production are connected with a number of
environmental problems (loss of biodiversity, environmental pollution, greenhouse gas emissions, etc.).
In current crop systems dominated by two or three major species, legumes can act as a diversification
crop, break pest cycles and diseases, develop populations of beneficial organisms for crop protection,
reduce artificial inputs in the rotation, improve the use efficiency of artificial inputs, and increase the
quality of landscape mosaics [1]. Now, many national governments in Europe have invested in projects
to support the production of legume crops in, although there is still a lack of compelling economic
grounds for growing legumes, especially in areas where cereals and oilseeds grow particularly well [3].
A promising alternative could be the reduction of costs in legume production. Conventional tillage can
be gradually replaced by new methods, which reduce the time spent in tillage operations. A reduction
in field time is a necessity because of short time of tillage period before sowing, and also due to need
cost-cutting especially on large-acreage farms. [5]. Long-term continuous cropping provides a valuable
background for the recognition of the multiplicity of crop rotation functions [6]. Therefore, the aim
of this experiment was to evaluate of the effects of various tillage systems on the productivity of a
narrow-leaved lupin (NL)-winter wheat (WW)-winter triticale (WT)-winter barley (WB) rotation.
2. Material and Methods
2.1. Site Description
The study was carried out in a long-term field experiment conducted at the Złotniki Research
Station in the Wielkopolska region, Poland (52◦ 290 N, 16◦ 490 E). The field experiment (4-crop rotation)
was located as a stationary experiment and was carried out at the same location each year. The soil
type classified according to WRB as Albic Luvisols on a grey-brown podsolic (pH = 4.8 measured in
1 M KCL; 1.3% organic matter: 50–110 mg P kg−1 soil, 115–195 mg K kg−1 soil).
It is generally accepted that climatic conditions throughout Poland are suitable for the cultivation
of most cereal and legume species, which require 500–600 mm annual precipitation. Weather conditions
during the growing season in the years of study (2012–2016) are presented using the hydrothermal
index according to Sielianinov (Table 1).
Table 1. Hydrothermal index Sielianinov Index (K) in the growing season (March to October) in
2012–2016 (recorded at the agrometeorological observatory in Złotniki, Poland).
Year/Month March April May June July August September October
2012 0.68 0.92 1.24 2.62 2.53 1.00 0.72 1.27
2013 3.50 0.72 1.81 2.04 0.76 0.76 2.01 0.51
2014 1.01 1.81 2.25 0.89 0.70 1.68 1.00 0.40
2015 0.36 1.34 1.10 0.57 0.91 2.74 0.54 1.08
2016 4.27 1.45 0.90 1.52 2.55 0.75 0.11 4.23
K: < 0.5–drought, 0.5–1.0–semi-drought, 1.0–1.5–border of optimal moisture, >1.5–excessive moisture.
The hydrothermal index is expressed as a quotient of the monthly sum of precipitation and the
sum of average daily air temperature in a given month for a period of time. Variability of weather
conditions in the years of the study was reflected in the values of the index. More favorable moisture
conditions for vegetation were observed in the years 2012–2014 and 2016, than in the drier 2015 (March:
K = 0.36, June: K = 0.57), which contributed to the lower WW and WT yields obtained throughout the
study period.Agronomy 2020, 10, 304 3 of 11
2.2. Experimental Design and Agronomic Management
The field experiment was established in crop rotations with 75% cereal composition. The four
plant species used were narrow-leaved lupin (Lupinus angustifolius L. cv. ‘Bojar’), winter wheat (Triticum
aestivum cv. ‘Bogatka’), winter triticale (Triticosecale Wittm. cv. ‘Witon’), winter barley (Hordeum vulgare
cv. ‘Maybrid’), as shown in Table 2.
Table 2. Crop rotation in 2012–2016.
Crop Rotation (Harvest Year)
2012 2013 2014 2015 2016
narrow-leaved lupin winter wheat winter triticale winter barley -
- narrow-leaved lupin winter wheat winter triticale winter barley
- - narrow-leaved lupin winter wheat winter triticale
- - - narrow-leaved lupin winter wheat
The study over a five-year period (2012–2016) was conducted as a one-factorial field experiment
with four replications. The factor was the adopted soil tillage system: conventional tillage (CT),
reduced tillage (RT) and no-tillage (NT). All tillage systems have been applied continuously since 1997
(Table 3).
Table 3. Tillage Systems.
Tillage System Cultivation Measures
Post-harvest cultivation: disk harrow (2.5 m wide) to a depth of 8 cm and fertilization.
CT Basic land preparation: ploughing to a depth of 30 cm with a 3-furrow reversible plough.
Pre-plant tillage: cultivator followed by harrowing to a depth of 8 cm and rolling).
Post-harvest cultivation: application of glyphosate herbicide (3 l ha−1 ), and fertilization.
RT Basic land preparation: stubble cultivator (2.5 m wide).
Pre-plant tillage: cultivator followed by harrowing to a depth of 8 cm and rolling.
Post-harvest cultivation: application of glyphosate herbicide (3 l ha−1 ) and fertilization.
NT Basic land preparation:
Pre-plant surface preparation: application of glyphosate herbicide (3 l ha−1 ) and sowing
directly into the stubble of the previous crop.
TS: tillage system; CT: conventional tillage; RT: reduced tillage; NT: no-tillage.
In each year, the pre-crop to NL was WW. During the growing season, recommended pesticides
were used for particular target species. Sowing and harvest dates depended on species and weather
conditions. The recommended sowing rates for seeds capable of germination were: 100 seeds m2 for
NL and 400 seeds m2 for the cereals. The sowing depth in all tillage systems was 4 cm and the row
space was 18 cm. In all the tillage systems plots were drilled with a double disk drill (Great Plains,
Solid Stand 100 equipped with a fluted coulter for residue cutting, a double disk for seed placement,
and a press wheel, 3 m wide, weight of the tractor 2885 kg).
2.3. Data Collection
Crops were harvested annually from a 11.40 m2 (7.6 × 1.5 m) plot a 1.5 m wide Wintersteiger
classic plot combine. The seed yield per hectare was calculated at a 15% moisture level. In addition, the
following parameters were assessed for NL: plant density per square meter before harvest (4 frames
with dimensions of 0.25 m2 ), mass of nodules per plant (measured on five randomly collected whole
lupin plants during flowering), number of pods per plant, number of seeds per plant, number of seeds
per pod (measured on 15 randomly collected whole lupin plants several days before harvest) and
1000 seeds-weight in grams (seeds collected from the harvested seed mass; 2 × 500 seeds were counted
and weighed).Agronomy 2020, 10, 304 4 of 11
Analysis of weed infestation was carried out two weeks before seed harvesting. Weed density was
sampled in each growing season with 1 × 1 m quadrats placed randomly on each plot. Plant material
was oven dried at 80 ◦ C for 48 h, and the dry weight, corresponding to the aboveground biomasses,
was determined. Weed infestation was expressed as the dry mass of weeds per unit area (m2 ).
Analyses of the protein content in the NL seeds was carried out according to the Kjeldahl method
(nitrogen values were multiplied by 6.25) [7]. Protein content in the seeds was expressed on a dry
weight basis (g kg−1 ) and recalculated as protein efficiency (kg ha−1 ).
Economic performance of the soil tillage systems was assessed using data from the experimental
plots, i.e., machinery operations, inputs and yields. Total cost includes the cost of seeds, fertilizers,
chemical crop protection, machinery operations, labor, and services. The calculations were based on
2015 prices. The cost of seeds, fertilizers and plant protection (herbicides, fungicides, insecticides)
were estimated according to data from agricultural dealers and national-level market prices (http:
//www.cenyrolnicze.pl). Crop subsidy data was taken from ARR (http://www.arr.gov.pl/). Subsidies
included: single area payment (€ 107.59), additional payment for legumes (€ 241.18) and direct
payments for seeds (€ 30.83). All prices and costs were recalculated in euro (€) according to the
monthly average exchange rate in September 2015 (Central Bank of the Republic of Poland, http:
//www.nbp.pl/homen.aspx?f=/kursy/kursyen.htm).
2.4. Statistical Analysis
All data were processed using one-way analysis of variance (ANOVA) with the SAS package.
The means of treatments were compared using Tukey’s Multiple Range test and the least significant
difference (LSD) was declared at the p < 0.01 and p < 0.05 levels. The relationship between the
parameters was determined with the Pearson correlation coefficient.
3. Results
The effect of soil tillage system on weed infestation, NL development and yield is shown in
Table 4.
Table 4. Effect of soil tillage system on weed infestation, narrow-leaved lupin (NL) development
and yield.
Tillage Systems
Specification LSD Values
CT RT NT
Dry mass of weeds (g m2 ) 1.5 24.6 46.4 23.84 **
Plant density (no. m2 ) 75.4 69.6 56.7 4.65 **
Dry mass of nodules per plant (mg) 73.4 85.1 102.6 16.1 **
No. of pods per plant 14.8 13.7 13.9 NS
No. of seeds per plant 57.8 51.1 56.6 NS
No. of seeds per plant pod 3.9 3.7 4.1 NS
Mass of 1000 seeds (g) 145 143 142 NS
Seed yield (t ha−1 ) 3.0 2.7 2.3 0.18 **
Protein content (g kg−1 d.m.) 295 304 314 NS
Protein efficiency (kg ha−1 ) 884 823 722 53.7 **
NS: not significant; * p < 0.05 and ** p < 0.01. Tillage: CT, conventional tillage; RT, reduced tillage; NT, no-tillage.
Weed infestation analysis, expressed as dry mass of weeds, indicated that the weed community
assembly was affected by the soil tillage system. Dry mass of weeds under CT was significantly lower,
by 23.1 g m2 and 45.7 g m2 , than in RT and NT, respectively (Table 4). There was also a significantAgronomy 2020, 10, 304 5 of 11
difference between dry mass of weeds in RT and NT. The mass of weeds in NT was approximately two
times greater than in RT.
The soil tillage systems also influenced the dry mass of nodules per plant. The largest dry nodule
mass was found on plants growing under NT (102.6 mg) and was significantly lower on plants collected
from RT and CT, by 17% and 28.5%, respectively. Soil tillage systems did not have an influence on
morphological features, such as: the number of pods per plant, the number of seeds per plant, the
number of seeds per plant pod and the mass of 1000 seeds. The Pearson’s linear correlation showed a
strong relationship, or a practically functional relationship between the number of pods per plant and
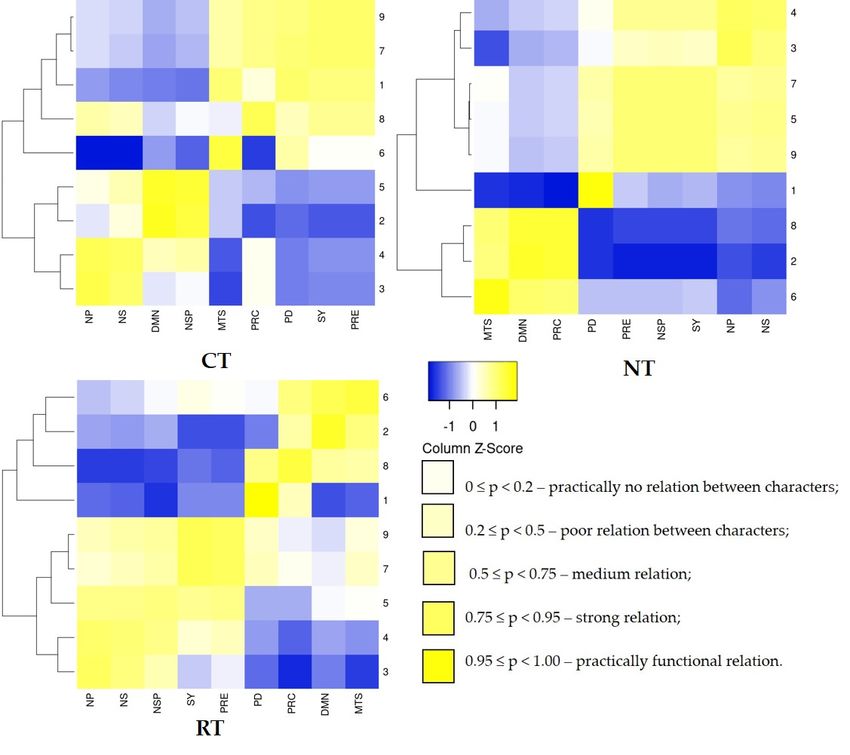
the number of seeds per plant in each soil tillage system (Figure 1).
Agronomy 2020, 10, x FOR PEER REVIEW 6 of 12
Figure1. 1.Correlation
Figure Correlationcoefficients
coefficientsbetween
betweenanalyzed
analyzedparameters
parametersforfornarrow-leaved
narrow-leavedlupin.
lupin.Tillage
Tillage
systems: TS, tillage system; CT, conventional tillage; RT, reduced tillage; NT, no-tillage. Parameters
systems: TS, tillage system; CT, conventional tillage; RT, reduced tillage; NT, no-tillage. Parameters
compared: PD, plant density; DMS, dry mass of nodule per plant; NP, number of pods per plant; NS,
compared: PD, plant density; DMS, dry mass of nodule per plant; NP, number of pods per plant;
number of seeds per plant; NSP, number of seeds per plant pod; MTS, mass of 1000 seeds; SY, seed
NS, number of seeds per plant; NSP, number of seeds per plant pod; MTS, mass of 1000 seeds; SY,
yield; PRC, protein content; PRE, protein efficiency.
seed yield; PRC, protein content; PRE, protein efficiency.
The analysis of variance showed a significant effect of tillage system on the NL seed yield (Table 4).
The analysis of variance showed a significant effect of tillage system on the NL seed yield
The greatest yield was found in CT and was significantly lower in RT and NT, by 10% and 23.3%,
(Table 4). The greatest yield was found in CT and was significantly lower in RT and NT, by 10%
respectively. In CT, the yield level mostly depended on plant density, while in NT, it depended on the
and 23.3%, respectively. In CT, the yield level mostly depended on plant density, while in NT, it
number of seeds per plant pod.
depended on the number of seeds per plant pod.
The protein content ranged from 295 g kg−1 in CT to 314 g kg−1 in NT, and tillage system did
not influence the protein content in NL seeds. However, there was a trend of increasing protein
content in seeds as the tillage system became more minimized (i.e., NT > RT > CT): in NT, it was
strongly related to the dry mass of nodules per plant (Figure 1). The Pearson’s linear correlation
showed a practical functional relationship between seed yield and protein efficiency. Protein
efficiency was strongly related to the NL seed yield across all tillage systems (Figure 1); proteinAgronomy 2020, 10, 304 6 of 11
The protein content ranged from 295 g kg−1 in CT to 314 g kg−1 in NT, and tillage system did not
influence the protein content in NL seeds. However, there was a trend of increasing protein content
in seeds as the tillage system became more minimized (i.e., NT > RT > CT): in NT, it was strongly
related to the dry mass of nodules per plant (Figure 1). The Pearson’s linear correlation showed a
practical functional relationship between seed yield and protein efficiency. Protein efficiency was
strongly related to the NL seed yield across all tillage systems (Figure 1); protein efficiency ranged
from 722 kg ha−1 in NT to 884 g kg−1 in CT. Protein efficiency in CT was 6.9 % and greater than in RT
and in NT, respectively. Moreover, the costs of producing 1 kg of protein and 1 tonne of seeds were
lowest in CT (Table 5).
Table 5. Economic analysis of profitability of narrow-leaved lupin (NL) cultivation under different soil
tillage systems (all values expressed in euro).
Tillage Systems
Specification
CT RT NT
Production value * ha−1 1091.02 1019.88 925.02
Total cost ha−1 721.49 711.40 682.73
Gross agricultural income ha−1 369.53 308.48 242.29
Cost of 1 t seed production ** 240.50 263.48 296.94
Cost of 1 kg protein production *** 0.82 0.86 0.95
Tillage: CT, conventional tillage; RT, reduced tillage; NT, no-tillage, * (average yield × € 237. 14, price of 1 t
ha−1
seeds) + € 379.60 EU subsidies, ** Total cost/average yield ha−1 , *** Total cost/average protein yield ha−1 .
Although, the cost of total production was greatest in the CT system (€ 721.49 ha−1 ), the gross
agricultural income was also the highest (€ 369.53 ha−1 ). This means that the increase in yield produced
by the more intensive tillage option completely covered the increase in the total cost. The lowest
production value (€ 925.02 ha−1 ) was recorded in NT. In this tillage system, the highest costs for seeds
and protein production (€ 296.94 t−1 and € 0.95 t−1 , respectively) and the lowest gross agricultural
income (€ 242.29 ha−1 ) were also recorded. In comparison with CT, the total cost of production in NT
was 5.7% lower, but the gross agricultural income was 34.5% lower. In the case of RT, the differences
were smaller, but income losses still exceeded the value of savings because of reduced production costs.
Cereal yield from the different tillage systems is shown in Table 6.
Table 6. Effect of soil tillage system on cereal yield (t ha−1 ) in the crop rotation.
Tillage Systems
Species LSD Values
CT RT NT
Winter wheat (mean 2013–2016) 6.8 6.4 5.7 0.35 **
Winter triticale (mean 2014–2016) 6.4 6.0 5.9 0.39 **
Winter barley (mean 2015–2016) 4.1 3.7 2.2 0.28 **
Winter wheat (mean 2015–2016) 6.7 5.9 5.1 0.49 **
Winter triticale (mean 2015–2016) 6.3 5.9 5.6 0.55 **
** p < 0.01. Tillage: CT, conventional tillage; RT, reduced tillage; NT, no-tillage.
Minimizing tillage operations decreased the yield of all cereals in the rotation. Yield of WW was
significantly lower in the RT system (by 6%), and the NT system (by 16%), in comparison to CT. There
was no significant difference between CT and RT for the cultivation of WT, although the difference was
7% (430 kg ha−1 ) in comparison to NT. For WB, yield was 0.43 t ha−1 lower in RT and 1.89 t ha−1 lower
in NT, compared to CT. In comparison to RT, the NT system decreased WW yield by 11.2%, WT yield
by 1% and WB yield by 39.6%.Agronomy 2020, 10, 304 7 of 11
4. Discussion
High levels of weed infestation in RT and/or NT have been reported in many experiments [8–12].
Usually, ploughing and harrowing for soil preparation is used prior to sowing of lupin. In the case of
NT, chemical control (glyphosate) is used as a desiccant in the pre-sowing stage instead of mechanical
control. This program of chemical control is not particularly effective as weeds in lupin crops have
become increasingly difficult to control due to the development of resistance to commonly used
herbicides [13]. Chemical control of weeds should mainly consider the selectivity of the crop to the
herbicide, followed by an observation of the application technology, as well as other important details
such as the mixture of the compounds, the environmental conditions and the use of adjuvants etc. [14].
Ploughing moves weeds seeds near to the surface of the soil, where after germination, the weeds are
mechanically or chemically destroyed. Auškalniene and Auškalnis [15] found that the largest number
of weed seed species, in reduced and no-tillage systems, occurred in the upper soil layer (0–5 cm).
Moreover, ploughing moves microorganisms near to the soil’s surface.
In the current study, the soil tillage systems also modified the dry mass of nodules per plant.
Dogan et al. Reference [16] observed that the highest dry nodule values in NL occurred with direct
sowing and the lowest in CT with burnt residue. Many similar studies have reported that NT systems
had positive effects on soil activities [17–20]. For example, Rhizobia are particularly sensitive to heat,
desiccation (drying) and light [21]. There are lots of experiments which demonstrated that no-tillage
improves soil moisture content and soil water storage [22–25]. In addition, no-tillage increases the
content of organic carbon and macro elements in the soil, which can be a source of nutrients for
microorganisms [17,26,27].
In the current study, as with earlier experiments [28], the soil tillage systems did not have a
significant influence on number of seeds per plant pod, although the CT and RT systems led to a
reduction in the number of pods and seeds per plant. Moreover, tillage system did not have an
influence on seed yield of NL and yellow lupin, which amounted to approximately 1 t ha−1 .
According to Suliman [29], conventional tillage and mechanical weed control significantly increases
the plant density of legumes. In the present experiment, the highest plant density was found in CT
(75.4 m2 ) and was significantly lower under RT (by 7.7%) and NT (by 24.8%). In the earlier study [28],
the results were similar: the lowest plant density for yellow lupin (cv. Mister) and narrow-leaved lupin
(cv. Baron) were found under NT and were significantly higher in CT. The non-tillage system has been
reported to reduce plant density [30–34]. Some authors claim that to the reason is forecrop straw, which
reduces soil warming and seed germination [35,36]. In our study, the reason for the significantly lower
plant density, in both minimized soil tillage systems, could be that weed infestation was substantially
greater than in the CT system.
In our study, the soil tillage system appeared to affect the seed yield of NL; the greatest yield was
found in CT. In turn, Heenan et al. [32] showed that the mean annual seed yields of NL ranged from
0.26–3.15 t ha−1 and that the differences in lupin seed yields between tillage (conventional cultivation
and direct drilling) and stubble treatments over time were marginal. Those authors also observed
that, on less stable soils, it is possible for similar treatments over the same period to have a greater
effect on lupin yield. In the literature, it is difficult to find experiments that investigate the effect of
soil tillage systems on lupin production. Many similar studies, conducted in different conditions and
locations, have reported that different minimized soil tillage systems had no negative effects on the
yield of soybean [11,37–40].
Lupin (Lupinus sp.) is a legume that is valued primarily for its high protein content, similar to
soybean. In contrast to soybean, lupin can be grown in more temperate and cool climates and can be
considered as the strongest competitor to soybean [41].
The decision to undertake lupin production is determined by many factors; of the most important
is the profitability of production. According to Rutkowski et al. [42], ground soybean contains 46%
protein. In 2014/2015, 1 t of ground soybean cost € 395 (The Fodder Market, December 2015). Thus, the
price of 1 kg of ground soybean protein was € 0.86 (price excluding profit margin of dealers) and wasAgronomy 2020, 10, 304 8 of 11
lower than the production costs of 1 kg protein of NL under the NT system, similar to the RT system
and higher when compared to the CT system.
Most experiments with cereals, which compare conventional and no-ploughing tillage systems,
have given inconsistent results. Some authors claim that non-inversion tillage has no effect on
the yield of cereals [11,43–46]. Others have shown decreased cereal yield under no-ploughing
conditions [47–50]. Some studies have found an increase in cereal yield in reduced and no-tillage soil
tillage systems [40,51–53]. In our study, WW and WT yields were similar, and WB yield was lowest,
across each soil tillage system in the same years (2015–2016). Martínez et al. [54] reported that crop
yield was significantly greater with the NT system for winter cereals (WW, WB) and legumes (field
beans and peas), but was lower for root and tuber crops (sugar beet, potatoes). According to those
authors, the high crop yields in the no-tillage system in their long-term field experiment were due to a
well-balanced crop rotation.
5. Conclusions
Productivity of the narrow-leaved lupin-winter wheat-winter triticale-winter barley rotation
was lower under RT and NT systems compared to CT. The highest NL yield was found in the CT
system. Both RT and NT systems relevantly decreased seed yield. Economic analysis indicated that in
both minimized soil tillage systems the income losses exceeded the value of savings from reduced
production costs, although all tillage systems were profitable. In practice, minimalizing cultivation in
rotations with 75% cereals produced a decrease in yield for all crops, which can lead to resign of using
the RT and NT under grey-brown podsolic soil.
Author Contributions: K.P. and A.F. conceived and designed the experiments; K.P., A.F., J.S. and G.S. performed
the field experiments and analyzed the data; A.F. statistical analysis; K.R. and H.S. prepared the references; K.P.
wrote the paper; H.S. revised the manuscript. All authors have read and agreed to the published version of
the manuscript.
Funding: This research was funded by Polish Ministry of Agriculture and Rural Development project number
HOR 3.3/2011–2015. and The APC was funded by Ministry of Science and Higher Education programme Project
No. 005/RID/2018/19.
Acknowledgments: This study was made possible by a grant from the Polish Ministry of Agriculture and Rural
Development, Project: Improving domestic sources of plant protein, their production, trading and use in animal feed, project
No. HOR 3.3/2011–2015 And within the framework of Ministry of Science and Higher Education programme as
„Regional Initiative Excellence” in years 2019–2022, Project No. 005/RID/2018/19.
Conflicts of Interest: The authors declare no conflict of interest.
References
1. Voisin, A.S.; Gueguen, J.; Huyghe, C.; Jeuffroy, M.H.; Magrini, M.B.; Meynard, J.M.; Pellerin, S.; Pelzer, E.
Legumes for feed, food, biomaterials and bioenergy in Europe: A review. Agron. Sustain. Dev. 2014, 34,
361–380. [CrossRef]
2. Schott, C.; Mignolet, C.; Meynad, J.M. Les oléoprotéagineux dans les systémes de culture: Évolution des
assolements et des successions culturales depuis les années 1970 dans le bassin de la Seine. OCL 2010, 17,
276–291. [CrossRef]
3. Murphy-Bokern, D.; Watson, C. Legume-Supported Cropping Systems for Europe. Looking Forward. 2016.
Available online: http://www.legumefutures.de/images/Legume_Futures_Looking_Forward.pdf (accessed
on 9 January 2018).
4. EUROSTAT. Agricultural Production–Crops. 2018. Available online: https://ec.europa.eu/eurostat/statistics-
explained/index.php?title=Agricultural_production_-_crops (accessed on 23 November 2018).
5. Kordas, L. Energy and economic effects of reduced tillage in crop rotation. Acta Sci. Pol. Agric. 2005, 4, 51–59.
6. Jastrz˛ebska, M.; Kostrzewska, M.K.; Marks, M.; Jastrz˛ebski, W.P.; Treder, K.; Makowski, P. Crop Rotation
Compared with Continuous Rye Cropping for Weed Biodiversity and Rye Yield. A Case Study of a Long-Term
Experiment in Poland Agronomy. Agronomy 2019, 9, 644. [CrossRef]
7. AOAC. Official Methods of Analysis; Association of Official Analytical Chemists: Washington, DC, USA, 1975.Agronomy 2020, 10, 304 9 of 11
8. Gill, K.S.; Arshad, M.A. Weed flora in the early growth period of spring crops under conventional, reduced,
and zero tillage systems on a clay soil in northern Alberta, Canada. Soil Tillage Res. 1995, 33, 65–79. [CrossRef]
9. Samarajeewa, K.B.D.P.; Horiuchi, T.; Oba, S. Weed population dynamics in wheat as affected by Astragalus
sinicus L. (Chinese milk vetch) under reduced tillage. Crop Prot. 2005, 24, 864–869. [CrossRef]
10. Özpinar, S. Effects of tillage systems on weed population and economics for winter wheat production under
the Mediterranean dryland conditions. Soil Tillage Res. 2006, 87, 1–8. [CrossRef]
11. Rusu, T.; Gus, P.; Bogdan, I. The influence of minimum soil tillage systems on weed density, frequency of
phytopatogenous agents and crop yields of soybean, wheat, potato, rape and corn. J. Food Agric. Environ.
2006, 4, 225–227.
12. Légère, A.; Stevenson, F.C.; Ziadi, N. Contrasting responses of weed communities and crops to 12 years of
tillage and fertilization treatments. Weed Technol. 2008, 22, 309–317. [CrossRef]
13. Anonymous. The Biology of Lupinus L. (Lupin or Lupine); Australian Government; Version 1: April 2013;
Department of Health and Ageing, Office of the Gene Technology Regulator: Canberra, Australia, 2013; p. 64.
14. Rodrigues dos Reis, A.R.; Vivian, R. Weed competition in the soybean crop management in Brazil.
In Soybean–Applications and Technology; IntechOpen: London, UK, 2011; p. 402.
15. Auškalniene, O.; Auškalnis, A. The influence of tillage system on diversities of soil weed seed bank.
Agron. Res. 2009, 7, 156–161.
16. Dogan, K.; Celik, I.; Gok, M.; Coskan, A. Effect of different soil tillage methods on rhizobial nodulation,
biomass and nitrogen content of second crop soybean. Afr. J. Microbiol. Res. 2011, 5, 3186–3194.
17. Doran, J.W.; Elliott, E.T.; Paustian, K. Soil microbial activity, nitrogen cycling, and long-term changes in
organic carbon pools as related to fallow tillage management. Soil Tillage Res. 1998, 49, 3–18. [CrossRef]
18. Madejón, E.; Moreno, F.; Murillo, J.M.; Pelegrin, F. Soil biochemical response to long-term conserva-tion
tillage under semi-arid Mediterranean conditions. Soil Tillage Res. 2007, 94, 346–352. [CrossRef]
19. Morris, N.L.; Miller, P.C.H.; Orson, J.H.; Froud-Williams, R.J. The adoption of non-inversion till-age systems in
the United Kingdom and the agronomic impact on soil, crops and the environment-A review. Soil Tillage Res.
2010, 108, 1–15. [CrossRef]
20. Melero, S.; Panettieri, M.; Madejón, E.; Gómez Macpherson, H.; Moreno, F.; Murillo, J.M. Implementa-tion of
chiseling and mouldboard ploughing in soil after 8 years of no-till management in SW, Spain: Effect on soil
quality. Soil Tillage Res. 2011, 112, 107–113. [CrossRef]
21. Flynn, R. Inoculation of Legumes. Guide A-130. College of Agricultural, Consumer and Environmental
Sciences, New Mexico State University. 2015. Available online: https://aces.nmsu.edu/pubs/_a/A130.pdf
(accessed on 9 January 2018).
22. Govaerts, B.; Fuentes, M.; Mezzalama, M.; Nicol, J.M.; Deckers, J.; Etchevers, J.D.; Figueroa-Sandoval, B.;
Sayre, K.D. Infiltration, soil moisture, root rot and nematode populations after 12years of different tillage,
residue and crop rotation managements. Soil Tillage Res. 2007, 94, 209–219. [CrossRef]
23. Fernandez-Ugalde, O.; Virto, I.; Bescansa, P.; Imaz, M.J.; Enrique, A.; Karlen, D.L. No-tillage improvement
of soil physical quality in calcareous, degradation-prone, semiarid soils. Soil Tillage Res. 2009, 106, 29–35.
[CrossRef]
24. Moraru, P.I.; Rusu, T. Effect of tillage systems on soil moisture, soil temperature, soil respiration and
production of wheat, maize and soybean crop. J. Food Agric. Environ. 2012, 10, 445–448.
25. Lampurlanés, J.; Plaza-Bonilla, D.; Álvaro-Fuentes, J.; Cantero-Martínez, C. Long-term analysis of soil
water conservation and crop yield under different tillage systems in Mediterranean rainfed conditions.
Field Crops Res. 2016, 189, 59–67. [CrossRef]
26. Franzluebbers, A.J. Soil organic matter stratification ratio as an indicator of soil quality. Soil Tillage Res. 2002,
66, 95–106. [CrossRef]
27. Limousin, G.; Tessier, D. Effect of no-tillage on chemical gradients and topsoil acidification. Soil Tillage Res.
2007, 92, 167–174. [CrossRef]
28. Faligowska, A.; Szukała, J. The effect of various long-term tillage systems on yield and yield component of
yellow and narrow-leaved lupin. Turk. J. Field Crops. 2015, 20, 188–193. [CrossRef]
29. Suliman, A.A.M. Contribution of weed control and tillage systems on soil moisture content, growth and
forage quality of (Clitoria & Siratro) mixture under-rainfed conditions at Zalingei-Western Darfur state-Sudan.
J. Sci. Technol. 2008, 3, 80–90.Agronomy 2020, 10, 304 10 of 11
30. Borin, M.; Sartori, L. Barley, soybean and maize production using ridge tillage, no-tillage and conventional
tillage in north-east Italy. J. Agric. Eng. Res. 1995, 62, 229–236. [CrossRef]
31. Blecharczyk, A.; Skrzypczak, G.; Małecka, I.; Piechota, T. The effect of diverse tillage systems on physical soil
properties and yielding of winter wheat and pea. Folia Univ. Agric. Stetin. Agric. 1999, 195, 171–179.
32. Heenan, D.P.; Taylor, A.C.; Chan, K.Y.; McGhie, W.J.; Collins, D.; Lill, W.J. The impact of long-term rotation,
tillage and stubble management on lupin (Lupinus angustifolius L.) productivity. Field Crops Res. 2000, 67,
11–23. [CrossRef]
33. Szukała, J.; Mystek, A.; Kurasiak-Popowska, D. Productional and economic effects of different soil tillage
systems of lupin. Zesz. Probl. Postepow Nauk Rol. 2003, 495, 219–230.
34. Małecka-Jankowiak, I.; Blecharczyk, A.; Sw˛edrzyńska, D.; Sawinska, Z.; Piechota, T. The effect of long-term
tillage systems on some soil properties and yield of pea. Acta Sci. Pol. Agric. 2016, 15, 37–50.
35. Rasmussen, K.J. Impact of ploughless soil tillage on yield and soil quality: A Scandinavian review. Soil Tillage
Res. 1999, 53, 3–14. [CrossRef]
36. Soane, B.D.; Ball, B.C.; Arvidsson, J.; Basch, G.; Moreno, F.; Roger-Estrade, J. No-till in northen, western and
south-western Europe: A review of problem and opportunities for crop production and the environment.
Soil Tillage Res. 2012, 118, 66–87. [CrossRef]
37. Singer, J.W.; Kohler, K.A.; Liebman, M.; Richard, T.L.; Cambardella, C.A.; Buhler, D.D. Tillage and compost
affect yield of corn, soybean, and wheat and soil fertility. Agron. J. 2004, 96, 531–537. [CrossRef]
38. Yin, X.; Al-Kaisi, M.M. Periodic response of soybean yields and economic returns to long term no tillage.
Agron. J. 2004, 96, 723–733. [CrossRef]
39. Wilhelm, W.W.; Wortmann, C.S. Tillage and rotation interactions for corn and soybean grain yield as affected
by precipitation and air temperature. Agron. J. 2004, 96, 425–432. [CrossRef]
40. Košutić, S.; Filipović, D.; Gospodarić, Z.; Husnjak, S.; Kovačev, I.; Čopec, K. Effects of different soil tillage
systems on yield of maize, winter wheat and soybean on albic luvisol in north-west Slavonia. J. Cent.
Eur. Agric. 2005, 6, 241–248.
41. Dueñas, M.; Hernández, T.; Estella, I.; Fernández, D. Germination as a process to increase the polyphenol
content and antioxidant activity of lupin seeds (Lupinus angustifolius L.). Food Chem. 2009, 177, 599–607.
[CrossRef]
42. Rutkowski, A.; Hejdysz, M.; Kaczmarek, S.; Mikuła, R.; Kasprowicz-Potocka, M.; Zaworska, A. Potential Use
of Legumes in Feeding Monogastric Animals; Foundation of Assistance Programmes for Agriculture: Warsaw,
Poland, 2014; p. 37.
43. Anken, T.; Weisskopf, P.; Zihlmann, U.; Forrer, H.; Jansa, J.; Perhacova, K. Long-term tillage systems effects
under moist cool conditions in Switzerland. Soil Tillage Res. 2004, 78, 171–183. [CrossRef]
44. Golik, S.; Chidichimo, H.; Sarandon, S. Biomass production, nitrogen accumulation and yield in wheat under
two tillage systems and nitrogen supply in the Argentine Rolling Pampa. World J. Agric. Sci. 2005, 1, 36–41.
45. Özpinar, S.; Çay, A. Effects of minimum and conventional tillage systems on soil properties and yield of
winter wheat (Triticum aestivum L.) in clay-loam in Çanakkale region. Turk. J. Agric. For. 2005, 29, 9–18.
46. Małecka, I.; Blecharczyk, A.; Sawinska, Z.; Sw˛edrzyńska, D.; Piechota, T. Winter wheat yield and soil
properties response to long-term non-inversion tillage. J. Agric. Sci. Technol. 2015, 17, 1571–1584.
47. Camara, K.; Payne, W.; Rasmussen, P. Long-term effects of tillage, nitrogen, and rainfall on winter wheat
yields in the Pacific Northwest. Agron. J. 2003, 95, 828–835. [CrossRef]
48. Rieger, S.; Richner, W.; Streit, B.; Frossard, E.; Liedgens, M. Growth, yield, and yield components of winter
wheat and the effects of tillage intensity, preceding crops, and N fertilisation. Eur. J. Agron. 2008, 28, 405–411.
[CrossRef]
49. Jug, I.; Jug, D.; Sabo, M.; Stipeševć, B.; Stošić, M. Winter wheat yield and yield components as affected by soil
tillage systems. Turk. J. Agric. For. 2011, 35, 1–7.
50. Litke, L.; Gaile, Z.; Ruža, A. Nitrogen fertilizer influence on winter wheat yield and yield components
depending on soil tillage and forecrop. Res. Rural Dev. 2017, 23, 54–61.
51. Halvorson, A.D.; Black, A.L.; Krupinsky, J.M.; Merrill, S.D. Dryland winter wheat response to tillage and
nitrogen within an annual cropping system. Agron. J. 1999, 91, 702–707. [CrossRef]
52. Melaj, M.; Echeverria, H.; Lopez, S.; Studdert, G.; Andrade, F.; Barbaro, N. Timing of nitrogen fertilization in
wheat under conventional and no-tillage system. Agron. J. 2003, 95, 1525–1531. [CrossRef]Agronomy 2020, 10, 304 11 of 11
53. De Vita, P.; Di Paolo, E.; Fecondo, G.; Di Fonzo, N.; Pisante, M. No-tillage and conventional tillage effects on
durum wheat yield, grain quality and soil moisture content in southern Italy. Soil Tillage Res. 2007, 92, 69–78.
[CrossRef]
54. Martíneza, I.; Chervet, A.; Weisskopf, P.; Sturny, W.G.; Etana, A.; Stettler, M.; Forkman, J.; Kellera, T.
Two decades of no-till in the Oberacker long-term field experiment: Part I. Crop yield, soil organic carbon
and nutrient distribution in the soil profile. Soil Tillage Res. 2016, 163, 141–151.
© 2020 by the authors. Licensee MDPI, Basel, Switzerland. This article is an open access
article distributed under the terms and conditions of the Creative Commons Attribution
(CC BY) license (http://creativecommons.org/licenses/by/4.0/).You can also read


