Identification of heavy metals source within selected active dumpsites in southeastern Nigeria
←
→
Page content transcription
If your browser does not render page correctly, please read the page content below
Vol: 36(2), Article ID: e2021008, 18 pages
                                                                                                           https://doi.org/10.5620/eaht.2021008
eISSN: 2233-6567

                          Original Article

    Identification of heavy metals source within selected active dumpsites
    in southeastern Nigeria
    Valentine Ifenna Onwukeme 1, Victor Chukwuemeka Eze *1

    1Department of Pure and Industrial Chemistry, Faculty of Physical Sciences, Nnamdi Azikiwe University, P.M.B. 5025,
    Awka, Anambra State, Nigeria.
    *Correspondence: ezevictor54@yahoo.com

    Received: September 5, 2020 Accepted: April 6, 2021

        Abstract
        Discriminating contaminant sources is crucial for pollution control. The study aimed at identifying the source(s) of heavy
        metals in active dumpsite soils from selected areas in Southeastern Nigeria using statistical tools. The dumpsites were
        Enyimba dumpsite Aba (dumpsite-1), Okpuno-Egbu dumpsite Nnewi (dumpsite-2), Rice mill dumpsite Abakaliki
        (dumpsite-3) and Nekede dumpsite Owerri (dumpsite-4) in Abia, Anambra, Ebonyi and Imo State respectively. After
        standard sampling, elemental analysis was carried out using an energy dispersive x-ray fluorescence spectrometer;
        Chromium (Cr), Manganese (Mn), Cobalt (Co), Iron (Fe), Nickel (Ni), Copper (Cu), Zinc (Zn), Arsenic (As), Lead (Pb)
        and Cadmium (Cd) were quantified and results showed they were present in high concentrations above control and
        standard values set by the National Environmental Standards and Regulations Enforcement Agency (NESREA) and the
        Food and Agriculture Organization of the United Nations (FAO) / World Health Organization (WHO). Metals
        investigated exhibited variable correlations among themselves suggesting potential multi-element contamination, while
        soil organic matter (OM) and pH displayed both significant positive and negative influence on the metal availability in
        the studied soils. Test of significance of the observed correlation were positive and significant (r > 0.9 at p < 0.05/0.01)
        for Cr/Co, Cr/Fe, Mn/Co, Co/Fe, Cu/Zn, Zn/Pb, Cu/As, Cu/Pb, Zn/As, As/Pb in dumpsite-1; in dumpsite-2, only Ni/Cu;
        in dumpsite-3, Fe/OM and Cd/OM while in dumpsite-4,Co/Fe, Cu/As, Cu/Pb, Zn/Cd, Ni/OM, and As/Pb. Hierarchical
        cluster analysis (HCA) and Principal component analysis (PCA) extracted two to three components/groups based on
        square Euclidean distance and eigenvalues > 1, confirming sources to be from organic pigments in plastics, scrap metals
        and incinerated biodegradable wastes. This study concludes that statistical methods can provide a scientific basis for
        monitoring heavy metals accumulation in dumpsite soils.

    Keywords: Heavy metals, source, statistical analysis, EDXRF, dumpsite soil.

    Introduction
               The impact of waste on health and the environment has been an issue of global concern over the years [1]. Wastes
    are sources of environmental pollution through the introduction of toxic substances above their threshold limit into the
    environment. However, in Nigeria, most of the active dumpsites are now located within the city due to population influx
    and expansion [2,3]. Recent studies have shown that waste disposal on dumpsites introduces additional heavy metals into
    surrounding soil [2]. Soil is a natural reservoir of metals whose concentration is associated with several factors such as
    parent material, pH and organic matter (OM) [3]. In the last few decades, metal contents in soils have risen to dangerous
    levels mainly due to human activities such as industrialization and urbanization [4]. The properties and qualities of soils
    can be adversely affected by the high concentration of municipal wastes released from homes, schools, offices [5]. In many
    cities of the developing world, the increment of waste has led to environmental pollution and degradation [6]. It was
    estimated that in 2006 the total amount of waste generated globally reached 2.02 billion tons, representing a 7% annual
    increase since 2003 [6]. Global generation of waste between 2007 and 2011 raised by 37.3%, equivalent to a roughly 8%
    increase per year according to [6]. In some developing countries like Nigeria, areas with high refuse disposal rate are
    associated with high population density, increased commercial and industrial activities. These areas have developed
    without proper planning and it has led to the presence of waste dumps within built-up areas inhabited by millions of people.
    Consequently, such waste dumps become a point source for soil pollution as they serve as a host for leachate from dumpsites
    [7,8,9]. Considering the rising level of heavy metals in soils, the knowledge of the heavy metals accumulation in soil, the
    origin of these metals and their possible interactions with soil parameters have become priority objectives in most

        Copyright © 2021 The Korean Society of Environmental Health and Toxicology/Korea Society for Environmental Analysis This is an Open Access article
        distributed under the terms of the Creative Commons Attribution Non-Commercial License (https://creativecommons.org/ licenses/by-nc/4.0/) which
        permits unrestricted non-commercial use, distribution, and reproduction in any medium, provided the original work is properly cited.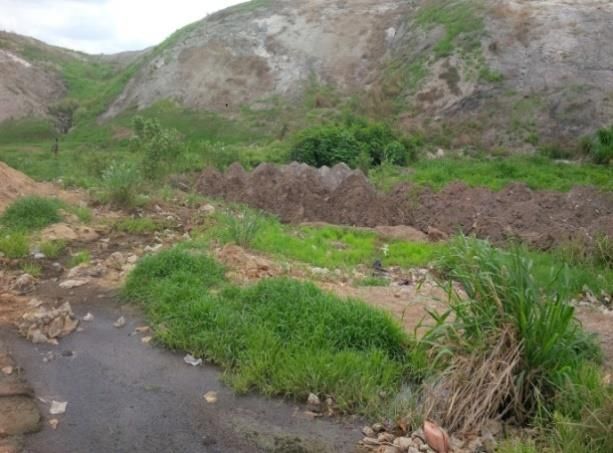
Environmental Analysis Health and Toxicology 2021, 36(2):e2021008
environmental monitoring [10,11,12]. Statistical methods such as correlation analysis (CA), principal component analysis,
hierarchical cluster analysis (HCA) and analysis of variance (ANOVA) have been widely used to investigate heavy metal
concentration, accumulation and origin in dumpsite soils. CA was used to quantitatively analyze and confirm the
relationship between soil pH, OM and heavy metals concentration [13,14]. Principal component analysis (PCA) was adopted
to assist the interpretation of elemental data. This method allows identifying the different groups of metals that correlate
and thus can be considered as having a similar behavior and common origin [13,14,15]. HCA was used to find groups among
metals based on Square Euclidian Distance (SED). ANOVA was conducted to reveal the most significant factor controlling
the spatial differences in heavy metals concentration between the studied dumpsite soils [13]. This study is aimed at
determining, using statistical methods, the most significant factor controlling the distribution of heavy metals and to identify
the possible origin (source) of these heavy metals in soil samples collected from four selected active dumpsites in
Southeastern Nigeria. It is hoped that this study would provide a scientific basis for pollution control and further monitoring
of heavy metals accumulation in the studied dumpsites.
Materials and Methods
Study area
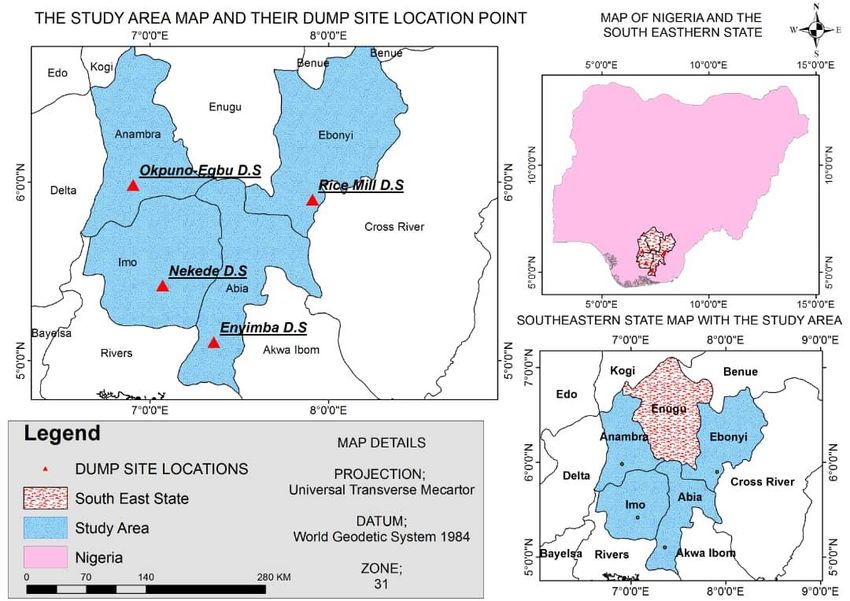
This study was conducted in four major cities in Southeastern Nigeria namely: Abakaliki, Ebonyi; Owerri, Imo;
Nnewi, Anambra; and Aba, Abia (Figure1). Southeastern Nigeria has two distinct seasons (wet and dry seasons) [16]. Rainy
(wet) season lasts between 8−9 months while the dry season is of shorter duration between 3−4 months [16]. Based on
geographical location, the climate is tropical rainy, and the region experiences abundant rainfall with very high
temperatures. The annual temperature ranges from 26 to 29C [16]. The selected active dumpsites for this study are Enyimba
dumpsite in Aba, Okpuno-Egbu dumpsite in Nnewi, Rice mill dumpsite in Abakaliki and Nekede dumpsite in Owerri.
Enyimba dumpsite is located in Aba, the commercial hub of Southern Nigeria [16,17]. The high number of markets,
industries and fabricating companies in the area has resulted in high population density and consequently, high
accumulation of wastes [17]. The dumpsite is an open dumpsite and its proximity to schools, offices, markets and industries
in Aba gave rise to the huge amount of wastes dumped there on a daily, weekly and monthly basis. Also, the dumpsite is a
low land and is drained by Imo and Aba rivers and their tributaries [16,17]. Okpuno-Egbu dumpsite is situated along
Okigwe-Oba-Onitsha road, Nnewi. The dumpsite was approved by the state government for the disposal of wastes
generated from industries and fabricating companies, markets, schools, residential houses and offices within the area.
Wastes generated from this city are about 3000 tons/day, which ought to have increased over the years [16,18]. Rice mill
dumpsite is located along old Ogoja road Abakaliki. The major wastes found in the dumpsite are agricultural wastes [16].
The major occupation of the residents in this area is farming and they dump all sorts of their agricultural wastes there. Also,
the Rice mill dumpsite is used extensively for cultivating varieties of edible vegetables and arable crops [18]. Nekede
dumpsite is located along Owerri-Aba express road, close to the Nekede mechanic village. The area of the dumpsite is about
two hectares [19], bound by two rivers, Otamiri to the east and Nworie on the south [19] and is surrounded by a stretch of
residential buildings and farmlands [19]. The dumpsite is the biggest and the most active in Owerri metropolis; a large
volume of all sorts of wastes are dumped there [16,19,20]. The major wastes found there are wastes from households,
markets, hotels, offices, schools, industries and hospitals [16,19,20].
Page 2 / 18 http://eaht.org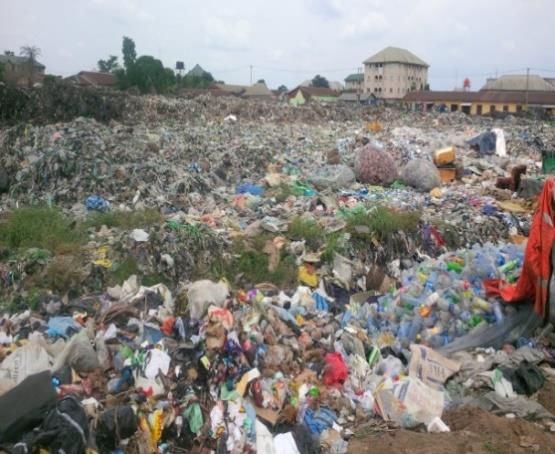
Eze et al. | Identification of Heavy Metals Source within Selected Active Dumpsites

    Figure 1. Map of the study area and their dumpsite location points.

                           (a)                                                           (b)

                           (c)                                                           (d)

    Figure 2. Photographs of studied dumpsites, (a) Dumpsite 1 (Enyimba), (b) Dumpsite 2 (Nnewi), (c) Dumpsite 3
    (Rice mill), and (d) Dumpsite 4 (Nekede).

http://eaht.org                                                                                       Page 3 / 18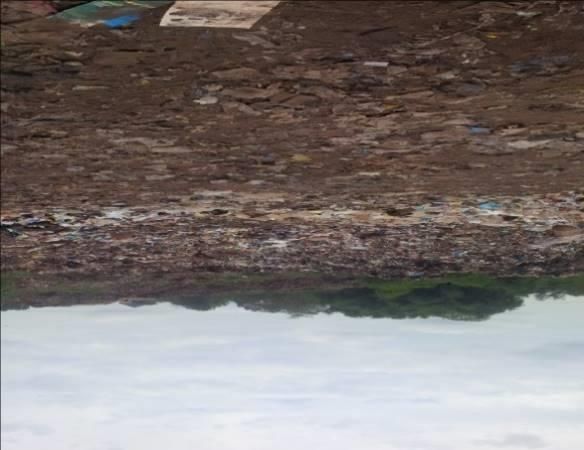
Environmental Analysis Health and Toxicology 2021, 36(2):e2021008

Sample collection, preparation and analysis
           Soil samples were collected from the four selected active waste dumpsites according to Yuan et al. [16]. Each of
the dumpsites was divided into four locations; north, east, west and south. Sampling errors were minimized by collecting
quintuplicate sub-samples 10 m apart from each other within the sampling location using a soil auger at a depth of 0-20 cm.
The soil auger was cleaned after soil sampling at each sample location using distilled water. The sub-samples were pooled
together to form a composite sample which was taken to give a true representation of each sampling location in the dumpsite.
The soil samples were stored using polythene bags and appropriately labeled. Control soil samples were collected 20 km
away from each of the studied dumpsites where there was no form of human activities that could generate wastes. A total
of eighty sub-samples and four control samples were obtained for this work. Sample collections were done in the month of
March, during the dry season to avoid leaching of metals into sub-soil. The soil samples were pulverized using an agate
mortar and pestle, then sieved to fine particle sizes of about 0.75μm with test-sieves with vibratory electronic sieve shaker
to reduce soil matrix effects [21] until the water content of the samples was fully expelled and ready for elemental analysis.
           The elemental analysis was carried out using EDX3600B x-ray fluorescence spectrometer with analysis accuracy
(precision): 0.01 – 0.05% deviation and analytical range of element content (detection limit): 0.0001 (1ppm) – 99.99%, plating
thickness measurement comprised of ≥11 layers with diameter up to 0.005μm each layer, measurement time ranged from
60s to 200s with an energy resolution of 150±5 eV, tube voltage ranged from 5 kV to 50 kV and current in the range of 50 uA
to 1000 uA. The equipment EDX3600B x-ray fluorescence spectrometer applies XRF technology to conduct fast and accurate
elemental analysis and qualitative characterization. The system detects elements between magnesium (Mg) and uranium
(U) with high resolution and fast analysis of which the heavy metals of interest, chromium (Cr), manganese (Mn), cobalt
(Co), iron (Fe), nickel (Ni), copper (Cu), zinc (Zn), arsenic (As), lead (Pb) and cadmium (Cd), were detected and quantified.
Following the same protocol as the samples, standard reference material (SRM 2783) filter from the National Institute of
Standards and Technology (NIST) was analyzed for elemental concentrations and compared with their certified values to
validate the analyses and results were found within ±5% of the certified values.

Methods of Soil Parameters Assessment
Soil pH
         Soil pH was determined in the suspension of 1:2.5 soil to water ratio using a calibrated pH meter (Hannah checker
plus pH meter) according to the method described by literature [30].

Soil organic matter (OM)
          OM content of the soil was determined according to the method described by literature [31].

Data Analysis
            The data generated from heavy metal concentrations and selected soil parameters were analyzed using IBM SPSS
(statistical software for social sciences) version 20.0 and MS-Excel 2007. CA, PCA, HCA and ANOVA were used. CA
measured the interdependence of the set of variables under investigation, PCA and HCA helped to reduce the dataset into
groups to help understand interrelated parameters, ANOVA assisted in determining why there are differences in heavy
metals concentration between the studied dumpsite soils.

Results and Discussion
pH and organic matter (OM) content of the soil
          The results for pH and OM for the different dumpsites are presented in Table 1. OM content of the studied
dumpsites ranged from 4.23% to 12.82% with a mean of 8.62 and a standard deviation of 3.21. Okere et al. [22] attributed
the high OM content of soils to the presence of a high quantity of biodegradable waste materials. The mean pH of the studied
soil ranged from 7.0 – 7.6. Eze et al. [28] stated that soil pH in the range of 6 to 8 is often considered normal or neutral and
good for crop growth. Similar results were reported for dumpsite soils studied by other researchers [4,10,17,19,21]. The
alkaline pH of the soil was due to the decomposition of waste in the dumpsite, causing an increase in OM, and thus a
reduction in H+ on the soil exchange complex [28,35].

 Page 4 / 18                                                                                                    http://eaht.org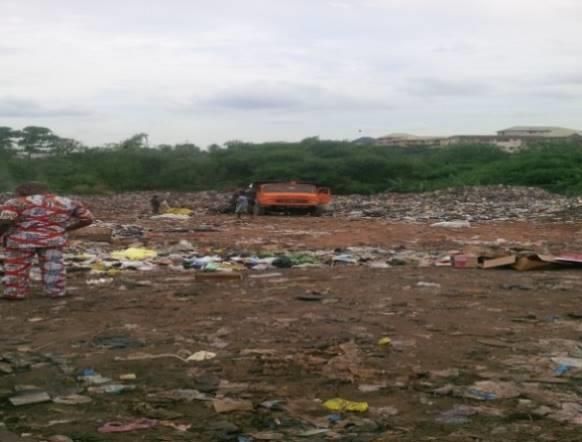
Eze et al. | Identification of Heavy Metals Source within Selected Active Dumpsites

      Table 1. pH and organic matter (OM) of soils from the dumpsites

 Paramete          Dumpsite-1   Dumpsite-2      Dumpsite-3     Dumpsite-4    Control 1   Control 2     Control 3    Control 4
                   (n =4)       (n =4)          (n =4)         (n =4)
 r

 pH                7.30±0.65    7.60± 0.23      7.30± 0.39     7.0± 0.89     6.50        6.47          6.80         5.56

 OM (%)            7.10±0.30    10.30±0.46      4.50± 0.26     12.60±0.21    2.10        1.88          2.31         4.35

Elemental analysis
           The Energy dispersive x-ray fluorescence (EDXRF) scans for soil samples are presented in Figure 3-6 while the
mean concentrations in mg/kg of heavy metals (Cr, Mn, Co, Fe, Ni, Cu, Zn, As, Pb and Cd) from four different locations
(north, east, west and south) within the studied dumpsite soils are shown in Table 2. The mean concentration of Cr ranged
from 51.80 mg/kg to 271.50 mg/kg in the studied dumpsite soils which was relatively higher than 100 mg/kg stipulated for
Nigerian soil by the National Environmental Standards and Regulations Enforcement Agency (NESREA) [25] except in
dumpsite-3. Mn mean concentrations recorded in the various dumpsites studied ranged from 270 mg/kg to 1006 mg/kg
which was above the Food and Agriculture Organization of the United Nations (FAO) / World Health Organization (WHO)
[26] permissible limit of 200 mg/kg for soils. The mean concentration of Co recorded in all the studied dumpsite soils ranged
from 387.5 mg/kg to 1337.5 mg/kg which was higher than the range (54.40 mg/kg to 100 mg/kg) reported in all the control
sites indicating an additional source of the metal in the environment. The mean concentration of Fe within the studied
dumpsite soils ranged from 4685 mg/kg to 90365.5 mg/kg. This was higher than the values obtained in the control sites
except for control site-3 (12143 mg/kg) which had high Fe content. Also, the mean concentration of Fe reported in the studied
dumpsite soils were higher than 400 mg/kg recommended by FAO/WHO [26] for Nigerian soils. The mean concentration of
Ni within the studied dumpsite soils ranged between 367.8 mg/kg and 593.3 mg/kg which was relatively higher than 70
mg/kg stipulated for Nigerian soil by NESREA [25] and that of the control sites (4.41 mg/kg to 34.60 mg/kg). The mean
concentration of Cu in the variously studied dumpsites ranged from 389.8 mg/kg to 21898.8 mg/kg which was higher than
the control sites which ranged from 3.56 mg/kg to 54.20 mg/kg. The mean concentrations of Cu in each of the dumpsites
were also higher than the stipulated100 mg/kg permissible limit of Cu in Nigerian soil by FAO/WHO [26]. The mean
concentration of Zn in the studied dumpsites ranged from 1304.3 mg/kg to 3419.5 mg/kg. However, all the dumpsite studied
recorded mean values of Zn that were above the permissible limit of Zn (421 mg/kg) in Nigerian soil according to NESREA
[25]. Udosen [27] reported that zinc is an abundant and nutritionally important element essential for humans and can only
become toxic at high concentrations. The mean concentration of As recorded in all the studied

 http://eaht.org                                                                                              Page 5 / 18
Environmental Analysis Health and Toxicology 2021, 36(2):e2021008
1 dumpsite soils ranged from 192.8 to 447.8 mg/kg which were higher than the FAO/WHO [26] permissible limits of 20.0 mg/kg for Nigerian soils and the control sites. The mean
2 concentration of Pb in the studied dumpsites ranged from 195.3 mg/kg to 3526 mg/kg which were higher than the control sites which ranged from 7.30 mg/kg to 122.2 mg/kg.
3 This indicates an additional source of metal in the studied dumpsite soils. The mean concentrations were also higher than the limit for Pb (164 mg/kg) in Nigerian soils according
4 to NESREA [25]. The mean concentration of Cd in the studied dumpsite soils varied between 0.3 mg/kg to 0.8 mg/kg which was within the recommended limit of 3 mg/kg for
5 Cd in Nigerian soils by NESREA [25]. The moderate concentration of Cd in the studied dumpsite soils could be due to mild enrichment by heavy metals in the dumpsites studied.
6 Qishlaqi and Moore [14] noted that cadmium is a hazardous heavy metal that is of no use to biological systems. Comparing the results obtained to another study, Ebong et al.
7 [15] obtained lower values in most of the heavy metals assessed (except for cadmium) while a similar heavy metal concentration was reported by Eze et al. [17]. Duru et al. [36]
8 reported higher values in the assessment of heavy metals in soils from a reclaimed section of Nekede mechanic village. Generally, the range obtained for heavy metals in
9 dumpsite-3 is lower than the range reported for other dumpsites in this study. This could be attributed to the discrepancy in age of dumpsite, volume and type of waste materials
10 as reported by Ebong et al. [15].
11
12 Table 2. Summary of mean concentration (mg/kg) of heavy metals in the studied dumpsite soils and control sites.
Heavy Dumpsite-1 Dumpsite-2 Dumpsite-3 Dumpsite-4 Mean SDV % CV Control 1 Control 2 Control 3 Control 4
metals (n =4) (n =4) (n =4) (n =4)
Cr 135.5±7.053a 126±66.6b 51.8±41.12 c 271.5±313.51 d 146.200 91.53 62.60 23 19 ND 16
Mn 270±153.31 a
1006±698.32 b
671±74.58 c
465.3±296.66 d
603.075 314.58 52.16 35 31 216 28
Co 387.5±109.33 a 1202.5±723.53 b 445±101.81 d 1337.5±1099.37c 843.125 496.54 58.89 100 98 54.4 85
Fe 46851±861.94 a 90365.5±33195.17b 31154±5550.89c 84611.5±3999.81d 63245.500 28813.45 45.56 451.32 398.1 12143 372.1
Ni 367.8±249.68 a
593.3±147.38 b
540.3±88.56 b
552.8±274.18 b
513.550 99.77 19.43 4.75 4.68 34.6 4.41
Cu 21898.8±3522.91 a 1915.5±1578.80 b 389.8±52.18 c 519.8±222.01d 6180.975 10501.28 170 5.44 5.21 54.2 3.56
Zn 3126.3±2736.68 a
3419.5±659.51 b
1304.3±172.42 c
2143.3±667.45 d
2498.350 965.17 38.63 198 180 69.8 175
As 447.8±712.27 a
355.3±438.09 b
192.8±271.84 c
241.5±342.22 d
309.350 114.70 37.08 45 52 ND 25
Pb 3526±5641.86 a 3526±2901.46 a 195.3±39.44 b 1413.3±1506.65c 2165.150 1648.17 76.12 8.56 7.98 122.2 7.3
Cd 0.8±0.96 a
0.3±0.50 a
0.8±0.96 a
0.5±0.60 a
0.600 0.24 40 0.56 0.48 ND 0.67
13 *Values with different alphabets in rows are significantly different (p < 0.05); ND: Not Detected
15
Page 6 / 18 http://eaht.orgEze et al. | Identification of Heavy Metals Source within Selected Active Dumpsites
North East
West South
Figure 3. Energy dispersive x-ray fluorescence (EDXRF) scans for soil samples at dumpsite 1
North East
West South
Figure 4. Energy dispersive x-ray fluorescence (EDXRF) scans for soil samples at dumpsite 2
Page 7 / 18 http://eaht.orgEnvironmental Analysis Health and Toxicology 2021, 36(2):e2021008
North East
West South
Figure 5. Energy dispersive x-ray fluorescence (EDXRF) scans for soil samples at dumpsite 3
North East
West South
Figure 6. samples at dumpsite 4. Energy dispersive x-ray fluorescence (EDXRF) scans for soil
Page 8 / 18 http://eaht.orgEze et al. | Identification of Heavy Metals Source within Selected Active Dumpsites
Correlation analysis (CA)
Pearson’s correlation coefficient between the variables was calculated in the form of matrices and used as a
measure of similarity and inter-relationship among parameters assessed. Results obtained in dumpsite-1 revealed positive
and significant correlation between Cr / Co (r = 0.983 at P < 0.05), Cr / Fe (r = 0.989 at P < 0.05), Mn / Co (r = 0.976 at P < 0.05),
Co / Fe (r = 0.953 at P < 0.05), Cu / Zn (r = 0.984at P < 0.05), Zn / Pb (r = 0.988 at P < 0.05), Cu / As (r = 0.993 at P < 0.01), Cu /
Pb (r = 0.994 at P < 0.01), Zn / As (r = 0.992at P < 0.01), and As / Pb (r = 0.999 at P < 0.01). Dumpsite-2 revealed positive and
significant correlation between Ni / Cu (r = 0.975at P < 0.05). Dumpsite-3 recorded positive and significant correlation of Fe
/ OM (r = 0.981 at P < 0.05) and Cd / OM (r = 0.978at P < 0.05). Dumpsite-4 revealed positive and significant correlation of Co
/ Fe (r = 0.983at P < 0.05), Cu / As (r = 0.973at P < 0.05), Cu / Pb (r = 0.975), Zn / Cd (r = 0.959 at P < 0.05), Ni / OM (r = 0.993 at
P < 0.01), and As / Pb (r = 0.999 at P < 0.01) and negative correlation of Co / pH (r = − 0.971 at P < 0.05), and Fe / pH (r = –
0.950 at P < 0.05). The findings from this study showed that soil OM content is positively correlated with Ni, Fe and Cd. The
results indicate that the variations in the concentrations of heavy metals between 98 and 99% can be attributed to the
variation in the OM content of the dumpsite soils. The observation that soil OM is a dominant variable affecting the spatial
distribution of heavy metals is consistent with well-investigated findings [14-16,31]. Udosen [27] opined that the formation
of OM and heavy metal ionic compounds reduces heavy metals bioavailability and mobility and thus, decreasing the activity
of the heavy metal ions thereby leading to increased levels of heavy metals accumulation in the soil. Moreover, a significant
negative correlation (inverse correlation) was observed between Fe / pH and Co / pH in the dumpsite soil. Previous studies
have shown that soil pH has a significant impact on the migration of Fe and Co. The inverse correlation noted in dumpsite-
4 implies that as the available Co and Fe content in the dumpsite soil increases, the pH content of the dumpsite soil tends to
decrease. The inverse correlations observed in this study are in agreement with that reported by [28]. The results obtained
for the various dumpsites studied are shown in Tables 3, 4, 5 and 6.
Table 3. Pearson’s correlation coefficient between the pH,organic matter (OM) and heavy metals in dumpsite-1.
Heavy Cr Mn Co Fe Ni Cu Zn As Pb Cd pH OM
metal
Cr 1 0.939 0.983* 0.989* 0.513 0.117 0.294 0.208 0.174 -0.849 0.746 0.511
Mn 0.939 1 0.976* 0.914 0.206 0.410 0.566 0.477 0.445 -0.876 0.927 0.582
Co 0.983* 0.976 1 0.953 0.412 0.202 0.374 0.278 0.243 -0.823 0.825 0.627
Fe 0.989* 0.914 0.953* 1 0.502 0.142 0.314 0.242 0.211 -0.896 0.721 0.381
Ni 0.513 0.206 0.412 0.502 1 -0.784 -0.663 -0.714 -0.734 -0.108 -0.176 0.270
Cu 0.117 0.410 0.202 0.142 -0.784 1 0.984* 0.993** 0.994** -0.525 0.708 -0.065
Zn 0.294 0.566 0.374 0.314 -0.663 0.984* 1 0.992** 0.988* -0.655 0.818 0.039
As 0.208 0.477 0.278 0.242 -0.714 0.993** 0.992** 1 0.999** -0.617 0.746 -0.080
Pb 0.174 0.445 0.243 0.211 -0.734 0.994** 0.988* 0.999** 1 -0.595 0.722 -0.109
Cd -0.849 -0.876 -0.823 -0.896 -0.108 -0.525 -0.655 -0.617 -0.595 1 -0.828 -0.117
pH 0.746 0.927 0.825 0.721 -0.176 0.708 0.818 0.746 0.722 -0.828 1 0.501
OM 0.511 0.582 0.627 0.381 0.270 -0.065 0.039 -0.080 -0.109 -0.117 0.501 1
http://eaht.org Page 9 / 18Environmental Analysis Health and Toxicology 2021, 36(2):e2021008
Table 4. Pearson’s correlation coefficient between the pH, organic matter (OM) and heavy metals in dumpsite-2.
Heavy Cr Mn Co Fe Ni Cu Zn As Pb Cd pH OM
metal
Cr 1 0.054 0.429 0.630 0.282 0.062 0.771 -0.017 0.490 0.741 0.353 0.939
Mn 0.054 1 0.921 0.748 0.850 0.855 0.545 0.925 0.539 -0.463 -0.897 0.165
Co 0.429 0.921 1 0.888 0.913 0.838 0.817 0.766 0.612 -0.173 -0.689 0.479
Fe 0.630 0.748 0.888 1 0.633 0.493 0.728 0.711 0.889 0.241 -0.379 0.771
Ni 0.282 0.850 0.913 0.633 1 0.975* 0.822 0.587 0.236 -0.422 -0.753 0.208
Cu 0.062 0.855 0.838 0.493 0.975* 1 0.679 0.607 0.104 -0.614 -0.855 -0.012
Zn 0.771 0.545 0.817 0.728 0.822 0.679 1 0.258 0.363 0.144 -0.261 0.656
As 0.097 0.925 0.766 0.711 0.587 0.607 0.258 1 0.678 -0.385 -0.826 0.129
Pb 0.490 0.539 0.612 0.889 0.236 0.104 0.363 0.678 1 0.417 -0.170 0.747
Cd 0.741 -0.463 -0.173 0.241 -0.422 -0.614 0.144 0.385 0.417 1 0.805 0.782
pH 0.353 -0.897 -0.689 -0.379 -0.753 -0.855 -0.261 -0.826 -0.170 0.805 1 0.286
OM 0.939 0.165 0.479 0.771 0.208 -0.012 0.656 0.129 0.747 0.782 0.286 1
Table 5. Pearson’s correlation coefficient between the pH, organic matter (OM) and heavy metals in dumpsite-3
Heavy Cr Mn Co Fe Ni Cu Zn As Pb Cd pH OM
metal
Cr 1 -0.127 0.314 -0.472 -0.158 0.035 -0.371 -0.853 0.137 -0.502 0.330 -0.502
Mn -0.127 1 0.877 0.518 0.832 -0.477 -0.630 0.151 -0.746 0.794 0.809 0.662
Co 0.314 0.877 1 0.115 0.587 -0.620 -0.884 -0.115 -0.780 0.424 0.810 0.265
Fe -0.472 0.518 0.115 1 0.867 0.424 0.333 0.031 0.096 0.918 0.537 0.981*
Ni -0.158 0.832 0.587 0.867 1 0.090 -0.152 -0.118 -0.255 0.933 0.868 0.915
Cu 0.035 -0.477 -0.620 0.424 0.090 1 0.865 -0.508 0.939 0.032 -0.049 0.240
Zn -0.371 -0.630 -0.884 0.333 -0.152 0.865 1 -0.041 0.869 -0.030 -0.458 0.165
As -0.853 0.151 -0.115 0.031 -0.118 -0.508 -0.041 1 -0.495 0.223 -0.450 0.132
Pb 0.137 -0.746 -0.780 0.096 -0.255 0.939 0.869 -0.495 1 -0.307 -0.321 -0.100
Cd -0.502 0.794 0.424 0.918 0.933 0.032 -0.030 0.223 -0.307 1 0.645 0.978*
pH 0.330 0.809 0.810 0.537 0.868 -0.049 -0.458 -0.450 -0.321 0.645 1 0.597
OM -0.502 0.662 0.265 0.981* 0.915 0.240 0.165 0.132 -0.100 0.978* 0.597 1
Page 10 / 18 http://eaht.orgEze et al. | Identification of Heavy Metals Source within Selected Active Dumpsites
Table 6. Pearson’s correlation coefficient between the pH, organic matter (OM) and heavy metals in dumpsite-4.
Heavy Cr Mn Co Fe Ni Cu Zn As Pb Cd pH OM
metal
Cr 1 0.898 0.378 0.537 0.824 0.748 0.192 0.616 0.608 -0.006 -0.384 0.884
Mn 0.898 1 0.329 0.459 0.495 0.891 0.603 0.761 0.767 0.431 -0.441 0.593
Co 0.378 0.329 1 0.983* 0.241 -0.136 0.119 -0.361 -0.351 -0.148 -0.971* 0.242
Fe 0.537 0.459 0.983* 1 0.397 0.005 0.114 -0.224 -0.217 -0.168 -0.950* 0.406
Ni 0.824 0.495 0.241 0.397 1 0.378 -0.396 0.301 0.275 -0.546 -0.115 0.993**
Cu 0.748 0.891 -0.136 0.005 0.378 1 0.597 0.973* 0.975* 0.547 -0.002 0.483
Zn 0.192 0.603 0.115 0.114 -0.396 -0.597 1 0.533 0.564 0.959* -0.354 -0.284
As 0.616 0.761 -0.361 -0.224 0.301 0.973* 0.533 1 0.999** 0.548 0.225 0.4
Pb 0.608 0.767 -0.351 -0.217 0.275 0.975* 0.564 0.999** 1 0.578 0.207 0.376
Cd -0.006 0.431 -0.148 -0.168 -0.546 0.547 0.959* 0.548 0.578 1 -0.094 -0.441
pH -0.385 -0.441 -0.971* -0.950* -0.115 -0.002 -0.354 0.225 0.207 -0.094 1 -0.142
OM 0.884 0.593 0.242 0.406 0.993** 0.483 -0.284 0.4 0.376 -0.441 -0.142 1
**Correlation is significant at the 0.01 level (2-tailed)
*Correlation is significant at the 0.05 level (2-tailed)
Table 7 Principal component (PC) loadings (varimax-normalized) for experimented variables in the soil samples in
dumpsites-1 and 2.
Dumpsite-1 PC1 PC2 Dumpsite-2 PC1 PC2 PC3
Cr 0.994 0.033 Cr 0.184 0.983 -0.007
Mn 0.943 0.324 Mn 0.74 -0.079 0.667
Co 0.992 0.112 Co 0.793 0.292 0.535
Fe 0.968 0.067 Fe 0.441 0.563 0.699
Ni 0.521 -0.826 Ni 0.973 0.106 0.207
Cu 0.089 0.995 Cu 0.976 -0.119 0.185
Zn 0.267 0.963 Zn 0.766 0.641 0.042
As 0.172 0.984 As 0.434 -0.174 0.884
Pb 0.137 0.989 Pb 0.004 0.505 0.863
Cd -0.8 -0.472 Cd -0.524 0.852 -0.012
pH 0.749 0.636 pH -0.726 0.492 -0.481
OM 0.602 -0.153 OM 0.044 0.95 0.31
Eigen values 7.049 4.028 Eigen values 6.738 3.911 1.351
% total variance 58.738 33.569 % total variance 56.153 32.588 11.259
Cumulative % 58.738 92.307 Cumulative % 56.153 88.741 100
1 The first component The second component The third component
2 3
Principal component analysis (PCA)
PCA in dumpsite-1 revealed two major components (factors) with eigenvalues > 1 and 92.307% of the total
variance, which was very good and can be relied upon to identify the origin of the heavy metals in the studied dumpsite
soils. The first principal component (PC1) contributed 58.738% of the total variance with strong positive loadings on Cr, Mn,
Co, Fe and pH; moderately positively loaded with Ni and OM, but strong negative loading on Cd. The dominant factor
loading of Cr strongly suggests that the origin of Cr could be attributed to wastes from organic pigments in plastics and
scrap metals in the dumpsite soil. Cr correlates with Co and Fe which indicates that they are from the same source. The
second principal component (PC2) contributed 33.569 % of the total variance with strong positive loading on Cu, Zn, As, Pb;
strong negative loading on Ni, but moderately positively loaded with pH. The dominant factor loading of Cu in PC2 strongly
http://eaht.org Page 11 / 18Environmental Analysis Health and Toxicology 2021, 36(2):e2021008
suggests that the origin of Cu could be attributed to wastes from scrap metals in the dumpsite soil. Also, in dumpsite-1, Cu
significantly correlates with Zn, As and Pb which indicates that their source could be the same. PCA in dumpsite-2 (Table
7) revealed three major components (factors) with eigenvalues > 1 and 100.000% of the total variance. These components are
related to the source of metals in the dumpsite soils. PC1 with 56.153% of total variance comprises Mn, Co, Ni, Cu and Zn
with significantly high loadings. Significantly high negative loading and moderate negative loading were also recorded for
pH and Cd respectively. The dominant factor loading of Cu in PC1 strongly suggests that the origin of Cu could be attributed
to wastes from scrap metals in the dumpsite soil. Cu significantly correlates with Ni which indicates that their origin could
be the same. PC2 contributed 32.588% of total variance with strong loading on Cr, Cd and OM; moderately positively loaded
with Fe, Zn and Pb. The dominant factor loading of Cr in PC2 strongly suggests that the origin of Cr could be attributed to
wastes from organic pigments in plastics and scrap metals in the dumpsite soil. The third component (PC3) explained 11.259%
of total variance with significantly high loadings on As and Pb; but moderately positively loaded with Mn, Co and Fe. The
dominant factor loading of As in PC3 strongly suggests that the origin of As could be attributed to wastes from organic
pigments in plastics in the dumpsite soil. The results obtained for PCA in dumpsite-1 is shown in Table 7.
Results obtained for PCA in dumpsites-3 and 4 are shown in Table 8. The results obtained from PCA in dumpsite-
3 after varimax orthogonal rotation revealed three principal components with eigenvalues ˃ 1 and 100.000% of the total
variance. The first principal component (PC1) in the data set explains 47.861% of the total variance and is strongly positively
loaded with Mn, Fe, Ni, Cd, OM and pH. The dominant factor loading of OM strongly suggests that the origin of OM could
be attributed to the presence of a high quantity of biodegradable waste materials domiciled in the dumpsite. The high OM
content of dumpsite soils encourages cultivation on dumpsite soils by local farmers which poses health risks to humans
along the food chain. Fe and Cd correlate with OM which could be attributed to wastes from decomposing rice husk and
rice bran that accumulated on the studied dumpsite soils. Carr et al. [13] reported that soil OM is one of the most important
factors that control the accumulation, mobility and bioavailability of heavy metals in soils. Also, OM content in soils can
lead to elevated soil adsorption capacity which enhances the accumulation of heavy metals [14]. Poorly drained soils with
pH ranges from 4–7 are prone to Fe toxicity [27]. PC2 contributed 31.319% of total variance with significant positive loading
on Cu, Zn and Pb; significant and moderate negative loading on Co and Mn respectively. The dominant factor loading of
Zn in PC2 strongly suggests that the origin of Zn could be attributed to wastes from incinerated rice husk and bran in the
dumpsite soil. PC3 accounted for 20.820% of total variance with significant loading on Cr; moderate positive and significant
negative loading on pH and As respectively. The dominant factor loading of Cr in PC3 strongly suggests that the origin of
Cr could be attributed to wastes from incinerated rice husk and bran in the dumpsite soil. Udosen [27] further reported that
Cr is considered a serious environmental pollutant although its distribution in plants does not only depend on soil pH, OM
and heavy metals concentration. PCA in dumpsite-4 (Table 8) revealed three PCs with eigenvalues > 1 and 100.000% of the
total variance. PC1 contributed 45.874% of the total variance with strong positive loadings on Mn, Cu, Zn, As and Pb;
moderately positively loaded with Cr and Cd. The dominant factor loading of Cu in PC1 strongly suggests that the origin
of Cu could be attributed to wastes from scrap metals in the dumpsite soil. Cu significantly correlated with As and Pb which
indicates that their origin is the same. Also, Zn significantly correlated with Cd which suggests that both are from the same
source. Chen et al. [29] reported that Zn and Cd always occur in a combined state and are very toxic to the ecosystem even
at very low concentrations. PC2 contributed 31.909% of the total variance with significant positive loading on Co and Fe and
strong negative loading on pH. The dominant factor loading of Co in PC2 strongly suggests that the origin of Co could be
attributed to wastes from organic pigments in plastics and scrap metals in the dumpsite soil. The negative correlation
(inverse correlation) which was observed at Fe / pH and Co / pH indicated that as the available Co and Fe contents of the
soil increase, the pH of the soil decreases. Eze et al. [28] noted that soil pH has a significant impact on the migration and
biological effects on Fe and Co in the soil. PC3 contributed 22.216% of the total variance with strong loading on Ni and OM;
moderately positively loaded with Cr, moderately negatively loaded with Zn and significantly negatively loaded with Cd.
The dominant factor loading of Ni in PC3 strongly suggests that the origin of Ni could be attributed to wastes from organic
pigments in plastics and scrap metals in the dumpsite soil. A positive correlation was observed between Ni and OM which
indicated that the high OM content of the soil influenced the accumulation, mobility and bioavailability of Ni in the studied
dumpsite soil. Zn correlation with Cd suggested that they are from the same anthropogenic source. The origin of Zn and
Cd could be associated with municipal solid wastes from plastics, scrap metals, inorganic chemicals, Cd-Ni battery, roofing
materials, discarded automobile spare parts, pulp and paper in the dumpsites. Furthermore, this study revealed an inverse
relationship of Co / pH and Fe / pH in the studied dumpsite soil. The obtained results demonstrate that statistical procedures
can be a strong tool for classifying the metals as groups in terms of relationship with soil properties and identifying their
probable origin in soil.
Hierarchical Cluster Analysis (HCA)
HCA was used also to find groups among metal based on SED [32,33]. The cluster plots for heavy metals in soils
from the different dumpsites are presented in Figures 3a-d. In dumpsites 1 (Figure 7a), three groups were identified. In
Page 12 / 18 http://eaht.orgEze et al. | Identification of Heavy Metals Source within Selected Active Dumpsites
group 1, the combination includes Mn, Co, Ni, Cr, Cd, As, Pb and Zn. In group 2, the combination includes Cu while in
group 3 is Fe. This showed that metals in the first group might have originated from mixed anthropogenic and geogenic
sources including organic pigments in plastics, atmospheric deposition and incinerated biodegradable wastes while metals
in groups 2 and 3 are from human activities, mainly from waste dumped containing scrap metals in the area. A similar
observation was also made for dumpsite 2 (Figure 7b), showing Fe belonging to group 3. In dumpsites 3 (Figure 7c) and 4
(Figure 3d), two groups (1 and 2) were identified. Again, Fe showed dissimilarities from other heavy metals, placed in group
2, suggesting that there is a specific source of these pollutants in these dumpsites related to scrap metals and slightly from
geogenic sources. A similar result was reported by Ebong et al. [15] for a dumpsite soil in Calabar. Worthy of note is that
the waste materials in the studied dumpsite soils could have influenced the levels of Mn, Co, Ni, Cr, Cd, As, Pb, Cu, Fe and
Zn.
Table 8 Principal component (PC) loadings (varimax-normalized) for experimented variables in the soil samples in
dumpsite-3 and 4.
Dumpsite-3 PC1 PC2 PC3 Dumpsite-4 PC1 PC2 PC3
Cr -0.327 -0.153 0.933 Cr 0.649 0.391 0.652
Mn 0.727 -0.687 0.006 Mn 0.87 0.418 0.26
Co 0.396 -0.855 0.335 Co -0.131 0.984 0.12
Fe 0.957 0.258 -0.129 Fe -0.014 0.966 0.259
Ni 0.973 -0.18 0.142 Ni 0.205 0.155 0.966
Cu 0.226 0.936 0.27 Cu 0.982 -0.03 0.187
Zn 0.055 0.974 -0.219 Zn 0.734 0.293 -0.612
As -0.028 -0.257 -0.966 As 0.954 -0.259 0.15
Pb -0.124 0.958 0.26 Pb 0.963 -0.242 0.118
Cd 0.966 -0.135 -0.222 Cd 0.695 0.029 -0.718
pH 0.74 -0.389 0.549 pH -0.042 -0.998 0.05
OM 0.98 0.072 -0.183 OM 0.32 0.175 0.931
Eigen values 5.743 3.758 2.498 Eigen values 5.505 3.829 2.666
% total variance 47.861 31.319 20.82 % total variance 45.874 31.909 22.216
Cumulative % 47.861 79.18 100 Cumulative % 45.874 77.784 100
1 The first component 2The second component 3The third component
http://eaht.org Page 13 / 18Environmental Analysis Health and Toxicology 2021, 36(2):e2021008
(a)
(b)
Page 14 / 18 http://eaht.orgEze et al. | Identification of Heavy Metals Source within Selected Active Dumpsites
(c)
(d)
Figure 7. Hierarchical cluster plots of heavy metals in soils from the different dumpsites
http://eaht.org Page 15 / 18Environmental Analysis Health and Toxicology 2021, 36(2):e2021008
Analysis of variance (ANOVA)
ANOVA revealed that the p-value for the heavy metals is 0.000 which is less than 0.05. This implies that the effects
of the heavy metals on the studied dumpsite soils are significant, hence the need for multiple comparison tests. The data
obtained was subjected to multiple comparisons test and the result showed that the p-value for the studied dumpsite soils
is 0.441 which is greater than 0.05. This implies that the dumpsite soils are independent of the effects of heavy metals. Besides,
the Least Significant Difference (LSD) revealed that Fe was the predominant heavy metal among the metals present in the
studied dumpsites. It can be concluded that the Fe content explains the majority of the variations in the concentration of
heavy metals from the studied dumpsites. This was in contrast to the findings reported by Ebong et al. [15] where OM
content explained the majority of the variations in the concentration of heavy metals from the studied sites.
Conclusion
This research has revealed the extent of heavy metals accumulation in the studied dumpsite soils in Southeastern
Nigeria and the inter-relationship among the parameters assessed. The concentration of the heavy metals in the studied
dumpsite soils were significantly higher than the maximum permissible limits of heavy metals for Nigerian soils. Using
ANOVA, it was discovered that the dumpsite soils studied were independent of the effects of the heavy metals. ANOVA
also revealed that Fe was the predominant heavy metal among the studied dumpsite soils after comparison with other heavy
metals using their LSD. CA was used to quantitatively analyze and confirm the significant relationship among soil
parameters (pH and OM) and heavy metals concentration among the studied dumpsite soils. PCA and HCA were adopted
to assist in the interpretation of elemental data. This method reduced the dataset into major components/groups
representing the different sources of the metals. However, the origin of these heavy metals in the studied dumpsite soils has
been attributed to wastes from organic pigments in plastics, scrap metals and incinerated biodegradable wastes. This study
generally concludes that statistical methods can be a strong tool for monitoring heavy metals accumulation, origin and may
assist in predicting future soil pollution posed by human activities as well as its mitigation.
Acknowledgements
This work was part of an M.Sc research project submitted to the Department of Pure and Industrial Chemistry, Faculty of
Physical Sciences, Nnamdi Azikiwe University, Awka, Nigeria.
Conflicts of interest
The authors declare no conflicts of interest regarding the publication of this manuscript.
CRediT author statement
VI: Conceptualization, Visualization, Software, and Supervision; VC: Methodology, Data curation, Writing- Original draft
preparation, Investigation, Writing- Reviewing and Editing.
ORCID
Victor Chukwuemeka Eze: 0000-0001-9586-5741
References
[1] Goorah SS, Esmyot ML, R Boojhawon. The health impact of non-hazardous solid waste disposal in a community:
The case of the mere chicose landfill in Mauritius. J Environ Health 2009;72(1):48-54.
[2] Eze VC, Ndife CT, Muogbo MO. Carcinogenic and non-carcinogenic health risk assessment of heavy metals in
Njaba River, Imo State, Nigeria. Braz J Anal Chem; 2021
[3] Nubi OA, Osibanjo O, Nubi TA. Impact assessment of dumpsite leachate on the qualities of surface water and
sediment of River Eku, Ona-ara Local Government, Oyo State, Nigeria. Sci World J 2009;3(3):17-20.
[4] Obasi NA, Akubugwo EI, Ugbogu OC, Chinyere GC. Heavy metals bioavailability and phyto-accumulation
potentials of selected plants on burrow-pit dumpsites in Aba and Ntigha dumpsites in Isiala Ngwa of Abia State,
Nigeria. Niger J Biochem Mol Biol 2012;27(1):27-45.
[5] Ebong GA, Etuk HS, Johnson AS. Heavy metals accumulation by Talinumtriangulare grown on waste dumpsites
in Uyo metropolis, Akwa Ibom State, Nigeria. J Applied Sci 2007;7(10):1404–1409.
[6] Soffianian A, Madani ES, Arabi M. Risk assessment of heavy metal soil pollution through principal components
analysis and false color composition in Hamadan Province, Iran. Environ Syst Res 2014;3(1):1-14.
[7] United Nations Industrial Development Organization, (UNIDO). Industrial Environmental Policy and Strategy for
Ethiopia, Volume 2(draft), EPA/UNIDO, Addis Ababa; 2001.
Page 16 / 18 http://eaht.orgEze et al. | Identification of Heavy Metals Source within Selected Active Dumpsites
[8] United Nations Environment Programme (UNEP). Waste characterization and quantification with projections for
the future. In: United Nations Environment Programme (UNEP), editor. Developing integrated solid waste
management plan training manual, vol.1 International Environmental Technology; 2009.
[9] Coskun M, Steiness E, Coskun M, Cayir A. Comparison of epigeic moss (Hypnumcupressiforme) and lichen
(cladoniarangiformis) as biomonitor species of atmospheric metal deposition. Bull Environ Contam Toxicol
2009;82(1):1-5.
[10] Elaigwu SE, Ajibola VO, Folaranmi FM. Studies on the impact of municipal waste dump on surrounding soil and
air quality of two cities in Northern Nigeria. J Applied Sci 2007;7(3):421-425.
[11] Acosta JA, Faz A, Martínez-Martínez S, Zornoza R, Carmona DM, Kabas S. Multivariate statistical and GIS-based
approach to evaluate heavy metals behaviour in mine sites for future reclamation. J Geochem Explor 2011;109(1-
3):8–17.
[12] Qishlaqi A, Moore F, Forghani G. Characterization of metal pollution in soils under two land use patterns in the
Angouran region, NW Iran; a study based on multivariate data analysis. J Hazard Mater 2009;172(1):374–384.
[13] Carr R, Zhang CS, Moles N, Harder M. Identification and mapping of heavy metal pollution in soils of a sports
ground in Galway City, Ireland, using a portable XRF analyser and GIS. Environ Geochem Health 2008;30(1):45–
52.
[14] Qishlaqi A, Moore F. Statistical Analysis of Accumulation and Sources of Heavy Metals Occurrence in Agricultural
Soils of Khoshk River Banks, Shiraz, Iran. Am Eurasian J Agric Environ Sci 2007;2(5):565-573.
[15] Ebong GA, Dan EU, Inam E, Offiong NO. Total concentration, speciation, source identification and associated
health implications of trace metals in Lemna dumpsite soil, Calabar, Nigeria. J King Saud Univ Sci 2019;31(4):886-
897.
[16] Yuan GL, Sun TH, Han P, Li J, Lang XX. Source identification and ecological risk assessment of heavy metals in
topsoil using environmental geochemical mapping: Typical urban renewal area in Beijing, China. J Geochem
Explor 2014;136:40–47.
[17] Eze VC, Onwukeme V, Enyoh CE. Pollution status, ecological and human health risks of heavy metals in soil from
some selected active dumpsites in Southeastern, Nigeria using energy dispersive X-ray spectrometer. Int J Environ
Anal Chem 2020;1-22.
[18] Onweremadu EU, Okereke-Ejiogu EN. Soil Fertility Indicators low-input Agriculture in Communities of South
Eastern Nigeria. Greener J Agric Sci 2012;2(7):311-315
[19] Akobundu, AN, Nwankwoala HO. Evaluation of heavy metal in soils from Enyimba dumpsite in Aba, southeastern
Nigeria using contamination factor and geo-accumulation index. Energy Environ Res 2013;3(1):125.
[20] Momoh SO, Mgbemena CO, Agbadua SA, Matthew DO. The Physicochemical effect of leachates on groundwater
within Okpuno-Egbu Umudim dumpsite Nnewi, Anambra state Nigeria. DIUJST 2013;8
[21] Emereibeole EI, Ononibaku IF, Ejiogu CC, Ebe TE. Assessment of the Levels of Some Heavy Metals in Soils Around
the Nekede Dumpsite in Owerri, Nigeria. FUTOJNLS 2017;3(1):131-137
[22] Justin OK, O AG, Benjamin N. Estimation and characterization of municipal solid waste in Nekede landfill, Owerri
metropolis, Nigeria. IJEAS 2018;5(3):257249
[23] Guthrie JM, Ferguson JR. Overview of X-ray Fluorescence: University of Missouri Research Reactor – Columbia.
[cited May 5, 2021]. Available from: https://archaeometry.missouri.edu/xrf_technical.html
[24] Yahaya MI, Mohammad S, Abdullahi BK. Seasonal variations of heavy metals concentration in abattoir dumping
site soil in Nigeria. J Appl Sci Environ Manage 2009;13(4):9–13
[25] National Environmental Standards and Regulations Enforcement Agency (NESREA). 1st Eleven Gazetted
Regulations Federal Republic of Nigeria Official Gazette [cited May 5, 2021]. Available from:
https://www.nesrea.gov.ng/publications-downloads/laws-regulations/
[26] Food and Agriculture Organization of the United Nations (FAO) / World Health Organization (WHO). Codex
alimentarius commission. Food additives and contaminants. Joint FAO/WHO Food Standards Programme
Available from: www.transpaktrading.com/static/pdf/research/ achemistry/introTofertilizers.
[27] Udosen ED. Concepts in Environmental Chemistry. Anikzo Global Ventures; 2015, 156-171.
[28] Eze VC, Enyoh CE, Ndife CT. Soil Cationic Relationships, Structural and Fertility Assessment within selected active
dumpsites in Nigeria, Chemistry Africa; 2020, 1-10
[29] Chen X, Xia XH, Zhao Y, Zhang P. Heavy metal concentrations in roadside soils and correlation with urban traffic
in Beijing, China. J Hazard Mater 2010;181(1-3):640–646.
[30] Li G, Lu N, Wei Y, Zhu D. Relationship between Heavy Metal Content in Polluted Soil and Soil Organic Matter and
pH in Mining Areas. IOP Conf Ser Mater Sci Eng 2018;394(5):052081
[31] Franco-Uría A, López-Mateo C, Roca E, Fernández-Marcos ML. Source identification of heavy metals in
pastureland by multivariate analysis in NW Spain. J Hazard Mater 2009;165(1-3):1008–1015.
[32] Bates RG. Electromeric pH determinations. John Willey and sons Inc; 1954.
http://eaht.org Page 17 / 18Environmental Analysis Health and Toxicology 2021, 36(2):e2021008
[33] Association of Official Analytical Chemists (AOAC). Official Methods of Analysis. 11th ed. Association of
Analytical Chemists; 1984, 249−252.
[34] Verla EN, Verla AW, Enyoh CE. Finding a relationship between physicochemical characteristics and ionic
composition of River Nworie, Imo State, Nigeria. PeerJ Analytical Chemistry, 2020;2(5):1-22.
[35] Enyoh CE, Isiuku BO. Characterization of Soils from Floodbasin in Amakohia, Owerri, Nigeria. Int J Environ Anal
Chem. 2020;1-20.
[36] Duru CE, Enyoh CE, Enedoh MC, Duru IA, Ibe FC, Verla AW, et al. Assessment of Heavy Metals in Soils from
Reclaimed Section of Nekede Mechanic Village, Owerri, Southeastern, Nigeria. Chemistry Africa 2021;1-13.
Page 18 / 18 http://eaht.orgYou can also read