Determining the effect of exogenous organic materials on spatial distribution of maize yield
←
→
Page content transcription
If your browser does not render page correctly, please read the page content below

www.nature.com/scientificreports

            OPEN           Determining the effect of
                           exogenous organic materials on
                           spatial distribution of maize yield
                           Bogusław Usowicz* & Jerzy Lipiec
                           Knowledge on spatial distribution of crop yield in relation to fixed soil fertilisation with exogenous
                           organic materials is essential for improving precise crop and soil management practices within a field.
                           This study assessed the effect of various application rates and types of exogenous (recycled) organic
                           materials (EOMs) containing different organic matter and nitrogen contents vs. mineral nitrogen on
                           the yield of maize by means of linear regressions (trends), spatial kriging-interpolated maps, and
                           Bland-Altman statistics. The experiments were conducted in 2013 and 2014 on two soils, i.e. loam
                           silt in Braszowice (Poland) and clay silt loam in Pusté Jakartice (Czech Republic) under a cross-border
                           cooperation project. The organic materials included compost from manure, slurry, and straw (Ag),
                           industrial organic compost from sewage sludge (Ra), animal meal from animal by-products (Mb),
                           and digestate from a biogas fries factory (Dg). The following 3 application rates of each EOM were
                           adjusted according to the reference 100% = 200 kg N ha−1: 50 (50% N from EOM and 50% mineral N),
                           75 (75% N from EOM and 25% mineral N), and 100 (100% N from EOM). 100% mineral N was applied on
                           control plots. All treatments were carried out in 4 replicates. The linear regressions between the EOM
                           application rates and the maize yield were in general ascending in the Braszowice soil and descending
                           in the more productive Pusté Jakartice soil. The spatial kriging-interpolated maps allowed separating
                           zones of lower and higher yields with EOMs compared to the control. They were attributed in part to
                           the different EOM application rates and soil water contents. The Bland-Altaman statistics showed that
                           addition of 50% of N from EOMs in 2013 caused a decrease and an increase in the maize grain yield in
                           Braszowice and Pusté Jakartice, respectively, whereas the inverse was true with the 75 and 100% EOM
                           additions. In 2014, the yield of maize for silage increased with the increasing EOM application rate in
                           Braszowice and decreased in Pusté Jakartice, but it was smaller on all EOM-amended plots than in the
                           control. As shown by the limits of agreement lines, the maize yields were more even in Pusté Jakartice
                           than Braszowice. These results provide helpful information for selection of the most yield-producing
                           EOM rates depending on the site soil conditions and prevalent weather conditions.

                           Soil organic matter (SOM) is a key factor affecting many ecosystem services including nutrient cycling that sup-
                           port crop production worldwide1–4. However, its content in soil decreases due to land-use change from natural
                           forest or perennial grasslands to cultivated croplands; then, it is frequently subjected to intensive soil disturbance
                           by conventional tillage practices3,5,6. It was reported that about 42 to 78 Gt of carbon were lost globally7 due to
                           tillage and narrow crop rotation without legumes and cover crops and enhanced biological decay and soil ero-
                           sion8,9. The loss of SOM from the topsoil of 20 cm due to soil disturbance and inadequate return of organic matter
                           within a 30–50-year time period has been assessed as high as 50%10. The rate of SOM loss is increasing with pro-
                           gressive warming related to climate change3,11. The total rate of biomass and SOM losses is estimated to be up to
                           20% of worldwide atmospheric carbon dioxide emissions12,13. Therefore, the decline in SOM is considered as an
                           environmental threat and a soil degradation component, as specified in the Communication from the European
                           Commission “Thematic Strategy for Soil Protection”14.
                               To avoid further reductions and reverse the current SOM content, an international research 4 per mille ini-
                           tiative has been launched at the Conference of the Parties (COP21) in Paris meeting (2015), which requests to
                           increase carbon stocks at 4 per 1000 (or 0.4%) per year on agricultural lands to mitigate the SOM losses caused
                           by climate change and to increase food production for the rising world population while being environmentally

                           Institute of Agrophysics, Polish Academy of Sciences, ul. Doświadczalna 4, 20-290, Lublin, Poland. *email: b.usowicz@
                           ipan.lublin.pl

Scientific Reports |   (2019) 9:19883 | https://doi.org/10.1038/s41598-019-56266-5                                                             1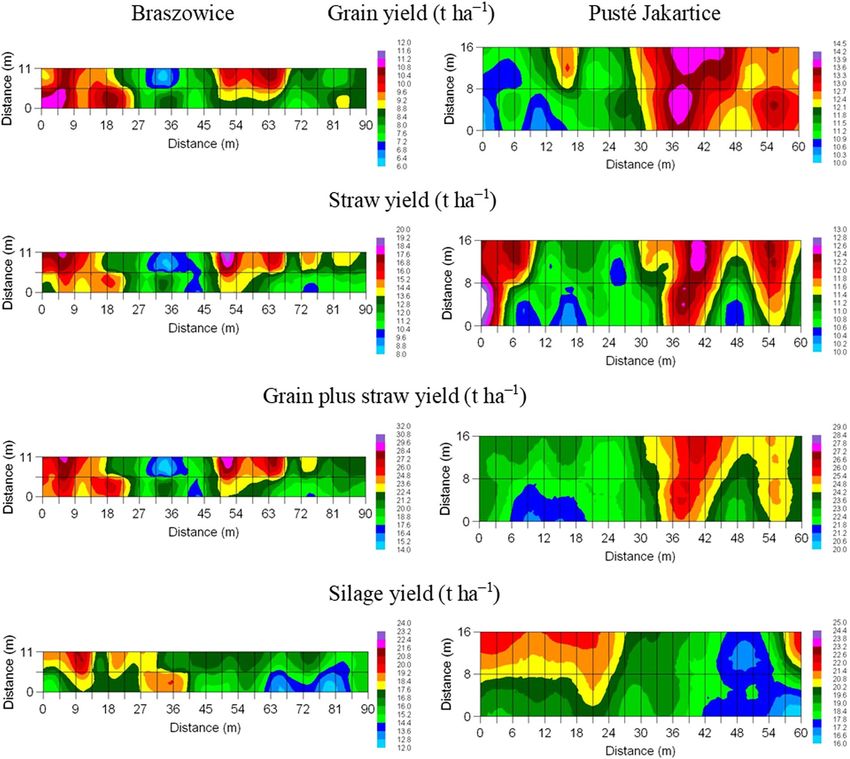
www.nature.com/scientificreports/                                                               www.nature.com/scientificreports

                           sustainable9,15,16. This initiative is supported by the fact that the quality and productivity of the soil resources of
                           the Earth are deteriorating2.
                               One ecological management approach recommended to offset loss of SOM content and crop productivity is
                           site-specific application of exogenous (recycled) organic materials containing organic carbon and nutrients4,17,18.
                           Such materials can originate from waste products of agricultural, livestock, and biogas production systems.
                           The use of organic materials can allow farmers to diminish waste streams and application of less chemical
                           input-dependent and thus more sustainable soil management reducing reliance on high-price mineral fertilisers
                           and pesticides in crop production4,19,20.
                               Recent research based on meta-analysis of numerous experiments21 showed that finding the direct effect of
                           organic inputs on crop yields is difficult because of the additional effect on some environmental factors (e.g. flour-
                           ishing soil biota). The authors suggested more in-depth research to describe the crop yield response to organic
                           inputs more comprehensively. To separate direct effect of a given treatment the statistical Bland-Altman method
                           can be adopted. In this approach the differences between two treatments or methods are plotted against their
                           averages. The ensuing diagram allows determining average difference (bias), confidence of intervals for the bias
                           and limits of agreement that indicate how much the new treatment or method differ from the old. This approach
                           is used in biostatistics, medicine (e.g.22) and also in satellite studies23,24.
                               The aim of the work was (i) to determine the spatial variability and distribution of maize yield on soil fertilised
                           randomly with spatially different amounts of exogenous organic matter, (ii) to examine the effect of different
                           percentages of nitrogen from exogenous organic materials vs. conventional mineral nitrogen fertiliser only on the
                           maize yield using Bland-Altman statistics, and (iii) to identify areas for improving the maize yield with consider-
                           ation of site conditions. It was hypothesised that the Bland-Altman statistics distinguishes the effect of different
                           portions of nitrogen from exogenous organic materials on the maize yield.

                           Materials and Methods
                           A field experiment was carried out on loamy silt soil in Braszowice, Poland (50° 34′ 03.0″N 16° 48′ 07.4″E),
                           and clay silt loam in Pusté Jakartice, Czech Republic (49° 58′ 23.5″N 17° 57′ 19.8″E), in 2013 and 2014 under a
                           cross-border cooperation project25,26. The soils contain 14 and 20% of clay and 1.02 and 1.13% of organic carbon,
                           respectively. Both field sites are located about 140 km apart from each other. The experimental field in each site
                           received 10 treatments, i.e. 3 exogenous organic materials (EOMs) × 3 rates and the control, with digestate from
                           a biogas fries factory (Dg) in Braszowice, compost from manure, slurry, and straw (Ag) in Pusté Jakartice, and
                           industrial organic compost from sewage sludge (Ra) and animal meal from animal by-products (Mb) in both
                           fields. The following 3 application rates of each EOM were adjusted according to the reference 100% = 200 kg N
                           ha−1: 50 (50% N from EOM and 50% mineral N), 75 (75% N from EOM and 25% mineral N), and 100 (100% N
                           from EOM). 100% mineral N was applied on the control plots. The treatments were replicated in 4 blocks (A, B,
                           C, D), which gave forty plots. Each plot had a surface area of 20 m2 in Braszowice and 25 m2 in Pusté Jakartice. The
                           layout of the experments is shown in Fig. 1. The total nitrogen contents were 6.9, 2.6, 2.3, and 8.4% in Dg, Ag, Ra,
                           and Mb, respectively. The corresponding organic carbon contents were 40.7, 24.1, 17.9, and 40.1%. The Mb, Ra,
                           and Ag were applied twice in Pusté Jakartice. Ra and Dg were applied twice and Mb once in Braszowice. Instead
                           of phosphorus-containing Mb, a mineral N fertiliser was applied in the second study year in Braszowice to avoid
                           the possible risk of eutrophication.
                               A conventional tillage system including moldboard ploughing to a 25-cm depth was applied in both sites in
                           late autumn, followed by a cultivator (15 cm) and pre-sowing surface preparation with a harrow in spring to pre-
                           pare the seedbed. The EOMs were applied on the soil surface and then mixed into a 15-cm depth by a cultivator
                           before seedbed preparation and sowing maize (Zea mays L.). The variety N K Terada, FAO 260 was grown in 2013
                           for grain and Ulan-FAO 270 was cultivated in 2014 for silage in both sites. On each plot, maize was grown in
                           four rows and six rows in Braszowice and Pusté Jakartice, respectively. The maize was harvested by hand cutting
                           at a height of 10 cm from two central rows to determine the grain and straw yield in 2013 and the silage yield in
                           201427.
                               Basic statistics including the average, standard deviation, coefficient of variation, minimum and maximum
                           values, skewness, kurtosis, and linear regressions between the EOM application rates and the yield components
                           were calculated. Spatial dependence and distribution of the yield components were evaluated using geostatistical
                           methods. Experimental semivariograms were computed and then mathematical functions were adjusted to sem-
                           ivariograms that were used for mapping by ordinary kriging28,29.
                               In order to determine a separate effect of the different application rates of N from the EOMs vs. control plots
                           (only mineral nitrogen fertiliser) on the maize yield, the Bland-Altman statistics was adopted22,30. In this graph-
                           ical method, the differences in the maize yields between the plots with different EOM nitrogen application rates
                           and the control plots against the average yield with and without EOMs were determined. The agreement between
                           the yield in the EOM-amended and control plots was assessed using bias (average of differences between the
                           yields from the EOM-amended and control plots), the limit of agreement (LoA) defined as bias ± 1.96 × standard
                           deviation, confidence intervals (CI) for the bias and LoA defined as ± standard error × the value of t distribution
                           with n–1 degrees of freedom, and the Bland-Altman ratio (BAR) defined as the ratio of half the range of LoA to
                           the mean of the pair including the yield from the EOM-amended and mineral nitrogen fertilized plots. The agree-
                           ments were graded as good, moderate, and insufficient for BAR values < 0.1, 0.1–0.2, and >0.2, respectively22.
                           Root mean square residuals (RMSR) and maximum relative residuals (MRR), which are the difference in the yield
                           between the EOM-amended and control plots were determined for all yield components in 2013 (grain, straw,
                           and grain plus straw) and 2014 (silage yield).

                           Weather conditions. The average annual long-term air temperature in Braszowice was 8.2 °C and the sum of
                           precipitations was 568.9 mm. The corresponding values in Pusté Jakartice were 8 °C and 640 mm. In Braszowice,

Scientific Reports |   (2019) 9:19883 | https://doi.org/10.1038/s41598-019-56266-5                                                              2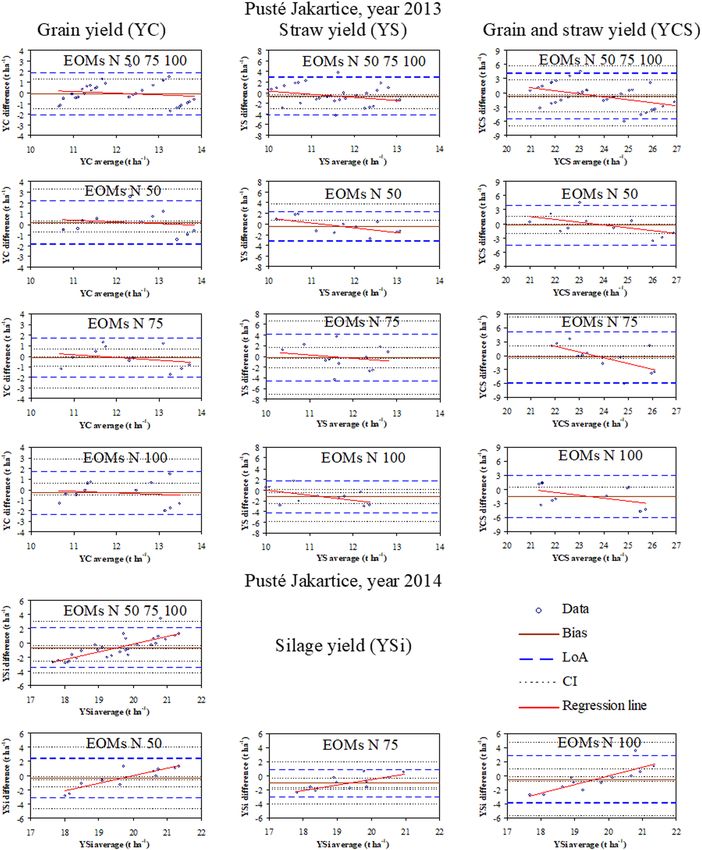
www.nature.com/scientificreports/                                                                  www.nature.com/scientificreports

                           Figure 1. Layout of the experimental plots at the research sites in Braszowice (Poland) and Pusté Jakartice
                           (Czech Republic). Explanations: initial capital letters A, B, C, and D refer to blocks (replicates) of the
                           experiment. 50 = 50% N from a given EOM and 50% mineral N, 75 = 75% N from a given EOM and 25%
                           mineral N, and 100 = 100% N from EOM, Control = 100% mineral N. Ag = compost from manure, slurry,
                           and straw, Ra = industrial organic compost from sewage sludge, Mb = animal meal from animal by-products,
                           Dg = digestate from the biogas fries factory. The maps of Poland and Czech are from wikipedia.org https://
                           pl.wikipedia.org/wiki/Plik:Poland_location_map_white.svg. Author Poland location map.svg: NordNordWest
                           (https://commons.wikimedia.org/wiki/User:NordNordWest). derivative work: Mareklug (https://commons.
                           wikimedia.org/wiki/User:Mareklug). Licence CC BY SA 3.0: https://creativecommons.org/licenses/by-sa/3.0/.
                           Author NordNordWest (https://commons.wikimedia.org/wiki/User:NordNordWest). Licence CC BY SA 3.0:
                           https://creativecommons.org/licenses/by-sa/3.0/.

                                                                                          Precipitation   Precipitation
                                                         T (°C)   Tmax (°C)   Tmin (°C)   (mm)            IV–IX (mm)
                            Kłodzko/Braszowice – 2013     7.81    11.93       3.54        624.8           459.1
                            Kłodzko/Braszowice – 2014     9.30    13.92       4.71        589.3           456.7
                            Ostrava/Mosnov – 2013         8.92    13.14       4.28        581.6           443.7
                            Ostrava/Mosnov – 2014        10.29    14.93       5.38        734.1           567.7

                           Table 1. Annual mean, maximum, and minimum temperatures and sums of precipitations as well as sums of
                           precipitations during the vegetation period (IV–IX) in Kłodzko – Braszowice (Poland) and Ostrava/Mosnov –
                           Pusté Jakartice (Czech Republic).

                           the mean annual temperature was lower than the long-term value by 0.4 °C in 2013 and by 1.1 °C in 2014. The
                           annual sum of precipitations in the successive years was higher by about 56 and 20 mm than the long-term aver-
                           age (Table 1), while the sum of precipitation during the growing season (April-September) in both years was
                           similar and amounted to about 460 mm. In Pusté Jakartice, the annual temperatures in 2013 and 2014 were higher
                           than the long-term average by 0.92 and 2.29 °C, respectively. The sum of precipitations was by 58 mm lower in
                           2013 and by 94 mm higher in 2014 than the long-term average. During the growing season (April-September),
                           the sum of precipitations was greater by 124 mm in 2014 than in 2013. The monthly distribution of the sum of
                           precipitations and average temperature are shown in Fig. 2.

                           Results
                           Exogenous organic materials. The organic carbon and nitrogen contents in the EOMs studied varied from
                           17.9% in Ra to 40.7% in Dg and from 2.3 in Ra to 8.4% in Mb, respectively. The ranges of variations of the water
                           content and bulk density were 0.046–0.865 m3 m−3 and 0.117–0.702 Mg m−3, respectively31. The highest (0.702
                           Mg m−3) and lowest (0.117 Mg m−3) bulk density were noted for Mb and Dg, respectively, whereas an oppo-
                           site result was found for the soil water content, namely the smallest value was exhibited by Mb (0.046 m3 m−3)
                           and the highest level was determined for Dg (0.865 m3 m−3). The intermediate values in the case of Ra and Ag for

Scientific Reports |   (2019) 9:19883 | https://doi.org/10.1038/s41598-019-56266-5                                                       3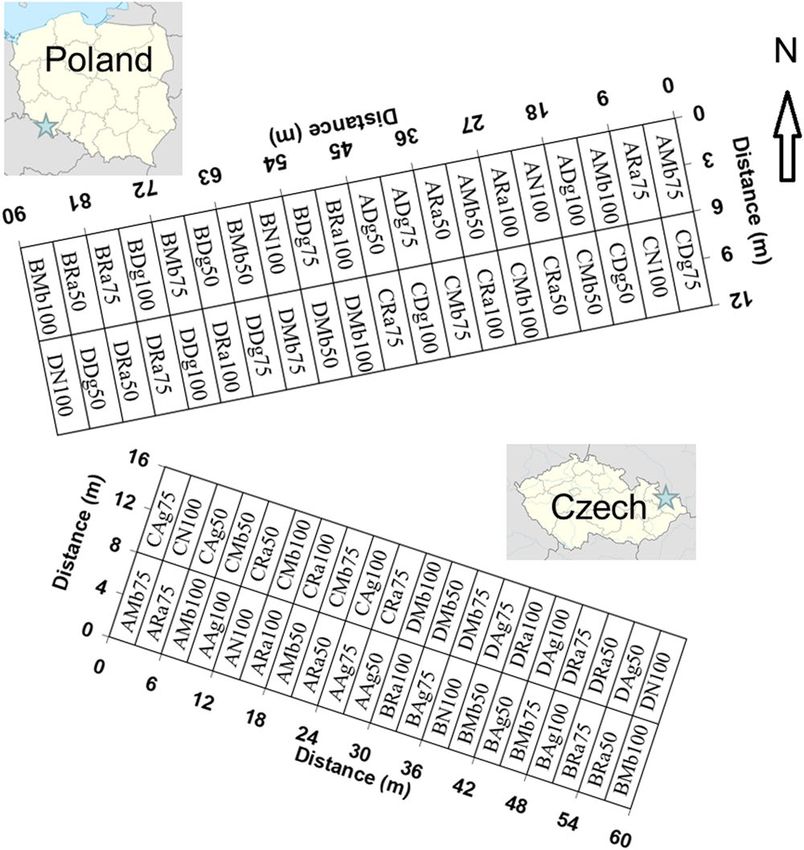
www.nature.com/scientificreports/                                                              www.nature.com/scientificreports

                           Figure 2. Monthly average temperatures and sums of precipitation in 2013 and 2014 in Kłodzko – Braszowice
                           (Poland) and Ostrava/Mosnov – Pusté Jakartice (Czech Republic).

                           Figure 3. Mean values with standard deviations and linear regression lines between the exogenous organic
                           mater material (EOM) application rates and the grain yield, straw yield, grain plus straw yield in 2013 and the
                           yield of silage maize in 2014 (successively from the left).

                           soil organic carbon, Ntot, water content, and bulk density were estimated at 17.9 and 24.1%, 2.3 and 2.6%, 0.258
                           and 0.225 m3 m−3, and 0.461and 0.655 Mg m−3, respectively.

                           Maize yield. The means and the minimum and maximum values of all yield components in both study years,
                           except for straw, in 2013 were greater in Pusté Jakartice than Braszowice (Table 2). The grain yield in Pusté
                           Jakartice in 2013 was higher by 37.5% than in Braszowice (10.07 t ha−1), while the straw yield was higher by
                           15.8% in Braszowice than in Pusté Jakartice (11.34 t ha−1). The yield of maize for silage in 2014 was higher in
                           Pusté Jakartice by 16.7% than in Braszowice (16.52 t ha−1). Irrespective of the yield component and study year,
                           the CV values ranged from 12.4 to 17.1% in Braszowice and from 7.5 to 9.7% in Pusté Jakartice. The asymmetry
                           (skewness) of the yield components was positive in Braszowice (0.087–0.294), whereas it varied in 2013 from pos-
                           itive 0.162 for the straw yield to negative −0.076 for the grain yield in Pusté Jakartice. The kurtosis ranged from
                           positive 0.418 to negative −0.186 in Braszowice and from positive 0.126 to negative −0.874 in Pusté Jakartice. The
                           skewness and kurtosis values indicate that the yield components were close to the normal distribution.
                               The effect of the increasing EOM application rate on the maize yield was related to the study site, year, and
                           yield component (Fig. 3). In Braszowice, the yield of both the maize grain and the straw yield displayed a general
                           ascending trend with the increasing EOM application rate. The most pronounced trend was noted for the com-
                           bined yield of grain and straw in 2013 and the least distinct trend was found for the silage yield in 2014 when the
                           yield remained almost the same at all EOM types and application rates. In Pusté Jakartice, however, the trends
                           were in general descending, irrespective of the study year and maize yield component.

                           Bland-A ltman plots.         The linear regressions discussed in the section above demonstrate a foremost ten-
                           dency to change the maize yields in response to the EOM addition. The use of Blant-Altman plots, however,
                           allowed determining the impact of the particular application rates of EOMs on the maize yield. Figures 4 and 5
                           show horizontal lines of bias, limits of agreement (LoA) along with confidence intervals (CI), and regression lines
                           intersecting or overlapping with bias lines. In general, the values of CI for bias were relatively small and consid-
                           erably greater with LoAs.
                               As indicated by the bias values (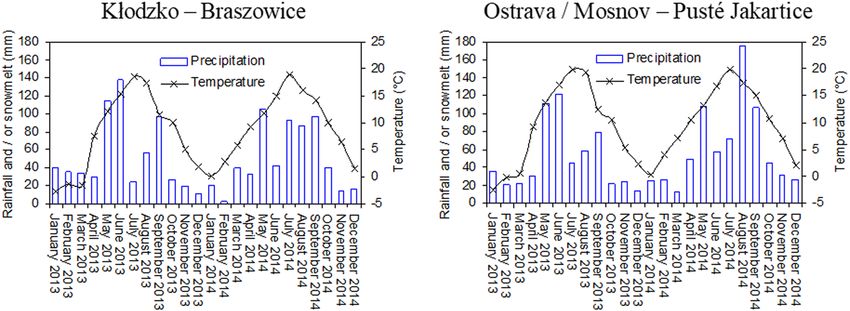
www.nature.com/scientificreports/                                                                        www.nature.com/scientificreports

                                             Grain            Grain yield at 14% Straw   Grain plus    Silage yield   Silage yield 2014
                            Statistics       yield            water content      yield   straw yield   2014           (dry mass)
                            n                40               40                40       40            40             40
                            Braszowice (yield, t ha−1)
                            Mean             8.83             10.07             13.13    21.96         45.49          16.52
                            SD               1.28             1.46              2.24     3.35          5.65           2.05
                            CV (%)           14.51            14.51             17.09    15.27         12.41          12.41
                            Minimum          5.64             6.43              8.64     14.28         33.60          12.20
                            Maximum          11.14            12.70             18.72    29.40         60.61          22.01
                            Skewnesss        0.087            0.087             0.294    0.121         0.112          0.112
                            Kurtosis         0.061            0.061             −0.186   −0.143        0.418          0.418
                            Pusté Jakartice (yield, t ha−1)
                            Mean             12.15            13.85             11.34    23.48         74.44          19.28
                            SD               1.10             1.26              1.10     1.75          6.49           1.68
                            CV (%)           9.07             9.07              9.71     7.47          8.71           8.71
                            Minimum          10.03            11.43             8.90     19.73         62.99          16.31
                            Maximum          14.13            16.11             13.75    27.88         87.14          22.57
                            Skewnesss        −0.076           −0.076            0.289    0.162         0.046          0.046
                            Kurtosis         −0.874           −0.874            0.126    0.068         −0.857         −0.857

                           Table 2. Maize yield components in 2013 and 2014 in Braszowice and Pusté Jakartice. (n – number of
                           sample; SD – Standard deviation; CV – Coefficient of variation. The silage dry matter contents were 36.31% in
                           Braszowice and 25.9% in Pusté Jakartice).

                           components increased with the increasing application rates from 75 to 100% N from EOMs (bias >0) and were
                           greater compared to the control. In 2014, as indicated by the bias (0) in contrast
                           to the other EOM application rates (Fig. 5). The straw and grain plus straw yields decreased with the increasing
                           EOM application rate (bias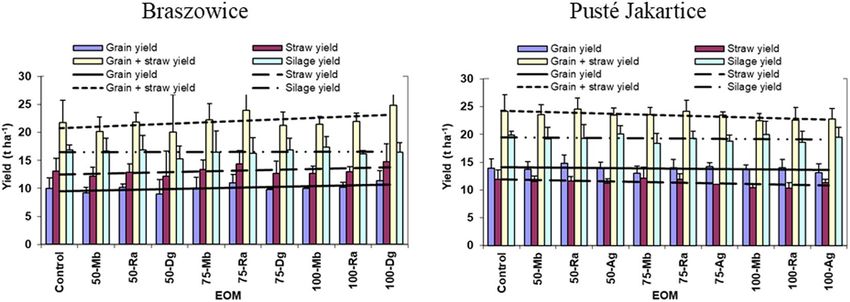
www.nature.com/scientificreports/                                                              www.nature.com/scientificreports

                           Figure 4. Bland-Altman plots for maize grain, straw, and grain plus straw yields in 2013 and silage yield in 2014
                           for all application rates of exogenous organic materials (EOMs) and for particular rates. Explanations: EOMs N
                           50 75 100 = all EOMs application rates as defined further, EOMs N 50 = 50% N from EOMs and 50% mineral N,
                           EOMs N 75 = 75% N from EOMs and 25% mineral N, and EOMs N 100 = 100% N from EOMs, bias line (Bias),
                           limits of agreement (LoA), confidence intervals (CI) for the bias and LoA.

                           Maps of maize yield.            As can be seen in Fig. 6, two distinct zones can be separated with similar yield
                           responses in both sites corresponding approximately to half the field length. These zones are from 0 to 45 m and
                           45 to 90 m in Braszowice and from 0 to 30 m and 30 to 60 m in Pusté Jakartice. Such separation can be related
                           to the random distribution of plots fertilised with different types and application rates of EOMs, which was the
                           same in both sites (Fig. 1). It is worth noting that the concentration of plots with the large doses of EOMs in some

Scientific Reports |   (2019) 9:19883 | https://doi.org/10.1038/s41598-019-56266-5                                                           6
www.nature.com/scientificreports/ www.nature.com/scientificreports
Figure 5. Bland-Altman plots for maize grain, straw, and grain plus straw yields in 2013 and silage yield in 2014
for all application rates of exogenous organic materials (EOMs) and for particular rates. Explanations: EOMs N
50 75 100 = all EOMs application rates as defined further, EOMs N 50 = 50% N from EOMs and 50% mineral N,
EOMs N 75 = 75% N from EOMs and 25% mineral N, and EOMs N 100 = 100% N from EOMs, bias line (Bias),
limits of agreement (LoA), confidence intervals (CI) for the bias and LoA.
areas influences the crop yield differently in particular sites. For example, the impact of 3 out of the 4 plots with a
100% N from EOMs in the lower part of the field on the maize yield is positive from 9 to 27 m in Braszowice and
negative from 6 to 18 m in Pusté Jakartice. Another example is the smaller maize yield in the area with greater N
levels from EOMs from 42 to 54 m in the lower part of the field both in 2013 and 2014 in Pusté Jakartice. In turn,
Scientific Reports | (2019) 9:19883 | https://doi.org/10.1038/s41598-019-56266-5 7www.nature.com/scientificreports/ www.nature.com/scientificreports
Maize yield (t ha−1)
Statistics Grain Straw Grain plus straw Silage
Braszowice
RMSR (t ha−1) 1.804 3.153 4.781 2.388
MRR (%) 53.8 76.8 67.1 40.1
BAR (−) 0.201 0.236 0.214 0.139
Pusté Jakartice
RMSR (t ha−1) 1.027 1.912 2.603 1.569
MRR (%) 23.5 38.5 21.8 18.6
BAR (−) 0.082 0.153 0.103 0.072
Table 3. Root mean square residuals (RMSR), maximum relative residuals (MRR), and Bland-Altman ratio
(BAR) of differences in the maize yield between the EOM-amended and control plots.
Parameters Model C0 C0+ C A (m) C0/(C0+ C) R2
Braszowice
Year 2013
Grain yield Sph. 0.367 1.762 18.6 0.208 0.407
Straw yield Sph. 0.240 5.259 17.0 0.046 0.309
Grain plus straw yield Sph. 0.590 11.89 17.7 0.050 0.309
Year 2014
Silage yield Sph. 1.352 4.181 31.3 0.324 0.507
Pusté Jakartice
Year 2013
Grain yield Sph. 0.116 1.970 43.7 0.059 0.941
Straw yield Sph. 0.589 1.228 13.3 0.480 0.619
Grain plus straw yield Sph. 1.200 4.006 31.3 0.300 0.895
Year 2014
Silage yield Sph. 0.550 5.070 50.0 0.108 0.956
Table 4. Semivariogram models and parameters for the maize yield (t ha−1) in 2013 and 2014 in Braszowice
and Pusté Jakartice. (Sph. – spherical, C0 – nugget, C0+ C – sill, A – effective range).
a larger yield was noted in the area from 18–30 m in the lower part in Pusté Jakartice, where plots with a dose of
50% N from EOMs dominated (Fig. 1). Mapping of maize yield can support variable application of nitrogen from
EOMs across the field.
Discussion
The regression lines (trends) showed that the maize yield tended to increase and decrease with the increasing
EOM application rate in Braszowice and Pusté Jakartice, respectively although the absolute yield was greater in
the latter (Fig. 2). This tendency was less pronounced in Pusté Jakartice. The greater and less variable absolute
maize yield in Pusté Jakartice than Braszowice can be related to the greater soil water content at most occasions,
as reported in the accompanying paper31 and thereby better water supply for maize. These differences in the soil
water content can be attributed in part to the greater water holding capacity in Pusté Jakartice (33.82 m3 m–3) than
Braszowice (31.80 m3 m–3)26 as a result of better soil aggregation and the presence of a greater number of earth-
worms that we observed during the field measurements. Both stabilize the pore structure and permit storage of
greater amounts of water in soil profile. Futhermore, more variable maize yield in the less productive Braszowice
than Pusté Jakartice soil can in part result from its greater sensitivity to changes in soil water content associated
with EOM application.
The study allowed identifying the specific benefits of three statistical approaches for description of maize yield
response to different levels of exogenous organic matterials. Classical statistics allowed to recognize the general
trends of the impact of exogenous organic matterials on yield based on mean values, dispersion, variability and
asymmetries in distribution and kurtosis. However, the use of geostatistical methods including semivariograms
and kriging-interpolated maps permitted delineating low-yielding sub-field areas on two soils of different agri-
cultural suitability under variable application of oxogenous organic matters. The Bland-Altman plot analysis
showed for the first time in what manner the partial and total replacement of readily available nitrogen from
the synthetic fertiliser with N from exogenous organic materials affected the maize yield in particular sites. In
Braszowice, a positive increase in the grain yield occurred only after the application of the larger doses of organic
N (75 and 100% N from EOMs). In turn, in the Pusté Jakartice soil, this was observed already after the addition
of the smallest dose, i.e. 50% N from EOMs. The less sensitive grain yield response to organic N in Braszowice
vs. Pusté Jakartice can be elucidated by the visually observed less friable structure in the former that diminishes
the ability of roots to grow and uptake water and nutrients33. The more efficient yield-producing effect of organic
N in Braszowice than Pusté Jakartice was also observed with the yield of silage maize. The different maize yield
Scientific Reports | (2019) 9:19883 | https://doi.org/10.1038/s41598-019-56266-5 8www.nature.com/scientificreports/ www.nature.com/scientificreports
Figure 6. Spatial distribution of maize yield in 2013 and 2014 in Braszowice and Pusté Jakartice.
response to the EOM application in Braszowice and Pusté Jakartice revealed by the Bland-Altman statistics is
in line with the spatial yield distribution on the kriging maps. The maps showed that, in areas with dominance
of plots amended with 100% N from the EOMs, the grain yield was larger in Braszowice and smaller in Pusté
Jakartice compared to the neighboring areas with the majority of plots amended with 50% N from EOMs. These
results are of practical importance, as they indicate that more organic N is required in the less productive soil with
poorer structure in Braszowice than Pusté Jakartice to increase the maize grain yield. They will help to develop
management strategy to reduce losses of the unused by crops nitrogen through volatilization and leaching into
the environment as well as farm input costs depending on environmental conditions. Recent studies (e.g.33,34)
have shown that nitrogen uptake and utilisation efficiency in maize can be influenced by tillage systems.
Review of the literature indicates that the effect of soil amendment with organic matter should be considered
not only with respect to crop production but together with the broader ecosystem services and benefits, including
carbon sequestration7,18,35, climate change mitigation and adaptation3,9, improvement of resistance to soil erosion
and soil compaction3,36,37, and better natural pest control4, which lead to reduced reliance on mineral N fertilisers
or other farm chemicals and lower environmental pollution4,38. Moreover, biological research on the same fields
as those used in this study showed that the addition of EOMs stimulated the activity of dehydrogenases and the
poorly explored microbial functional and genetic diversity in soil39. It also demonstrated that EOMs are not a
threat to the soil edaphone40 and concentration of carbon dioxide in the atmosphere41,42. Given the yield response
observed in the present study and the ecosystem benefits, precise application of the exogenous organic materials
offers an opportunity for sustainable crop production and environmental protection as well as proper manage-
ment of organic wastes from agricultural and biogas production systems.
The Bland-Altman plots also demonstrate that the regression lines of maize yield in 2013 were close to the bias
lines in both sites, while they increased with the increasing average yield from the EOM-amended and control
plots in 2014. These interannual differences may be related to the relatively high sum of precipitations in 2013
during intensive maize growth (May-June) than in the other period and during the later growth (July-September)
Scientific Reports | (2019) 9:19883 | https://doi.org/10.1038/s41598-019-56266-5 9www.nature.com/scientificreports/ www.nature.com/scientificreports
in 2014 in both places. This difference may have caused diversification of the spatial distribution of maize
yields through different spatial storage and redistribution of water depending on the EOM application rate.
Furthermore, the range of the limits of agreement (±1.96 SD lines) of the Bland-Altman plots for both the grain
and straw yield is about two times higher for Braszowice than Pusté Jakartice in both study years. This proves that
the soil in Pusté Jakartice creates more even growth conditions for plants than that in Braszowice. However, the
soil in Braszowice requires optimised and localised treatments to improve and smooth plant growth conditions.
Further studies are intended to assess the most yield-producing EOM rates under range of soil and weather con-
ditions and types of exogenous materials using the statistical methodology verified in this work.
Summary and Conclusions
The yield of maize in response to the application of four exogenous (recycled) organic materials (EOMs) at three
application rates was explored and assessed by means of linear regressions (trends), spatial kriging-interpolated
maps, and Bland-Altman statistics in two experiments. The regression trends of maize yield in general increased
with the increasing EOM application rate in Braszowice and decreased in the more productive Pusté Jakartice
soil. The spatial kriging-interpolated maps allowed delineating zones of lower and higher maize yields that were
related to the spatial distribution of the EOM application rates. The concentrations of plots with the large doses of
EOMs were in general reflected in the increased yield in Braszowice and the reduced yield in Pusté Jakartice. The
analysis of the Bland-Altaman statistics revealed that, in 2013, the effect of 50% N from EOMs on the maize yield
was negative and positive in Braszowice and Pusté Jakartice, respectively, whereas the inverse was true for the
additions of 75 and 100% N from EOMs. However, in 2014 characterised by a greater sum of precipitations during
the growing season, the increasing EOM application rate caused an increase and decrease in the maize silage yield
compared to the control plots in Braszowice and Pusté Jakartice, respectively. The limits of agreement showed
that the maize yield was more variable in Braszowice than in Pusté Jakartice. The study confirmed the hypothesis
that the use of the Bland-Altman method allows determining separate effects of various EOMs application rates
on the maize yield compared to the maize yield grown on plots fertilised only with mineral nitrogen. The results
will support precise adjusting the most yield-producing nitrogen rates from EOMs depending on the study site
conditions and weather conditions prevailing during growing season.
Received: 24 May 2019; Accepted: 4 December 2019;
Published: xx xx xxxx
References
1. Buttafuoco, G., Castrignanò, A., Cucci, G., Lacolla, G. & Lucà, F. Geostatistical modelling of within-field soil and yield variability for
management zones delineation: a case study in a durum wheat field. Precision Agriculture 18, 37–58 (2017).
2. Cherlet, M. et al. World Atlas of Desertification 3rd edition, http://wad.jrc.ec.europa.eu/ (2018).
3. EASAC (European Academies’ Science Advisory Council). EASAC Opportunities for soil sustainability in Europe. Policy report 36,
available at, www.easac.eu (2018).
4. Garratt, M. P. D. et al. Enhancing soil organic matter as a route to the ecological intensification of European arable systems.
Ecosystems 21, 1404–1415 (2018).
5. Murty, D., Kirschbaum, M. U. F., McMurtrie, R. E. & McGilvray, H. Does conversion of forest to agricultural land changes soil
carbon and nitrogen? A review of the literature. Glob Change Bio 8, 105–123 (2002).
6. Moreno, F., Murillo, J. M. & Madejón, E. Carbon losses under dryland conditions, tillage effects. eds. Gliński, J., Horabik, J. & Lipiec,
J. Encyclopedia of Agrophysics, Springer, Dordrecht, Heidelberg, London, New York, 108–109 (2011).
7. Lal, R. Soil carbon sequestration impacts on global climate change and food security. Science 304, 1623–1627 (2004).
8. Paustian, K. et al. Climate-smart soils. Nature 532, 49–57 (2016).
9. Minasny, B. et al. Soil carbon 4 per mille. Geoderma 292, 59–86 (2017).
10. Post, W. M. & Kwon, K. C. Soil carbon sequestration and land use change: processes and potential. Glob Change Biol 6, 317–327
(2000).
11. Griscom, B. W. et al. Natural Climate Solutions. Proceedings of the National Academy of Sciences 114, 11645–50 (2017).
12. Olivier, J. G. J., Janssens-Maenhout, G., Muntean, M. & Peters, J. A. H. W. Trends in global CO2 emissions: 2015 Report. PBL
Netherlands Environmental Assessment Agency, The Hague, PBL publication number: 1803, JRC Technical Note number: JRC98184,
http://edgar.jrc.ec.europa.eu/news_docs/pp, 80 (2015).
13. Zdruli, P., Lal, R., Cherlet, M. & Kapur, S. New World Atlas of Desertification and Issues of Carbon Sequestration, Organic Carbon
Stocks, Nutrient Depletion and Implications for Food Security. In Carbon Management, Technologies, and Trends in Mediterranean
Ecosystems. Springer International Publishing, 13–25 (2017).
14. COM/2006/0231 Final. Communication from the Commission to the Council, the European Parliament, the European Economic
and Social Committee and the Committee of the Regions: Thematic Strategy for Soil Protection. Commission of the European
Communities, http://eur-lex.europa.eu/LexUriServ/LexUriServ.do?uri=COM:2006:0231:FIN:EN:PDF.
15. Chabbi, A. et al. Aligning agriculture and climate policy. Nat Clim Change 7, 307–309 (2017).
16. Soussana, J. F. et al. Matching policy and science: Rationale for the ‘4 per 1000– soils for food security and climate’ initiative. Soil Till
Res 188, 3–15 (2017).
17. Arnó, J., Rosell, J. R., Blanco, R., Ramos, M. C. & Martinez-Casasnovas, J. A. Spatial variability in grape yield and quality influenced
by soil and crop nutrition characteristics. Precision Agriculture 13, 393–410 (2012).
18. Kaczyński, R. & Siebielec, G. The influence of exogenous organic matter on the content and quality of soil organic matter. eds. Malý,
S. & Siebielec, G. Testing of Exogenous Organic Materials for Safe Application to the Soil, Brno, Central Institute for Supervising and
Testing in Agriculture, Brno, Czech 31–38, (in Czech) (2015).
19. Diacono, M. & Montemurro, F. Long-term effects of organic amendments on soil fertility. A review. Agron Sustain Dev 30, 401–422
(2010).
20. Lechenet, M., Dessaint, F., Py, G., Makowski, D. & Munier-Jolain, N. Reducing pesticide use while preserving crop productivity and
profitability on arable farms. Nature Plants 3, 17008, https://doi.org/10.1038/nplants.2017.8 (2017).
21. Hijbeek, R. et al. Do organic inputs matter – a meta analysis of additional yield effects for arable crops in Europe. Plant Soil 411,
293–303 (2017).
22. Giavarina, D. Understanding Bland Altman analysis. Biochemia Medica 25, 141–151 (2015).
23. Usowicz, B., Marczewski, W., Usowicz, J. B., Łukowski, M. & Lipiec, J. Comparison of surface soil moisture from SMOS satellite and
ground measurements. Int Agrophys 28, 359–369 (2014).
Scientific Reports | (2019) 9:19883 | https://doi.org/10.1038/s41598-019-56266-5 10www.nature.com/scientificreports/ www.nature.com/scientificreports
24. Zawadzki, J. & Kędzior, M. Soil moisture variability over Odra watershed: Comparison between SMOS and GLDAS data. Int J Appl
Earth Obs 45, 110–124 (2016).
25. Malý, S. Exogenous organic matter in relation to soil organic matter and ecosystem function. eds. Malý, S. & Siebielec, G., Testing of
Exogenous Organic Materials for Safe Application to the Soil, Central Institute for Supervising and Testing in Agriculture, Brno,
Czech 5–13, (in Polish) (2015).
26. Lipiec, J., Turski, M., Bieganowski, A. & Usowicz, B. Effect of organic matter addition on soil physical properties. eds. Malý, S. &
Siebielec, G., Testing of Exogenous Organic Materials for Safe Application to the Soil, Central Institute for Supervising and Testing in
Agriculture, Brno, Czech 67–80, (in Polish) (2015).
27. Niedźwiecki, J., Smatanova, M., Gałązka, R., Cyganek, K. & Siebielec, G. Research methodology and characteristics of investigated
organic materials. eds Malý, S. &. Siebielec, G., Testing of Exogenous Organic Materials for Safe Application to the Soil, Central
Institute for Supervising and Testing in Agriculture, Brno, Czech, 15–29, (in Polish) (2015).
28. Gamma Design Software (GS + 9). Geostatistics for the environmental sciences (2008).
29. Zawadzki, J., Cieszewski, C. J., Zasada, M. & Lowe, R. C. Applying geostatistics for investigations of forest ecosystems using remote
sensing imagery. Silva Fenn 39, 599–617 (2005).
30. Bland, J. M. & Altman, D. G. Statistical method for assessing agreement between two methods of clinical measurement. The Lancet
327(8476), 307–310 (1986).
31. Usowicz, B. & Lipiec, J. The effect of exogenous organic matter on the thermal properties of tilled soils in Poland and the Czech
Republic. J Soil and Sediment, https://doi.org/10.1007/s11368-019-02388-2 (2019).
32. Cambardella, C. A. et al. Field-scale variability of soil properties in Central Iowa soils. Soil Sci Soc Am J 58, 1501–1511 (1994).
33. Ozpinar, S. Nutrient concentration and yield of maize (Zea mays L.) after vetch (Vicia sativa L.) in conventional and reduced tillage
systems. J Plant Nutr 39, 1697–1712 (2016).
34. Jug, D. et al. Effect of conservation tillage on crop productivity and nitrogen use efficiency. Soil Till Res 194, 104327, https://doi.
org/10.1016/j.still.2019.104327 (2019).
35. Długosz, J. & Piotrowska-Długosz, A. Spatial variability of soil nitrogen forms and the activity of N-cycle enzymes. Plant Soil
Environ 62, 502–507 (2016).
36. Batey, T. Soil compaction and soil management – a review. Soil Use Manage 25, 335–345 (2009).
37. Reichert, J. M., Suzuki, L. E. A. S., Reinert, D. J., Horn, R. & Håkansson, I. Reference bulk density and critical degree-of-compactness
for no-till crop production in subtropical highly weathered soils. Soil Till Res 102, 242–254 (2009).
38. Plaza, C. et al. Response of different soil organic matter pools to biochar and organic fertilizers. Agr Ecosys Environ 225, 150–159
(2016).
39. Frąc, M. et al. Effect of exogenous organic matter (EOM) on functional and genetic diversity of microorganisms and soil enzymatic
activity in relation to environmental properties. eds. Malý, S. & Siebielec, G. Testing of Exogenous Organic Materials for Safe
Application to the Soil, Central Institute for Supervising and Testing in Agriculture, Brno, Czech 81–103, (in Polish) (2015).
40. Tuf, I. H., & Horňák, O. The response of soil fauna to the exogenous organic matter application for soil fertilisation. eds. Malý, S. &
Siebielec, G. Testing of Exogenous Organic Materials for Safe Application to the Soil, Central Institute for Supervising and Testing in
Agriculture, Brno, Czech 105–114, (in Polish) (2015).
41. Čuhel, J., & Brzezińska, M. The risk of increasing greenhouse gas emissions from the soil as a result of the use of exogenous organic
matter, eds. Malý, S. & Siebielec, G. Testing of Exogenous Organic Materials for Safe Application to the Soil, Central Institute for
Supervising and Testing in Agriculture, Brno, Czech 115–128, (in Polish) (2015).
42. Czubaszek, R. & Wysocka-Czubaszek, A. Emissions of carbon dioxide and methane from fields fertilized with digestate from an
agricultural biogas plant. Intl Agrophys 32, 29–37 (2018).
Acknowledgements
The work was partially funded by the by HORIZON 2020, European Commission, Programme: H2020-
SFS-2015-2: SoilCare for profitable and sustainable crop production in Europe, project No. 677407 (SoilCare,
2016–2021) and Operational Programme Cross-border Cooperation Czech Republic – Republic of Poland under
the project “Risks and benefits of introducing exogenous organic matter into the soil” (CZ.3.22/1.2.00/12.03445,
2013–2015).
Author contributions
B.U. and J.L. performed experiments and measurements. B.U. carried out data computation and statistical
analysis. Both authors jointly wrote the paper.
Competing interests
The authors declare no competing interests.
Additional information
Correspondence and requests for materials should be addressed to B.U.
Reprints and permissions information is available at www.nature.com/reprints.
Publisher’s note Springer Nature remains neutral with regard to jurisdictional claims in published maps and
institutional affiliations.
Open Access This article is licensed under a Creative Commons Attribution 4.0 International
License, which permits use, sharing, adaptation, distribution and reproduction in any medium or
format, as long as you give appropriate credit to the original author(s) and the source, provide a link to the Cre-
ative Commons license, and indicate if changes were made. The images or other third party material in this
article are included in the article’s Creative Commons license, unless indicated otherwise in a credit line to the
material. If material is not included in the article’s Creative Commons license and your intended use is not per-
mitted by statutory regulation or exceeds the permitted use, you will need to obtain permission directly from the
copyright holder. To view a copy of this license, visit http://creativecommons.org/licenses/by/4.0/.
© The Author(s) 2019
Scientific Reports | (2019) 9:19883 | https://doi.org/10.1038/s41598-019-56266-5 11You can also read