The Effect of a Fly Ash-Based Soil Conditioner on Corn and Wheat Yield and Risk Analysis of Heavy Metal Contamination
←
→
Page content transcription
If your browser does not render page correctly, please read the page content below
sustainability

Article
The Effect of a Fly Ash-Based Soil Conditioner on
Corn and Wheat Yield and Risk Analysis of Heavy
Metal Contamination
Yanjun Ou 1 , Shuhua Ma 1, *, Xiao Zhou 2 , Xiaohui Wang 1 , Jianping Shi 2 and Yi Zhang 1
 1    National Engineering Laboratory for Hydrometallurgical Cleaner Production Technology,
      Key Laboratory of Green Process and Engineering, Institute of Process Engineering,
      Chinese Academy of Sciences, Beijing 100190, China; ouyanjun18@mails.ucas.ac.cn (Y.O.);
      wangxh@ipe.ac.cn (X.W.); yizh@ipe.ac.cn (Y.Z.)
 2    Lignite and Fly Ash Engineering Technology Research Institute, Xilingol Professional College,
      Xilinhot 026000, China; zhouxiao199012@163.com (X.Z.); shijp07@163.com (J.S.)
 *    Correspondence: shma@ipe.ac.cn; Tel./Fax: +86-10-82545032

 Received: 13 August 2020; Accepted: 31 August 2020; Published: 4 September 2020

 Abstract: The utilization of coal fly ash (CFA) as a soil conditioner has been a research hotspot in
 recent years. In this paper, the continuity and stability of the yield-increasing effect of a fly ash-based
 soil conditioner were investigated through field trials for three consecutive years. The yield-increasing
 effect and applicability were also investigated by planting a variety of crops in different types of
 soil. Field test results revealed that the new fly ash-based soil conditioner had wide adaptability and
 stability under the condition of reducing the application of traditional fertilizers by 20%. For corns
 grown in castano-cinnamon soil and dark brown soil, the application of the new fly ash-based soil
 conditioner for three consecutive years has steadily increased the yield by more than 10%. The yield of
 wheat planted in castano-cinnamon soil also increased by 15%. Additionally, considering that heavy
 metals (HMs) contained in the fly ash-based soil conditioner may cause environmental contamination,
 this paper calculated and analyzed the bio-concentration factor (BCF) and the translocation factor
 (TF) of Cr, As, Cd, Hg and Pb in the corn experimental fields. The results showed that the five heavy
 metals were not significantly enriched in various parts of the corn stalk after application of the soil
 conditioner, and there was temporarily no environmental risk in terms of returning straws to the field
 or raising livestock.

 Keywords: fly ash; soil conditioner; plant growth; heavy metal; risk analysis

1. Introduction
     Coal fly ash (CFA), a solid residue produced in coal-fired power stations [1], has a high annual
output as well as a negative impact on the environment in China, which has become an urgent issue
to be solved. Now, its annual production is estimated to be more than 600 million tons [2]. To make
matters worse, half of CFA is produced in northern China where the population density and economy
development level are relatively low, so CFA cannot be completely consumed by traditional methods
such as brick, cement, concrete and catalyst [3–5]. This inevitably leads to a large amount of CFA
accumulation. Therefore, it is urgent to develop new methods to utilize CFA with higher efficiency
and profitability.
     It is acknowledged that CFA is produced by the transformation of clay minerals in coal during the
process of coal combustion [6]. The main components of CFA are thereby alumina and silica, which
are very similar to those of natural clay. In general, the contents of alumina and silica in CFA are
about 20–40% and 40–60%, respectively [7]. Additionally, CFA contains a small amount of Mg, Na,

Sustainability 2020, 12, 7281; doi:10.3390/su12187281                        www.mdpi.com/journal/sustainability
Sustainability 2020, 12, 7281 2 of 16
P, K, and S, as well as trace elements such as As, B, Mn, Cu and Zn. Comparatively speaking, Si, Al,
Fe and Ca are most present in CFA; Mg, Na, P, K and S account for 0.5% to 3.5%, and trace elements
account for less than 0.1%. Among all the elements mentioned above, P, Si, Ca, Fe, Mg, K, S, B, Zn, Mn,
Cu, etc. are all nutrients required for plant growth [8]. The main phases of CFA are mullite, quartz
and/or amorphous silica depending on the variety of raw coal and the combustion temperature of the
coal-fired boiler. Moreover, there is a small amount of ferrite, anorthite, olivine, sulfate and so on in the
CFA. These components are not chemically steady, so they can be transformed and absorbed by plants
under specific conditions.
The porous structure of CFA makes it commonly used as a water-retaining product, and its
function of loosening soil can work to improve soil structure. Moreover, CFA contains a lot of nutrients
required for plant growth [8], so in recent years, the bio-concentration factor (BCF) has become a
new hot issue with regards to soil conditioners. The research of Song et al. [9] showed that the
application of CFA alone can effectively increase the water holding capacity of soil, and the combined
application of CFA and organic matter can synergistically mitigate soil water evaporation. However,
when CFA is directly applied to farmland without any processing, due to the poor activity of CFA
formed by high temperature sintering, the water retention efficiency of CFA is not high enough [10],
and the nutrient utilization efficiency is also low [11]. Based on its high specific surface area and
alkalinity, CFA has adsorption characteristics for metals, which may have a negative effect on the
absorption of certain metal elements by some plants, resulting in a decrease in the quantity of dry
matter [12] (the mass remaining after plant tissue loses free water). After BCF is applied to the soil, the
interaction of various ions will heighten the value of pH and the electrical conductivity (EC) in the
soil as a whole [13]. Moreover, high-dose application of CFA may significantly increase the salinity
of soil, reducing soil fertility and even resulting in toxic elements being released and groundwater
pollution [14]. The process of activation and modification of fly ash can activate nutrients or improve
water retention capacity, to reduce its application amount. Additionally, lots of studies have shown
that the application of fly ash-based soil conditioner will not enhance the accumulation of heavy metals
(HMs) in various plant tissues, and the application of fly ash-based soil conditioner in a safe ratio (less
than 8%) is beneficial to plant growth and development [15,16]. However, these studies are limited to
laboratory research, and the risk of CFA heavy metals contamination and large-scale field trials are
rarely reported.
Essentially, CFA is a by-product of the high-temperature conversion of inorganic minerals doped
in coal. It comes from the process of geological changes and eventually returns to nature. This study
attempts to make full use of CFA to improve soil structure and balance soil nutrients while returning
it to the earth. Our research group has successfully developed a fly ash activation and modification
process in the early stage [17]. This process completed the chemical activation and modification of
CFA by controlling the activation temperature as well as duration and by adding a calcium-containing
activation aid to the CFA [18]. In addition, a small amount of acidic organic matter was added to
reduce the alkalinity of the modified fly ash. Also, the research group has verified the feasibility
of a yield-increasing effect of fly ash-based soil conditioner through field trials in the year of 2017
and 2018, but they have only summarized the effect of corn yield increase in two years. Obviously,
verifying a new product for two years is not enough. So, in order to investigate the continuity of the
yield-increasing effect of fly ash-based soil conditioner and also the applicability to different crops, this
study repeated the previous field trials in the same fields in the year of 2019 and set up an additional
30 mu (unit of traditional Chinese land area, approximately equals to 667 m2 ) of wheat test field. At the
same time, it is considered that the fly ash-based conditioner contains a small amount of heavy metals;
this paper calculated and analyzed the BCF and translocation factor (TF) of Cr, As, Cd, Hg and Pb in
the corn experimental field and assessed their environmental contamination risk.Sustainability 2020, 12, 7281 3 of 16
2. Materials and Methods
2.1. Raw Materials and Apparatus
Coal fly ash was obtained from a coal-fired power plant in Inner Mongolia, China, which contains
11.37% Al, 25.93% Si, 4.80% Fe, 3.66% Ca and 1.78% Mg by weight and also a small amount of Mn,
B, Cu, Zn and Cl [17]. The soil conditioner from CFA in this study was prepared using the method
mentioned in the patent [18]. In the soil conditioner, the activated rates of MgO, CaO and SiO2 were
43.28%, 96.90% and 78.82% respectively [17]. The test method of these available components was
determined by China NT/T 2272-2012 soil conditioner [19].
Corn and wheat seeds and conventional fertilizers were purchased locally. The fertilizer consists
of N, P2 O5 and K2 O, which were no less than 15%, respectively.
Inductively Coupled Plasma–Mass Spectrometry (ICP-MS, iCAPQc) were used to analyze the
solid chemical composition of the CFA, soil and plants. Microwave Digestion System (MDS-6G,
Shanghai Xinyi Microwave Chemical Co., Ltd., China) was used to digest plant and soil samples.
2.2. Experimental Methods
At harvest, at least five sets of corn yield data in each plot were collected, and then the yield of
each plant per mu (unit of traditional Chinese land area, approximately equal to 667 m2 ) was calculated.
The wheat yield data came from the average value of ten plants. The following measurements and
observations were also made: grains of ten representative plants were selected to analyze the contents
of HMs.
Grain samples were collected after the plants had matured. Before chemical analysis, soil samples
were air dried and ground (Sustainability 2020, 12, 7281 4 of 16
Sustainability 2020, 12, x FOR PEER REVIEW 4 of 16
cinnamon soil for wheat.
castano-cinnamon soil forThe control
wheat. Thegroup
controlwas conventionally
group fertilizedfertilized
was conventionally (40 kg/mu), and the amount
(40 kg/mu), and the
of conditioner
amount applied applied
of conditioner in the experimental group was
in the experimental set to
group was50set
kg/mu.
to 50 kg/mu.
orderto to
In order verify
verify the actual
the actual yield-increasing
yield-increasing performance
performance of the soilofconditioner,
the soil conditioner, field
field experiments
experiments
began began to be
to be conducted onconducted on the soilfrom
the soil conditioner conditioner
2017. from 2017.
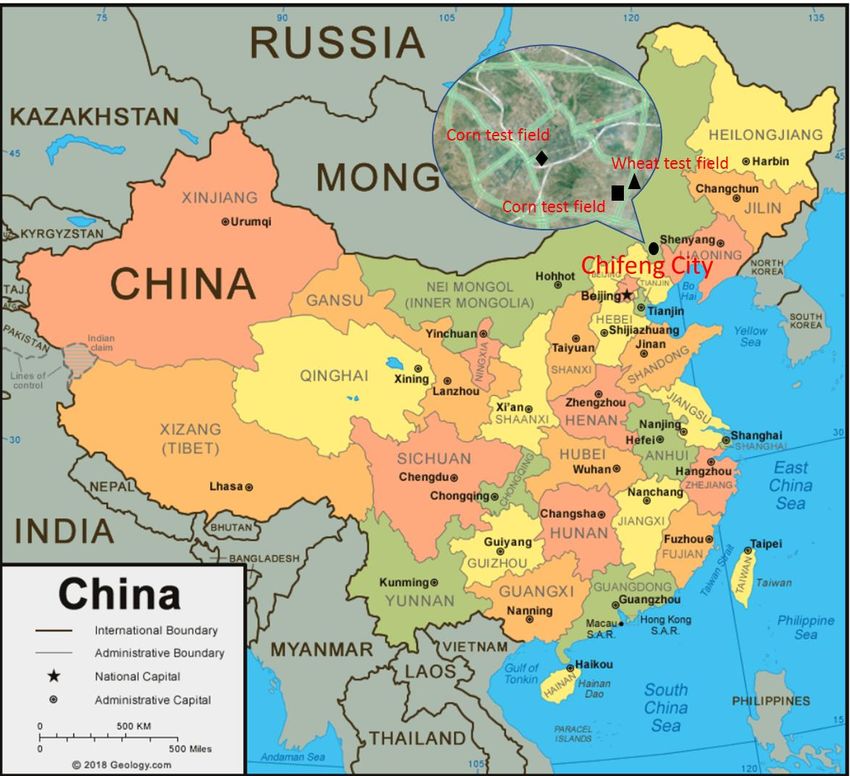
The specific
The specificgeographical
geographicallocations
locations of the
of the test test fields
fields are shown
are shown in Figurein Figure 1. Chifeng
1. Chifeng City is
City is marked
marked
as “•” inas “●”
the in the
map. “”map.
and “■”
“” and
stand“♦”forstand for the castano-cinnamon
the castano-cinnamon soil and
soil and dark darksoil
brown brown
fieldsoil field
for corn
for corn planting,
planting, respectively,
respectively, the areas ofthewhich
areasare
of which
5 mu, andare “N”
5 mu, and “▲”the
represents represents the wheat
wheat planting planting
field, which
field,
is a 30which is a 30 mu castano-cinnamon
mu castano-cinnamon soli field. soli field.
Figure 1. The specific geographical location of the test fields.
3. Results and
3. Results and Discussion
Discussion
3.1. Results of Field Experiments
3.1. Results of Field Experiments
3.1.1. Castano-Cinnamon Test Results
3.1.1. Castano-Cinnamon Test Results
Table 1 shows the yield data for corn planted in castano-cinnamon soil in 2019. Table 2 shows the
Table 1 shows the yield data for corn planted in castano-cinnamon soil in 2019. Table 2 shows
comparison of three-year corn yield-increase rates in castano-cinnamon soil.
the comparison of three-year corn yield-increase rates in castano-cinnamon soil.Sustainability 2020, 12, 7281 5 of 16
Table 1. The yield data of corn planted in castano-cinnamon soil for 2019.
Average Weight of
Average Yield Per Yield-Increase Yield-Increase
Groups Ten Corn
mu/kg Rate 1/% Rate 2/%
Plants/kg
Blank Control (BC) 1.113 439.71 0.00 −22.42
Conventional Fertilization (CF, 40 kg/mu) 1.435 566.77 28.90 0.00
CF + Soil Conditioner (SC, 100 kg/mu) 1.506 590.93 34.39 4.26
80% of CF + SC 1.457 571.76 30.03 0.88
50% of CF + SC 1.448 568.02 29.18 0.22
80% of CF + 50% of SC 1.470 580.73 32.07 2.46
Note: Yield-increase rate 1 and Yield-increase rate 2 are based on blank and conventional fertilization, respectively.
Table 2. Yield-increase rates of corn planted in castano-cinnamon soil for three years.
Yield-Increase Yield-Increase Yield-Increase Yield-Increase Yield-Increase Yield-Increase
Groups Rate 1 for Rate 2 for Rate 1 for Rate 2 for Rate 2 for Rate 2 for
2019/% 2019/% 2018/% 2018/% 2017/% 2017/%
Blank Control (BC) 0.00 −22.42 0.00 −8.27 0.00 −1.18
Conventional Fertilization
28.90 0.00 9.02 0.00 1.20 0.00
(CF, 40 kg/mu)
CF + Soil Conditioner
34.39 4.26 24.18 13.91 10.05 8.75
(SC, 100 kg/mu)
80% of CF + SC 30.03 0.88 22.07 11.97 11.72 10.40
50% of CF + SC 29.18 0.22 65.98 52.25 11.24 9.93
80% of CF + 50% of SC 32.07 2.46 15.99 6.40 11.48 10.17
Note: Yield-increase rate 1 and Yield-increase rate 2 are based on blank and conventional fertilization, respectively.
Yield-increase rate 1 and 2 for 2017 and 2018 is quoted from a report by our team [17].
As can be seen from the tables above, the application of fly ash-based soil conditioner in
castano-cinnamon soil for three consecutive years was able to steadily and continuously increase
the corn yield. Over three years, the average increase rate was 11.0%, especially in 2017 and 2018.
Corn yield increased significantly with the highest increase rate being 52.25%, as was speculated to be
the result due to the interaction between errors in sample collection or the synergy between fertilizers
and low soil topography, which enriched the fertilizer water. The specific reasons need to be further
studied, but the outstanding effect of increasing yield was undeniable. In 2019, yield-increase rate
2 was declined, with the highest increase rate being 4.26%, but yield-increase rate 1 remained stable
with a high level. Comparing the three-year corn yield data of blank control (BC) and conventional
fertilization (CF), it can be found that the yield-increase rate 1 was 1.20%, 9.02%, and 28.90% in 2017,
2018, 2019, respectively. It could be speculated that the traditional fertilizer accumulated for years in
the early stage of the BC plot was gradually being consumed, and fertility was gradually decreasing.
Under this circumstance, the yield-increasing effect of traditional fertilizers became more and more
significant. Comparing the three-year corn yield data of CF and CF + SC (soil conditioner), it can be
found yield-increase rate 2 for 2017 and 2018 is about 10%, while in 2019 it fell to below 5%. It was
speculated that after the two-year application of soil conditioner, medium trace elements in the soil
had been able to meet the needs of crop growth, so the effect of re-application on yield increase became
minimal. Moreover, 50% of CF + SC in 2019 could still maintain a higher yield, indicating that the
accumulated fertilizer in the soil before 2019 plus the newly added 20 kg fertilizer, together with the
nutrients in the soil conditioner, constituted the nutritional balance required for plant growth. This is
subject to further verification.
In 2018, the feasibility of soil conditioner for increasing the yield of potatoes was tested, and
the results showed that both the yield and quality of potato have been greatly improved by soil
conditioner [17]. In order to further test whether the soil conditioner has a yield-increasing effect on a
variety of crops, a field experiment for wheat was added in 2019. Table 3 shows the characteristics and
yield data of wheat grown in castano-cinnamon soil in 2019.Sustainability 2020, 12, 7281 6 of 16
Table 3. The characteristics and yield data of wheat planted in castano-cinnamon soil in 2019.
Plant Ear Single Ear Number of Hundred-Grain
Groups
Height/cm Length/cm Weight/g Grains Per Ear Wet Weight/kg
Conventional Fertilization (CF, 40 kg/mu) 81.35 6.13 1.53 27.43 3.71
CF + Soil Conditioner (50 kg/mu) 88.73 7.79 2.16 34.06 4.12
Increase rate 8.73% 27.08% 41.10% 24.17% 10.85%
From Table 3, it can be seen that the application of fly ash-based soil conditioner was able to greatly
increase the wheat yield in the test field of castano-cinnamon soil. The grain yield monitoring data
revealed that the wheat yield increased by 14.95%. At the same time, traits of wheat have improved
significantly. The height of plant as well as the length of ear increased significantly, and wheat grain
became fuller. Furthermore, the mass of single wheat ear increased by 41.10%, and the number of
grains per ear increased by 24.17%. Judging from the field tests of wheat and corn on castano-cinnamon
soil, it can be found that the yield-increasing effect of soil conditioner is not limited to a single crop but
is widely adaptable.
3.1.2. Dark Brown Soil Test Results
Table 4 shows the yield data for corn planted in dark brown soil in 2019. Table 5 shows the
comparison of three-year corn yield-increase rates in dark brown soil.
Table 4. The yield data of corn planted in dark brown soil for 2019.
Average Weight of
Average Yield Per Yield-Increase Yield-Increase
Groups Ten Corn
mu/kg Rate 1/% Rate 2/%
Plants/kg
Blank Control (BC) 1.179 465.55 0.00 −3.90
Conventional Fertilization (CF, 30 kg/mu) 1.226 484.43 4.06 0.00
CF + Soil Conditioner (SC, 100 kg/mu) 1.375 543.13 16.66 12.12
80% of CF + SC 1.648 650.94 39.82 34.37
50% of CF + SC 1.494 590.03 26.74 21.80
80% of CF + 50% of SC 1.484 586.35 25.95 21.04
Note: Yield-increase rate 1 and Yield-increase rate 2 are based on blank and conventional fertilization respectively.
Table 5. Yield-increase rates of corn planted in dark brown soil for three years.
Yield-Increase Yield-Increase Yield-Increase Yield-Increase Yield-Increase Yield-Increase
Groups Rate 1 for Rate 2 for Rate 1 for Rate 2 for Rate 2 for Rate 2 for
2019/% 2019/% 2018/% 2018/% 2017/% 2017/%
Blank Control (BC) 0.00 −3.90 0.00 −8.33 0.00 −3.99
Conventional Fertilization
4.06 0.00 9.09 0.00 4.16 0.00
(CF, 30 kg/mu)
CF + Soil Conditioner
16.66 12.12 19.19 9.26 6.11 1.87
(SC, 100 kg/mu)
80% of CF + SC 39.82 34.37 16.89 7.15 4.55 0.37
50% of CF + SC 26.74 21.80 17.85 8.03 7.08 2.81
80% of CF + 50% of SC 25.95 21.04 21.81 11.66 8.84 4.49
Note: Yield-increase rate 1 and Yield-increase rate 2 are based on blank and conventional fertilization respectively.
Yield-increase rate 1 and 2 for 2017 and 2018 is quoted from a report by our team [17].
As can be seen from the tables above, the application of fly ash-based soil conditioner in dark
brown soil for three consecutive years was able to increase corn yield steadily and continuously.
The growth rate has increased year by year, with an average increase of 11.2% over three years. Yield
increase was the most obvious in 2019, of which the largest increase occurred in the group of 80% CF
and 100% SC, with increase rates of 39.82% and 34.37%, compared with the conventional fertilization
group and the blank control group, respectively. The field test results of dark brown soil in 2017 and
2018 showed that the optimal treatment was 80% of CF + 50% of SC, which still significantly increased
corn yield in 2019 by 25.95% and 21.04%, respectively, compared with the conventional fertilization
group and the blank control group. It is speculated that conventional fertilization can be reducedSustainability 2020, 12, 7281 7 of 16
to 80%, and conditioners can be reduced by up to 50%. Compared with the castano-cinnamon soil
test field, the dark brown soil test field showed no decline in corn yield increase in 2019. This should
be attributed to the steep terrain of the dark brown soil test field, which led to the loss of fertilizers
(chemical fertilizers and soil conditioner), and the cumulative effect is not obvious.
3.2. Risk of Heavy Metal Contamination
In order to fully investigate the potential environmental impact of fly ash-based soil conditioner,
this section aimed to track and analyze the HMs in corn and soil. The behavior of HMs had been
briefly detected and analyzed in 2017, and the results showed that the HMs had not been significantly
enriched in corn stalks after applying the soil conditioner. Considering the accumulation of HMs
with the increase in the application amount of fly ash-based soil conditioner, based on the work
conducted in 2017, the conventional fertilization group and the maximum amount of conditioner
application group would continue to be selected as representatives in 2019. The heavy metal contents
in various parts of selected corn plants were also compared and analyzed. Furthermore, the values of
the bio-concentration factor (BCF) and translocation factor (TF) were calculated and analyzed because
they are the two main parameters for assessing the input, accumulation and transfer of HMs in soil [20].
One of the first things we needed to briefly calculate was the theoretical input of HMs caused by
the conditioner. In the above field tests, the general tillage depth was about 20 cm, and based on 667 m2
per mu, the actual cultivated soil volume was 133.4 m3 . The general soil bulk density was 1.1~1.4 g/cm3
(choosing 1.3 g/cm3 ). Therefore, the actual cultivated soil was 173,420 kg/mu, and the maximum
application amount of soil conditioner was 100 kg/mu, only accounting for 0.06%. Below, Table 6
shows the test results of five HMs in fly ash-based soil conditioner, and Table 7 shows the theoretical
increase in soil heavy metal concentrations due to the application of soil conditioner within three years
and China’s risk control standard for soil contamination of agriculture land of GB 15618-2018.
Table 6. The test results of five heavy metals in fly ash-based soil conditioners.
Cr As Cd Hg Pb
mg/kg 29.01 41.39 0.25 0.23 15.08
g/100 kg 2.90 4.14 0.025 0.023 1.51
Note: This test result is issued by the Testing Center of Tsinghua University.
Table 7. The theoretical increase of soil heavy metal concentrations within three years.
Cr As Cd Hg Pb
mg/kg 0.050 0.072 0.00044 0.00039 0.026
Limit/mg/kg 150 20 0.3 0.5 70
Note: Limit represents the soil environmental quality assessment indicator limits of GB 15618-2018.
As can be seen from the table above, when the tillage depth is 20 cm and the application amount
of soil conditioner is 100 kg/mu, it was equivalent that 2.90 g Cr, 4.14 g As, 0.025 g Cd, 0.023 g Hg
and 1.51 g Pb would subsequently enter the 173,420 kg soil. Based on cumulative input over the
past three years, it could be calculated that the theoretical increases of soil heavy metal contents
were only 0.050 mg/kg, 0.072 mg/kg, 0.00044 mg/kg, 0.00039 mg/kg and 0.026 mg/kg, respectively,
which were far below the soil environmental quality assessment indicator limits of GB 15618-2018.
It can be preliminarily inferred that the potential contamination risk of HMs in the fly ash-based soil
conditioner being transferred into the soil is negligible and can be ignored. Tables 8 and 9 indicate that
the application of soil conditioner for three consecutive years did not significantly increase the heavy
metal contents in the castano-cinnamon soil and dark brown soil. Of course, more specific calculation
and analysis of HMs in corn plants have been done as well.Sustainability 2020, 12, 7281 8 of 16
Table 8. Contents of heavy metals in castano-cinnamon soil.
Cr As Cd Hg Pb
CF 21.06 6.74 0.15 0.14 10.93
CF + SC 24.97 8.95 0.11 0.13 11.24
Table 9. Contents of heavy metals in dark brown soil.
Cr As Cd Hg Pb
CF 32.95 5.02 0.67 0.09 16.76
CF + SC 44.81 4.99 0.76 0.12 17.59
3.2.1. Contents of Heavy Metals in Corn Plants
Table 10 below shows the test results of heavy metal contents in corn on the test field of
castano-cinnamon soil.
Table 10. The test results of five heavy metal contents in corn on castano-cinnamon soil.
Groups Cr As Cd Hg Pb
CF-root 10.62 0.71 0.07 0.03 2.06
CF + SC-root ↑11.46 ↑0.92 ↑0.09 ↓0.03 ↑4.08
CF-stem 7.40 0.36 0.07 0.02 1.49
CF + SC-stem ↓4.17 ↓0.08 ↓0.01 ↓0.02 ↓0.50
CF-lamina 12.54 0.81 0.13 0.08 2.61
CF + SC-lamina ↓7.56 ↑0.82 ↓0.13 ↑0.09 ↑2.83
Note: CF is conventional fertilization (40 kg/mu) treatment; CF + SC is conventional fertilization (40 kg/mu) +
conditioner (100 kg/mu) treatment. The unit of heavy metal content is mg/kg.
As is shown in the Table 10, compared with conventional fertilization, there was no significant
increase of Cr, As, Cd, Hg, and Pb in the root, stem, and lamina of corn after the application of the
soil conditioner in the test field of castano-cinnamon soil. At the root, the contents of Cr, As and Cd
increased slightly by less than 29.5% and the content of Hg remained unchanged, while the content of
Pb increased significantly by 98.1%. In general, the application of soil conditioner on castano-cinnamon
soil would not significantly enhance the absorption and enrichment of Cr, As, Cd and Hg by the root of
corn. At the stem, the contents of these five HMs all decreased to varying degrees. As for the HMs in
lamina, the content of Cr decreased significantly by 39.7%, and the contents of the remaining HMs were
basically flat. Overall, these five HMs were not significantly enriched in any part of the corn after the
soil conditioner had been applied in the test field of castano-cinnamon soil. There is no environmental
risk for returning straw to the field or for raising livestock.
Below, Table 11 shows the test results of heavy metal contents in corn on the test field of dark
brown soil.
Table 11. The test results of five heavy metal contents in corn on dark brown soil.
Groups Cr As Cd Hg Pb
CF-root 11.88 1.30 0.07 0.09 4.26
CF + SC-root ↑12.03 ↓1.06 ↓0.06 ↓0.06 ↓3.68
CF-stem 9.89 0.31 0.07 0.08 1.57
CF + SC-stem ↑12.48 ↑0.41 ↑0.08 ↓0.07 ↑1.90
CF-lamina 7.24 0.48 0.09 0.06 2.06
CF + SC-lamina ↑7.91 ↓0.42 ↓0.08 ↓0.04 ↓1.82
Note: CF is conventional fertilization (30 kg/mu) treatment; CF + SC is conventional fertilization (30 kg/mu) +
conditioner (100 kg/mu) treatment. The unit of heavy metal content is mg/kg.Sustainability 2020, 12, 7281 9 of 16
From the data in the table above, compared with conventional fertilization, it can be seen that in
the dark brown soil test field, there was no significant increase of Cr, As, Cd, Hg and Pb in the root,
stem, and lamina of corn after the application of the soil conditioner. At the root, the contents of these
five HMs were basically flat. The content of Cr increased by only 1.2%, while the contents of As, Cd,
Hg, and Pb showed a downward trend. Generally speaking, the application of soil conditioner on
dark brown soil had no obvious effect on the corn root for absorption and enrichment of these five
HMs. At the stem, the contents of As, Cd, Hg, and Pb seemed to be basically flat, while the content of
Cr increased slightly. Similarly, the contents of these five HMs in the lamina were almost unchanged.
Overall, these five HMs were not significantly enriched in any parts of the corn after the soil conditioner
had been applied in the test field of dark brown soil. There is no environmental risk for returning straw
to the field or for raising livestock.
In view of the overall results, the application of fly ash-based soil conditioner in the two test
fields had no significant effect on the absorption and enrichment of Cr, As, Cd and Hg by corn.
The application of soil conditioner in the castano-cinnamon soil test field might increase the absorption
and enrichment of Pb by the root of corn. In fact, Pb is most likely to migrate under acidic conditions,
while the soil conditioner is alkaline. Theoretically, the application of soil conditioner could inhibit the
migration of Pb. As a result, the root of corn grown on dark brown soil reduced the absorption of Pb.
Furthermore, the behavior of Pb in the shoot part of the corn was consistent with that of Cr, As, Cd and
Hg, whose contents basically remained unchanged without any significant increase, or even decreased.
Therefore, it was speculated that the substantial increase of Pb in corn root is caused by experimental
errors. Subsequent detection of heavy metal contents in corn grains has also been conducted.
3.2.2. Soil Conditioner Affects Transfer of Heavy Metals in Corn
BCF is defined as the ratio of the metal contents in plant parts (including root, stem and lamina)
to the exchangeable metal contents in the soil [20]. Larger BCF usually indicates a greater ability of one
metal to migrate from soil to plant parts [21]. TF is the ratio of the metal contents in the shoot part
(including stem, lamina and fruit) of the plant to the metal contents in the root [20]. The uptake of
HMs by plants may be related to the bioavailability of these metals and the physic-chemical properties
of the soil [22]. Based on the research by Mujtaba et al. [13], lower TF value always represents a lower
degree of food chain enrichment and lower risk of heavy metal contamination. By calculating BCF and
TF values and comparing their changes with different treatments, the effects of soil conditioner on
HMs transfer can be explored to assess the risk of HMs contamination. Figures 2 and 3 show the BCF
and TF values of corn grown in castano-cinnamon soil.
As is shown in the Figure 2, after applying the soil conditioner to the castano-cinnamon soil
test field, the BCFroot (BCF between root and soil), BCFstem (BCF between stem and soil) and BCFlam
(BCF between lamina and soil) of Cr and As showed a downward trend, with a decrease of 83% to
4%. The BCFroot , BCFstem and BCFlam (BCFs) of Hg reminded almost unchanged. As for Pb, it was
previously speculated that the experimental error led to an artificial increase of Pb in corn root, which
further led to the increase of the BCFroot of Pb. The BCFroot and BCFlam of Cd increased significantly,
while the BCFstem of Cd dropped sharply. In fact, the differences of Cd contents in corn root and lamina
are not obvious. It was speculated that the difference in soil background was the main reason for the
increase of the BCFroot and BCFlam of Cd.
From the data shown in Figure 3, it can be seen that after the application of soil conditioner in the
castano-cinnamon test field, the TF values of these five HMs in corn all changed significantly. On the
whole, the TFstem (TF between stem and root) of Pb, Cd, As and Cr decreased sharply, with a decrease
range of 93% to 47%, while the TFstem of Hg remained almost unchanged. The TFlam (TF between
lamina and root) of Cr, As, Cd and Pb showed a downward trend, with a decrease of 45% to 19%, and
the descending order was Pb > Cr > As > Cd. The TFlam of Hg rose slightly by 16%, which might be
related to diverse cultivation methods, environmental differences, the special transportation mode of
Hg in corn and experimental errors.nability 2020, 12, x FOR PEER REVIEW 11
Sustainability 2020, 12, 7281 10 of 16
CF
CF+SC
0.8
0.7
BCF between root and soil
0.6
0.5
0.4
0.3
0.2
0.1
0.0
Cr As Cd Hg Pb
HMs
CF
CF+SC
0.4
BCF between stem and soil
0.3
0.2
0.1
0.0
Cr As Cd Hg Pb
HMs
CF
CF+SC
1.2
BCF between lamina and soil
1.0
0.8
0.6
0.4
0.2
0.0
Cr As Cd Hg Pb
HMs
Figure 2. BCF values of corn grown in castano-cinnamon soil. Note: The left is BCFroot , the middle
Figure 2. BCF is BCFstem
values of and
cornthe grown
right is BCF ; CF is conventional fertilization
inlamcastano-cinnamon soil.(40Note:
kg/mu)The
treatment;
the middle is is +BCF
left CF SC isroot,
conventional fertilization (40 kg/mu) + conditioner (100 kg/mu) treatment.
BCFstem and the right is BCFlam; CF is conventional fertilization (40 kg/mu) treatment; CF + SC is
conventional fertilization (40 kg/mu) + conditioner (100 kg/mu) treatment.Sustainability 2020, 12, x FOR PEER REVIEW 12 of 17
Sustainability 2020, 12, 7281 11 of 16
CF
1.0 CF+SC
0.8
TF between stem and root
0.6
0.4
0.2
0.0
Cr As Cd Hg Pb
HMs
CF
CF+SC
3.0
TF between lamina and root
2.5
2.0
1.5
1.0
0.5
0.0
Cr As Cd Hg Pb
HMs
Figure 3. TF values of corn grown in castano-cinnamon soil. Note: The left is TFstem and right is TFlam ;
Figure 3. TF values of corn grown in castano-cinnamon soil. Note: The left is TFstem and right is TFlam;
CF is conventional fertilization (40 kg/mu) treatment; CF + SC is conventional fertilization (40 kg/mu) +
CF is conventional fertilization (40 kg/mu) treatment; CF + SC is conventional fertilization (40 kg/mu)
conditioner (100 kg/mu) treatment.
+ conditioner (100 kg/mu) treatment.
Figures 4 and 5 show the BCF and TF values of corn grown in dark brown soil.
Figures 4 and 5 show the BCF and TF values of corn grown in dark brown soil.
AsAsis is
shown
shownininthe theFigure
Figure4,4,after
after applying
applying thethe soil
soilconditioner
conditionertotothe thedark
dark brown
brown soil
soil testtest field,
field,
thethe
BCF
BCFroot , BCF
root, BCFstem
and BCF
stem and BCFlam lam (BCFs) of Pb, Cr, As and Cd basically showed a
(BCFs) of Pb, Cr, As and Cd basically showed a downward trend, with downward trend,
with a decrease
a decrease range
range of 26%
of 26% to −12%.
to −12%. The BCFs
The BCFs of Hgof Hg dropped
dropped significantly,
significantly, with a with a decrease
decrease of moreof more
than
than
38%. From the data shown in Figure 5, it can be seen that after applying the conditioner in the darkthe
38%. From the data shown in Figure 5, it can be seen that after applying the conditioner in
dark brown
brown soilsoil
testtest field,
field, a large
a large proportion
proportion of the
of the TF TF values
values of these
of these fivefive
HMsHMs in in
corncorndiddid
notnot change
change
significantly.
significantly.Specifically,
Specifically, TFstem stemofof Cr,
Cr, CdCdandand
Hg Hg increased
increased slightly
slightly with awith
rangea of
range
25% to of17%,
25%while
to 17%,
while
the the TFstem
TFstem of As ofand
As and Pb rose
Pb rose by by
60%60%andand 40%,
40%, respectively,
respectively, probably
probably duedueto to lower
lower background
background
concentrationand
concentration andexperimental
experimentalerrors.
errors. TFlam
lamofofAs,
As,Pb,
Pb,CrCrandandHgHginincorncornwas
was almost
almost unchanged,
unchanged,
with
with a variation
a variation rangeofof7.8%
range 7.8%toto−1.7%.
−1.7%. Although
Although the the TF lamofofCd
TFlam Cdchanged
changed the
themost,
most, itsits
growth
growth was
was
only
only 11%.
11%.
In view of the overall results, the application of the soil conditioner had a significant effect on the
BCF and TF values of As, Pb, Cr, Cd and Hg in the castano-cinnamon soil test field, in which the TFstem
and TFlam (TFs) values showed a downward trend. Excluding the effects of sampling and testing
errors, the BCFs of these five HMs should theoretically remain unchanged or even decrease. The reason
for this is that the soil conditioner agent is alkaline and has a strong adsorption capacity, which can
firmly immobilize the HMs in the soil [13]. The decrease in BCFs and TFs means that the application of
soil conditioner limits the transfer of HMs in soil, as well as corn, and reduces the risk of heavy metal
contamination. The soil conditioner contains a large amount of active silicon, which is an important
element for building plants. Also, silicon can promote plant synthesis and release chelating agents [23],
thereby forming hydroxyaluminosilicate precipitation to limit the transfer of HMs [24]. The increasedSustainability 2020, 12, 7281 12 of 16
content of silicon in corn stalks, which were specifically tested, and the changes in the TFs of HMs
also corroborate this view. In the dark brown soil test field, the BCFs of these five HMs all showed a
downward trend, while the TFs of these five HMs remained basically flat or slightly increased with the
application of the soil conditioner (deviations were within 10%). After excluding some sampling and
testing
Sustainability 2020, 12, xerrors, the landform
FOR PEER REVIEW of the test field and the change of corn mass were analyzed. As a result, 13 of 17
it is possible that the inclined terrain and natural rainfall caused the conditioner not to be completely
absorbed in the plot, which would reduce the ability of the soil conditioner to limit HMs transfer.
CF
CF+SC
1.0
0.8
BCF between root and soil
0.6
0.4
0.2
0.0
Cr As Cd Hg Pb
HMs
CF
1.0 CF+SC
0.8
BCF between stem and soil
0.6
0.4
0.2
0.0
Cr As Cd Hg Pb
HMs
CF
CF+SC
0.6
BCF between lanima and soil
0.5
0.4
0.3
0.2
0.1
0.0
Cr As Cd Hg Pb
HMs
Figure 4. BCF values of corn grown in dark brown soil. Note: The left is BCFroot , the middle is BCFstem
Figure 4. BCFand values ofiscorn
the right grown
BCFlam in dark brown
; CF is conventional soil.
fertilization (30Note:
kg/mu)The left is
treatment; + SCroot
CFBCF , the middle is BCFstem
is conventional
fertilization (30 kg/mu) + conditioner (100 kg/mu) treatment.
and the right is BCFlam; CF is conventional fertilization (30 kg/mu) treatment; CF + SC is conventional
fertilization (30 kg/mu) + conditioner (100 kg/mu) treatment.
CF
CF+SCSustainability 2020, 12, x FOR PEER REVIEW 13 of 17
Sustainability 2020, 12, 7281 13 of 16
CF
CF+SC
1.2
1.0
TF between stem and root
0.8
0.6
0.4
0.2
0.0
Cr As Cd Hg Pb
HMs
CF
CF+SC
1.2
TF between lamina and root
1.0
0.8
0.6
0.4
0.2
0.0
Cr As Cd Hg Pb
HMs
Figure
Figure 5. TF5.values
TF values of corn
of corn grown
grown inin darkbrown
dark brownsoil.
soil. Note:
Note: The
Theleft
leftisisTF
TF
stem andand
stem right is TFislamTF
right ; CF
lamis; CF is
conventional
conventional fertilization
fertilization (30(30kg/mu)
kg/mu)treatment; CF ++SC
treatment; CF SCisisconventional
conventional fertilization (30 kg/mu)
fertilization (30 kg/mu)+ +
conditioner
conditioner (100(100 kg/mu)
kg/mu) treatment.
treatment.
In viewof
3.2.3. Detection ofHeavy
the overall
Metalresults, the application
in Corn Grain of the soil conditioner had a significant effect on
the BCF and TF values of As, Pb, Cr, Cd and Hg in the castano-cinnamon soil test field, in which the
As the
TFstem contents
and of some
TFlam (TFs) valuesHMsshowedin acorn grainstrend.
downward are lower thanthe
Excluding theeffects
detection limit, and
of sampling it istesting
difficult to
perform calculation
errors, the BCFs of and contrast
these analysis
five HMs should oftheoretically
TFfru (TF between fruit and root).
remain unchanged or evenSince the potential
decrease. The
hazards of for
reason HMs thisin
is soil conditioner
that the are a agent
soil conditioner hot issue when
is alkaline soil
and hasconditioner is utilized
a strong adsorption for agriculture,
capacity, which
accurate qualityimmobilize
can firmly examinations of allinthe
the HMs corn
the soilsamples
[13]. Thewere conducted
decrease in BCFsafter
andtheTFsharvests
means that in 2017
the and
application of soil conditioner limits the
2018. The examination results of 2018 are shown below. transfer of HMs in soil, as well as corn, and reduces the risk
of heavy
As shown metal contamination.
in Tables 12 and 13, Theafter
soil conditioner contains
the application of asoil
large amount of active
conditioner, silicon, which
the contents of HMs in
is an important element for building plants. Also, silicon can promote plant synthesis and release
the corn grains did not change significantly in 2018, and the quality of the corn grains totally meets
chelating agents [23], thereby forming hydroxyaluminosilicate precipitation to limit the transfer of
the Chinese and EU standards. Furthermore, compared with the examination results of 2017 [17],
HMs [24]. The increased content of silicon in corn stalks, which were specifically tested, and the
therechanges
was noin obvious enrichment of HMs in corn grains. Of course, continuous tracking detection is
the TFs of HMs also corroborate this view. In the dark brown soil test field, the BCFs of
still necessary.
these five HMs all showed a downward trend, while the TFs of these five HMs remained basically
flat or slightly increased with the application of the soil conditioner (deviations were within 10%).
Table 12. The contents
After excluding of heavy metals
some sampling in cornerrors,
and testing grainsthe
planted on castano-cinnamon
landform soil the
of the test field and afterchange
applying
of
soil conditioner in 2018.
corn mass were analyzed. As a result, it is possible that the inclined terrain and natural rainfall caused
the conditioner not to be completely absorbed in the plot, which would reduce the ability of the soil
Elements Pb Cd Hg As Cr
conditioner to limit HMs transfer.
Blank Control (BC) / / / / 0.450
Conventional Fertilization(CF) / / / / 0.344
3.2.3. Detection of CF
Heavy Metal in Corn Grain.
+ Soil Conditioner (SC) / / / / 0.438
80% of CF + SC / / / / 0.544
50% of CF + SC / / / / 0.367
80% of CF + 50% of SC / / / / 0.489
China food safety standard of GB 2762-2012 0.2 0.1 0.02 0.5 1.0
European food safety standard of EC 1881/2006 0.2 0.1 / / /Sustainability 2020, 12, 7281 14 of 16
Table 13. The contents of heavy metals in corn grains planted on dark brown soil after applying soil
conditioner in 2018.
Elements Pb Cd Hg As Cr
Blank Control (BC) / 0.002 / 0.02 0.480
Conventional Fertilization(CF) / 0.001 / / 0.552
CF + Soil Conditioner (SC) 0.02 0.002 / / 0.546
80% of CF + SC / 0.002 / / 0.596
50% of CF + SC / 0.001 / / 0.291
80% of CF + 50% of SC 0.02 0.002 / / 0.558
China food safety standard of GB 2762-2012 0.2 0.1 0.02 0.5 1.0
European food safety standard of EC 1881/2006 0.2 0.1 / / /
4. Conclusions
A new type of inorganic soil conditioner, synthesized by utilizing CFA, was used as experiment
material, and a series of field experiments were conducted to verify the continuity and stability of
the yield-increasing effect of this fly ash-based soil conditioner and analyze the risk of heavy metal
contamination. The main conclusions are as follows:
(1) Field tests on different types of soils and crops for three consecutive years show that new
fly ash-based soil conditioner has broad adaptability and stability. For corn grown in
castano-cinnamon soil and dark brown soil, the application of new fly ash-based soil conditioner
steadily and continuously increased corn yield by more than 10% for three years. At the same
time, the yield of wheat planted on castano-cinnamon soil increased by 15% based on a one-year
field test. Overall, the amount of conventional fertilizer used can be reduced to a certain extent
(20–50% in terms of weight) when the soil conditioner is added with fertilizer.
(2) After applying the soil conditioner on castano-cinnamon soil and dark brown soil, the contents of
As, Pb, Cr, Cd and Hg in various parts of corn did not increase significantly. In addition, most
of the BCFs and TFs of these five HMs remained unchanged or even declined. Furthermore,
the application of new fly ash-based soil conditioner on castano-cinnamon soil is able to limit
the migration of HMs from soil to plant so as to greatly reduce the risk of HMs contamination.
The application of new fly ash-based soil conditioners on dark brown soil did not significantly
increase the bioavailability of HMs. On the whole, the potential contamination risk of HMs
contained in new fly ash-based soil conditioner to the soil is negligible and can be ignored.
Author Contributions: Conceptualization, S.M.; Investigation, X.Z. and J.S.; Writing—original draft, Y.O.;
Writing—review & editing, Y.O., X.W. and Y.Z. All authors have read and agreed to the published version of
the manuscript.
Funding: This research was funded by Consulting Research Project of Chinese Academy of Engineering: Ningxia
Energy Chemical Solid Waste Disposal and Resource Utilization Strategy Research (2019NXZD4); Inner Mongolia
Science and Technology Major Project: Preparation and Application Demonstration of Fly Ash-based Soil
Conditioner; Inner Mongolia Daihai Power Generation Co., Ltd.: Study on the Occurrence Rule and Safe Removal
and Disposal Methods of Typical Heavy Metals in Fly Ash; Xilingol Professional College: Study on Preparation
and Application Technology of Fly Ash-based Grassland Restoration; Materials Research on Preparation and
Application Technology of Fly Ash-based Desert Improvement Materials.
Acknowledgments: This work was supported by Inner Mongolia Science and Technology Major Project:
Preparation and Application Demonstration of Fly Ash-based Soil Conditioner; Consulting Research Project of
Chinese Academy of Engineering: Ningxia Energy Chemical Solid Waste Disposal and Resource Utilization
Strategy Research (2019NXZD4); Inner Mongolia Daihai Power Generation Co., Ltd.: Study on the Occurrence
Rule and Safe Removal and Disposal Methods of Typical Heavy Metals in Fly Ash and Xilingol Professional
College: Study on Preparation and Application Technology of Fly Ash-based Grassland Restoration; Materials
Research on Preparation and Application Technology of Fly Ash-based Desert Improvement Materials. We wish to
thank the editor and the reviewers for their helpful suggestions and comments that greatly improve the research.
Conflicts of Interest: The authors declare no conflict of interest.Sustainability 2020, 12, 7281 15 of 16
References
1. Wang, S.B.; Boyjoo, Y.; Choueib, A.; Zhu, Z.H. Removal of dyes from aqueous solution using fly ash and red
mud. Water Res. 2005, 39, 129–138. [CrossRef] [PubMed]
2. Sun, L.Y.; Luo, K.X.; Fan, J.R.; Lu, H.L. Experimental study of extracting alumina from coal fly ash using
fluidized beds at high temperature. Fuel 2017, 199, 22–27. [CrossRef]
3. Malhotra, V.M. Durability of concrete incorporating high-volume of low-calcium (ASTM Class F) fly ash.
Cem. Concr. Compos. 1990, 12, 271–277. [CrossRef]
4. Li, G.; Wang, B.D.; Sun, Q.; Xu, W.Q.; Ma, Z.; Wang, H.Y.; Zhang, D.J.; Zhou, J.L. Novel synthesis of
fly-ash-derived Cu-loaded SAPO-34 catalysts and their use in selective catalytic reduction of NO with NH3.
Green Energy Environ. 2019, 4, 470–482. [CrossRef]
5. Teixeira, E.R.; Mateus, R.; Camoes, A.F.; Bragança, L.; Branco, F.G. Comparative environmental life-cycle
analysis of concretes using biomass and coal fly ashes as partial cement replacement material. J. Clean. Prod.
2016, 112, 2221–2230. [CrossRef]
6. Ding, J.; Ma, S.K.H.; Shen, S.; Xie, Z.L.; Zheng, S.L.; Zhang, Y. Research and industrialization progress of
recovering alumina from fly ash: A concise review. Waste Manag. 2017, 60, 375–387. [CrossRef]
7. Ding, J.; Yang, L.; Zheng, S.L.; Zhang, Y.; Xie, Z.L.; Shen, S.; Liu, Z.K. Study of extracting alumina from
high-alumina PC fly ash by a hydro-chemical process. Hydrometallurgy 2016, 161, 58–64. [CrossRef]
8. Shaheen, S.M.; Hooda, P.S.; Tsadilas, C.D. Opportunities and challenges in the use of coal fly ash for soil
improvements—A review. J. Environ. Manag. 2014, 145, 249–267. [CrossRef]
9. Song, M.; Lin, S.; Takahashi, F. Coal fly ash amendment to mitigate soil water evaporation in arid/semi-arid
area: An approach using simple drying focusing on sieve size and temperature. Resour. Conserv. Recycl.
2020, 156, 104726. [CrossRef]
10. Prakash, K.; Sridharan, A. Beneficial properties of coal ashes and effective solid waste management.
Prac. Period. Hazard. Toxic Radioact. Waste Manag. 2009, 13, 239–248. [CrossRef]
11. Gollakota, A.R.; Volli, V.; Shu, C.M. Progressive utilisation prospects of coal fly ash: A review. Sci. Total
Environ. 2019, 672, 951–989. [CrossRef] [PubMed]
12. Lee, D.S.; Lim, S.S.; Park, H.J.; Yang, H.I.; Park, S.I.; Kwak, J.H.; Choi, W.J. Fly ash and zeolite decrease metal
uptake but do not improve rice growth in paddy soils contaminated with Cu and Zn. Environ. Int. 2019, 129,
551–564. [CrossRef] [PubMed]
13. Munir, M.A.M.; Liu, G.; Yousaf, B.; Ali, M.U.; Abbas, Q.; Ullah, H. Synergistic effects of biochar and processed
fly ash on bioavailability, transformation and accumulation of heavy metals by maize (Zea mays L.) in
coal-mining contaminated soil. Chemosphere 2020, 240, 124845. [CrossRef]
14. Khan, I.; Umar, R. Environmental risk assessment of coal fly ash on soil and groundwater quality, Aligarh,
India. Groundw Sustain. Dev. 2019, 8, 346–357. [CrossRef]
15. Singh, A.; Sarkar, A.; Agrawal, S.B. Assessing the potential impact of fly ash amendments on Indian paddy
field with special emphasis on growth, yield, and grain quality of three rice cultivars. Environ. Monit. Assess.
2012, 184, 4799–4814. [CrossRef]
16. Lim, S.S.; Lee, D.S.; Kwak, J.H.; Park, H.J.; Kim, H.Y.; Choi, W.J. Fly ash and zeolite amendments increase soil
nutrient retention but decrease paddy rice growth in a low fertility soil. J. Soils Sediments 2016, 16, 756–766.
[CrossRef]
17. Ma, S.; Nan, H.; Wang, X.; Ding, J. The novel properties of a new inorganic water-retaining product made
from coal fly ash. In Proceedings of the World of Coal Ash Conference, St. Louis, MO, USA, 13–16 May 2019.
18. Ma, S.H.; Xu, M.D.; Qi, Q.G.; Wang, X.H.; Ding, J.; Shi, J.P.; Che, L.M.G.; Zhao, Z.Q.; Zheng, S.L. A Soil
Conditioner and its Preparation Method. CN108239536A, 3 July 2018.
19. Yin, P.; Shi, L. Remediation of Cd, Pb, and Cu-contaminated agricultural soil using three modified industrial
by-products. Water Air Soil Pollut. 2014, 225, 2194. [CrossRef]
20. Ahmad, M.; Usman, A.R.; Al-Faraj, A.S.; Ahmad, M.; Sallam, A.; Al-Wabel, M.I. Phosphorus-loaded biochar
changes soil heavy metals availability and uptake potential of maize (Zea mays L.) plants. Chemosphere 2017,
194, 327–339. [CrossRef]
21. Chojnacka, K.; Chojnacki, A.; Górecka, H.; Górecki, H. Bioavailability of heavy metals from polluted soils to
plants. Sci. Total Environ. 2005, 337, 175–182. [CrossRef]Sustainability 2020, 12, 7281 16 of 16
22. Noli, F.; Tsamos, P. Concentration of heavy metals and trace elements in soils, waters and vegetables and
assessment of health risk in the vicinity of a lignite-fired power plant. Sci. Total Environ. 2016, 563–564,
377–385. [CrossRef]
23. Manivannan, A.; Ahn, Y.-K. Silicon regulates potential genes involved in major physiological processes in
plants to combat stress. Front. Plant Sci. 2017, 8, 1346. [CrossRef] [PubMed]
24. Zama, E.F.; Reid, B.J.; Sun, G.X.; Yuan, H.Y.; Li, X.M.; Zhu, Y.G. Silicon (Si) biochar for the mitigation of
arsenic (As) bioaccumulation in spinach (Spinacia oleracean) and improvement in the plant growth. J. Clean.
Prod. 2018, 189, 386–395. [CrossRef]
© 2020 by the authors. Licensee MDPI, Basel, Switzerland. This article is an open access
article distributed under the terms and conditions of the Creative Commons Attribution
(CC BY) license (http://creativecommons.org/licenses/by/4.0/).You can also read