High expression of hypoxia inducible factor 1α related with acquired resistant to EGFR tyrosine kinase inhibitors in NSCLC
←
→
Page content transcription
If your browser does not render page correctly, please read the page content below
www.nature.com/scientificreports
OPEN High expression of hypoxia
inducible factor 1α related
with acquired resistant to EGFR
tyrosine kinase inhibitors in NSCLC
Qian Jin1, Feihua Huang1, Xianrong Xu1, Haidong He1 & Yingqing Zhang2*
The acquired resistance of the first generation epidermal growth factor receptor-tyrosine kinase
inhibitors (EGFR-TKIs) is a main factor leading to poor prognosis of non-small cell lung cancer (NSCLC),
so we researched whether the high expression of hypoxia-inducible factor-1α (HIF-1α) in EGFR-TKIs
sensitive NSCLC tissue tends to induce the acquired resistance. We detected the HIF-1α in normal lung
tissue, EGFR-TKIs sensitive NSCLC tissue, the first generation EGFR-TKIs acquired resistant NSCLC
tissue and acquired EGFR T790M mutation NSCLC tissue with the method of immunohistochemistry.
Then, we compared the expression of HIF-1α in these tissues, and evaluate the effect of HIF-1α
expression to the occurrence of acquired resistance. The expression of HIF-1α was much higher in
the EGFR-TKIs sensitive NSCLC tissue than that in normal lung tissue. HIF-1α level became higher
after the occurrence acquired resistance. There was negative correlation between HIF-1α level before
receiving treatment and the time of acquired resistance occurring as well as the acquired EGFR T790M
mutation occurring. As the treatment going on, EGFR-TKIs sensitivity rate of low HIF-1α level group
was much higher than that of high level group. The high expression of HIF-1α related with the acquired
resistance of the first generation EGFR-TKIs, and HIF-1α can be a biomarker to predict the early
occurrence of acquired resistance.
In clinical treatment of non-small cell lung cancer (NSCLC), the acquired resistance of the first generation epi-
dermal growth factor receptor-tyrosine kinase inhibitors (EGFR-TKIs) is a main factor leading to poor prognosis
of NSCLC1. Hypoxia is an important character of solid tumors. Compared with tumors in oxygen-rich condition,
tumors in hypoxic condition are more resistant to anti-tumor therapy, more invasive, more instable of genetic
substance, more resistant to apoptosis and more potential for m etastasis2. The mechanism of these effects refers
to hypoxia-inducible factors (HIFs), especially HIF-13.
HIF-1 signal pathway is the most important signal pathway activated in the hypoxic condition. HIF-1 contain
α submit and β submit. The α protein, as the functional part of HIF-1, is oxygen sensitive submit expressing in
hypoxic condition. The β submit is identical to aryl hydrocarbon nuclear translocator. There are more than one
hundred downstream genes activated by HIF-1 signal pathway. In order to adapt the tumor’s need of survival
and proliferation, proteins encoded by these genes participate in vascular growth of tumor, cell proliferation,
survival, invasion and therapy r esistance4–6. In these genes, MDR1, MET and ATP binding cassette transporter
G2 gene are related with the therapy resistance of t umor7.
Previous researches indicated that the activation of HIF-1 signal pathway may induce the acquired resistance
of other solid tumors to targeted therapy8–15. In EGFR-TKIs acquired resistant NSCLC cell lines, the expression
of HIF-1α was much higher than that in EGFR-TKIs sensitive cell l ines16. In NSCLC cell line with obvious effect
to targeted therapy, the level of HIF-1α was significantly decreased, vice versa. Through artificially transfecting
mutant with HIF-1α constitutive expression to NSCLC cell lines, the expression of HIF-1α became much higher,
and the resistance of NSCLC to cetuximab was induced17.
Therefore, it has significance to research the effect of HIF-1 signal pathway in the acquired resistance of
NSCLC target therapy. Clinical researches seldom detect the expression of HIF-1α in EGFR-TKIs sensitive and
acquired resistant human NSCLC tissue. Thus, we designed this research, and hoped to identify the expression
and clinical significance of HIF-1α in the first generation EGFR-TKIs sensitive and acquired resistant NSCLC.
1
Department of Respiratory Medicine, Tongde Hospital of Zhejiang Province, Hangzhou, Zhejiang 310012,
People’s Republic of China. 2Department of Respiratory Medicine, The First Hospital of Jiaxing, No. 1882 South
Zhonghuan Road, Jiaxing, Zhejiang 314000, People’s Republic of China. *email: zyqfei@sina.com
Scientific Reports | (2021) 11:1199 | https://doi.org/10.1038/s41598-020-79801-1 1
Vol.:(0123456789)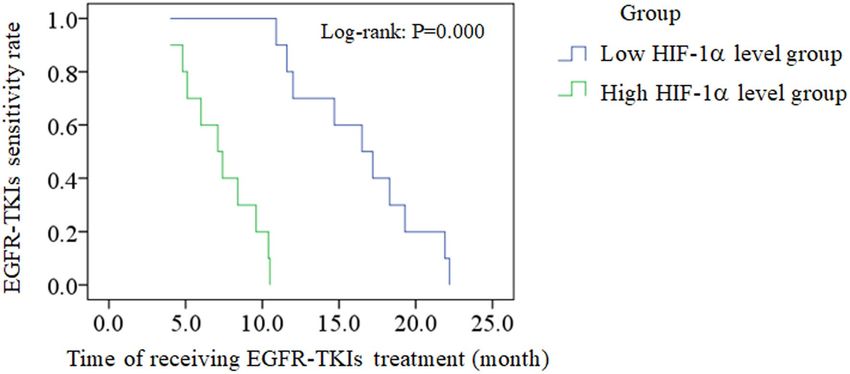
www.nature.com/scientificreports/

                                             Category                             Control group   EGFR sensitive mutation group   EGFR-TKIs treatment group   P value
                                             Subjects (n)                         96              233                             103
                                             Age (years, median (P25th, P75th))   68 (63, 73)     69 (59, 76)                     69 (57, 76)                 0.287
                                             Gender                                                                                                           0.336
                                             Male (n, %)                          43 (44.8)       91 (39.1)                       58 (56.3)
                                             Femal (n, %)                         53 (55.2)       142 (60.9)                      45 (43.7)
                                             Smoking                                                                                                          0.870
                                             Never (n, %)                         63 (65.6)       150 (64.4)                      53 (51.5)
                                             Ex and current (n, %)                33 (34.4)       83 (35.6)                       50 (48.5)
                                             Clinical stage
                                             I–IIIA (n, %)                                        130 (55.8)                      0 (0)
                                             IIIB–IV (n, %)                                       103 (44.2)                      103 (100)
                                             Pathological type
                                             Squamous cell carcinoma (n, %)                       12 (5.2)                        5 (4.9)
                                             Adenocarcinoma (n, %)                                220 (94.4)                      97 (94.2)
                                             Adeno-squamous carcinoma (n, %)                      1 (0.4)                         1 (1.0)
                                             EGFR sensitive mutation type
                                             19del mutation (n, %)                                103 (44.2)                      51 (49.5)
                                             L858R mutation (n, %)                                122 (52.4)                      49 (47.6)
                                             Rare mutation (n, %)                                 8 (3.4)                         3 (2.9)
                                             EGFR-TKIs
                                             Gefitinib (n, %)                                                                     31 (30.1)
                                             Erlotinib (n, %)                                                                     5 (4.9)
                                             Icotinib (n, %)                                                                      67 (65)

                                            Table 1.  The clinical characteristics of EGFR sensitive mutation group, control group and EGFR-TKIs
                                            treatment group. P value for comparison between EGFR sensitive mutation group and control group.

                                            Figure 1.  The tissue HIF-1 expression. (a) The negative HIF-1α expression of a normal lung tissue through
                                            immunohistochemical method (× 400). (b) The moderately positive HIF-1α expression of an EGFR-TKIs
                                            sensitive mutation NSCLC tissue through immunohistochemical method (× 400). (c) The strongly positive
                                            HIF-1α expression of EGFR-TKIs acquired resistant NSCLC tissue through immunohistochemical method
                                            (× 400).

                                            Results
                                            Study characteristics. A total of 233 EGFR sensitive mutation NSCLC patients and 96 controls were
                                            included in the study. 103 EGFR sensitive mutation NSCLC patients received treatment of the first genera-
                                            tion EGFR-TKIs and were followed up for 30 months. Within the follow up period, none of the patients was
                                            lost to follow-up. But one patient died of acute myocardial infarction at the time of 8.1 month and one died of
                                            cerebrovascular accident at the time of 5.6 month. Related data were considered as censored data. In patients
                                            with EGFR-TKIs acquired resistance occurring in 30 months, totally 41 patients received a second biopsy and
                                            EGFR gene mutation detection showed that 20 patients were with acquired EGFR T790M mutation. EGFR-TKIs
                                            acquired resistant NSCLC tissues were collected. Demographics and clinical characteristics of these participants
                                            were shown in Table 1. EGFR sensitive mutation group and control group had no differences on age, sex and
                                            smoking.

                                            The tissue HIF‑1α expression through immunohistochemical method. The typical pictures of
                                            tissue HIF-1α expression were shown in Fig. 1. Immunohistochemical method was used to test the expression

          Scientific Reports |   (2021) 11:1199 |                    https://doi.org/10.1038/s41598-020-79801-1                                                         2

Vol:.(1234567890)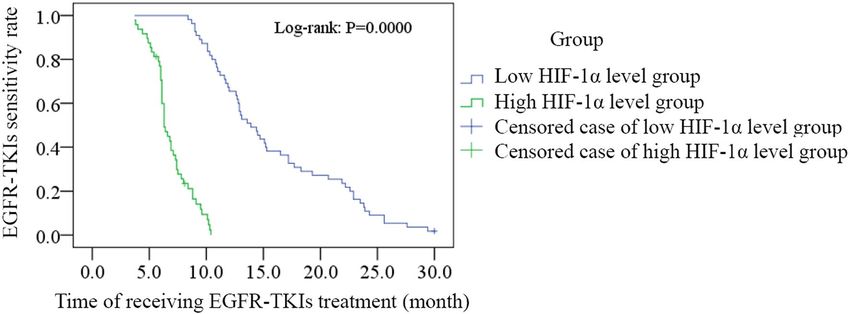
www.nature.com/scientificreports/
HIF-1α expression score
Group Median (P25th, P75th) P value
EGFR sensitive mutation group (n = 233) 6 (3, 8) < 0.000*
EGFR-TKIs treatment group (n = 103) 6 (3, 9) < 0.000*
Control group (n = 96) 2 (1, 3)
Table 2. The expression of HIF-1α in EGFR sensitive mutation group, EGFR-TKIs treatment group and
control group. *Compare with control group.
HIF-1α expression score Median (P25th, P75th)
Group Before EGFR-TKIs treatment After EGFR-TKIs acquired resistance P value
Second biopsy group (n = 41) 6 (3, 8.5) 8 (6, 10.5) 0.000
T790M mutation group (n = 20) 5.5 (2.25, 8.5) 7.5 (5.25, 9.75) 0.012
Without T790M mutation (n = 21) 7 (3, 8.5) 9 (8, 11) 0.001
Table 3. The expression of HIF-1α in NSCLC tissues before receiving EGFR-TKIs treatment and after gaining
EGFR-TKIs acquired resistance for patients receiving a second biopsy.
of HIF-1α in different groups. Semiquantitative scoring method was used to calculate the result. The scores of
different groups were compared with Wilcoxon-Mann–Whitney test. HIF-1α level of EGFR sensitive mutation
group was much higher than that of control group (P = 0.000). HIF-1α level of EGFR-TKIs treatment group was
also higher than that of control group (P = 0.000). These results were shown in Table 2. For 41 cases receiving a
second biopsy after gaining EGFR-TKIs acquired resistance in 30 months, the expression level of HIF-1α after
acquired resistance in NSCLC tissue was higher than that before receiving EGFR-TKIs treatment (P = 0.000,
Table 3). In these 41 patients, the expression level of HIF-1α after acquired resistance was higher than that before
receiving EGFR-TKIs treatment for both T790M mutation group and without T790M mutation group (P = 0.012
and 0.001, respectively, Table 3). In 41 patients receiving a second biopsy, there were 31 (75.6%) patients had
elevated HIF-1α expression after acquired resistance compared with the expression before treatment. For 31
patients with elevated HIF-1α expression and 10 patients with no HIF-1α expression elevating after acquired
resistance, demographics and clinical characteristics were compared for them to find out whether patients with
certain characteristic were tend to have HIF-1α elevating after EGFR-TKIs treatment, but the statistical analysis
showed there was no characteristics difference between two groups (all P > 0.05, Table 4).
Relationship between HIF‑1α expression and tumor stage and correlation between HIF‑1α
expression and tumor diameter. Kruskal–Wallis rank sum test was used to analyze the difference of
HIF-1α expression among clinical tumor stages. For EGFR sensitive mutation cases, EGFR-TKIs treatment
cases, receiving second biopsy cases and T790M mutation cases (both HIF-1α level before treatment and after
acquired resistance were analyzed for second biopsy cases and T790M mutation cases), there was no different
HIF-1α expression among tumor stages (P = 0.320, 0.137, 0.510, 0.216, 0.547 and 0.207, respectively, Table 5).
Pearson’s correlation analysis also showed that there was no correlation between HIF-1α expression and tumor
stage in various groups (all P > 0.05 and all R
2 < 0.3, Table 5). For correlation between HIF-1α expression and
tumor diameter of biopsy site (diameter was the average of long and short diameter) in various groups, Pearson’s
correlation analysis showed no significant correlation (all P > 0.05, and all R 2 < 0.3 except R2 = 0.469 of EGFR
sensitive mutation group, Table 6).
Correlation between HIF‑1α expression and EGFR‑TKIs acquired resistance. For 103 cases
receiving EGFR-TKIs treatment and 20 cases with acquired EGFR T790M mutation, linear correlation analy-
sis was adopted to evaluate the correlation between the HIF-1α level before receiving treatment and the time
of EGFR-TKIs acquired resistance occurring, and both results showed the negative correlation (R = − 0.938,
P = 0.000, Fig. 2; R = − 0.955, P = 0.000, Fig. 3). According to the median level of HIF-1α in 103 EGFR-TKI sensi-
tive mutation patients before receiving treatment (median = 6), 103 patients were divided into low HIF-1α level
group (n = 55, ≤ median) and high HIF-1α level group (n = 48, > median). Vertical bars indicate cases with cen-
sored data (including non-NSCLC death cases and cases keeping sensitive to EGFR-TKIs in 30 months EGFR-
TKIs treatment). Then Kaplan–Meier survival analysis was conducted. As the treatment going on, EGFR-TKIs
sensitivity rate of low HIF-1α level group was much higher than that of high HIF-1α level group (log-rank:
P = 0.000, Fig. 4). For 20 cases with acquired EGFR T790M mutation, this Kaplan–Meier survival analysis was
also performed, and EGFR-TKIs acquired resistance happened in a much shorter time of high HIF-1α level
group than that of low HIF-1α level group (log-rank: P = 0.000, Fig. 5). For 103 cases receiving EGFR-TKIs treat-
ment, clinical characteristics were analyzed by multivariate Cox regression analysis to identify if they were influ-
encing factors of EGFR-TKIs acquired resistance occurring. During these clinical characteristics, only HIF-1α
level and EGFR-TKI type had statistical significance (P = 0.000 and P = 0.007, respectively). Then Kaplan–Meier
survival curves were drawn for the clinical characteristics of EGFR-TKI type, and we found that the curves were
Scientific Reports | (2021) 11:1199 | https://doi.org/10.1038/s41598-020-79801-1 3
Vol.:(0123456789)www.nature.com/scientificreports/
Category Elevated HIF-1α group No HIF-1α elevating group P value
Subjects (n) 31 10
Age (years, median (P25th, P75th)) 68 (55, 75) 71 (68.25, 74.5) 0.224
Gender 0.414
Male (n, %) 17 (54.8) 4 (40)
Femal (n, %) 14 (45.2) 6 (60)
Smoking 0.379
Never (n, %) 17 (54.8) 7 (70)
Ex and current (n, %) 14 (45.2) 3 (30)
Clinical stage
IIIB–IIIC (n, %) 10 (32.3) 6 (60) 0.118
IVA–IVB (n, %) 21 (67.7) 4 (40)
Pathological type
Squamous cell carcinoma (n, %) 2 (6.5) 0 (0) 0.793
Adenocarcinoma (n, %) 29 (93.5) 10 (100)
EGFR sensitive mutation type
19del mutation (n, %) 16 (51.6) 4 (10) 0.523
L858R mutation (n, %) 15 (48.4) 6 (60)
EGFR-TKIs
Gefitinib (n, %) 10 (32.3) 2 (20) 0.459
Icotinib (n, %) 21 (67.7) 8 (80)
Table 4. The clinical characteristics comparison of elevated HIF-1α group and no HIF-1α elevating group in
41 patients receiving a second biopsy.
Correlation
Comparison analysis analysis
Group P value P value R2 value
EGFR sensitive mutation group (n = 233) 0.320 0.131 0.010
EGFR-TKIs treatment group (n = 103) 0.137 0.482 0.005
Second biopsy group before treatment (n = 41) 0.510 0.244 0.035
Second biopsy group after acquired resistance (n = 41) 0.216 0.087 0.073
T790M mutation group before treatment (n = 20) 0.547 0.559 0.019
T790M mutation group after acquired resistance (n = 20) 0.207 0.146 0.114
Table 5. Relationship analysis between HIF-1α level and clinical stage through HIF-1α level comparison
analysis among stages and correlation analysis between stage and HIF-1α level.
Group P value R2 value
EGFR sensitive mutation group (n = 233) 0.056 0.469
EGFR-TKIs treatment group (n = 103) 0.982 0.292
Second biopsy group before treatment (n = 41) 0.754 0.183
Second biopsy group after acquired resistance (n = 41) 0.551 0.278
T790M mutation group before treatment (n = 20) 0.194 0.047
T790M mutation group after acquired resistance (n = 20) 0.218 0.165
Table 6. Pearson’s correlation analysis between tumor diameter and HIF-1α level.
crossed. At the same time, only 5 patients received erlotinib treatment in our study, so it had no significance to
point out which EGFR-TKI had worse outcome. Thus EGFR-TKI type was not an influencing factors of EGFR-
TKIs acquired resistance occurring. For the clinical characteristics of HIF-1α level, the high HIF-1α level before
treatment was able to cause a low EGFR-TKIs sensitivity rate after a period of EGFR-TKIs treatment. It is a
significant negative influencing factor (P = 0.000, HR = 0.045, Table 7). For 20 cases with acquired EGFR T790M
mutation, clinical characteristics were also analyzed by multivariate Cox regression analysis, and only HIF-1α
level had statistical significance (P = 0.042, HR = 0.004, Table 8).
Scientific Reports | (2021) 11:1199 | https://doi.org/10.1038/s41598-020-79801-1 4
Vol:.(1234567890)www.nature.com/scientificreports/
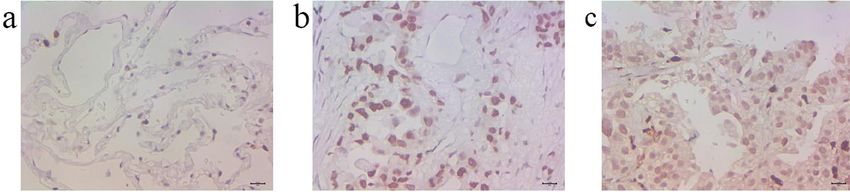
Figure 2. The correlation between the HIF-1α level before receiving treatment and the time of EGFR-TKIs
acquired resistance occurring for 103 cases receiving EGFR-TKIs treatment. Linear correlation analysis was
adopted to evaluate the correlation between the HIF-1α level before receiving treatment and the time of EGFR-
TKIs acquired resistance occurring, and the result showed the negative correlation (R = − 0.938, P = 0.000).
Figure 3. The correlation between the HIF-1α level before receiving treatment and the time of EGFR-TKIs
acquired resistance occurring for 20 cases with acquired EGFR T790M mutation. Linear correlation analysis was
adopted to evaluate the correlation between the HIF-1α level before receiving treatment and the time of EGFR-
TKIs acquired resistance occurring, and the result showed the negative correlation (R = − 0.955, P = 0.000).
Discussion
EGFR-TKIs have developed from the first generation to the third generation. The first generation EGFR-TKIs
is more efficient and more affordable, and it remains as the main target therapy medication for NSCLC with
advanced stage. Therefore, it is with significance to research the acquired resistance of the first generation EGFR-
TKIs. Previous researches have indicated the sensitivity influence of HIF-1α on target therapy of other solid
tumors9–15. Nevertheless, the influence of HIF-1α on EGFR target therapy of NSCLC needs further and more
researches.
In our study, the human EGFR gene 29 mutation fluorescence PCR diagnostic kit has excellent sensitivity and
specificity. It can also detect the rare mutation of EGFR. In previous researches, the sensitivity of the first genera-
tion EGFR-TKIs to the rare mutation of EGFR in NSCLC kept d iscordant20,21. The multivariate Cox regression
analysis identified that the type of EGFR mutation was not the influencing factor of the acquired resistance of
the first generation EGFR-TKIs.
In EGFR-TKIs sensitive NSCLC tissue, the expression of HIF-1α was higher than that in normal lung tis-
sue. This was accordant with previous r esearches16,17,22–24. NSCLC is a kind of solid tumor, and hypoxia is one
of its characteristics. NSCLC cells rapidly proliferated and formed a large size in a short time. Because of the
compression in the solid tumor, vessels were obstructed and hypoxia was present in the center area25. Cancer
cells in hypoxic condition activate related pathways to adapt the hypoxia, and the elevated HIF-1α level was the
indication of HIF-1α signal pathway a ctivation26.
Scientific Reports | (2021) 11:1199 | https://doi.org/10.1038/s41598-020-79801-1 5
Vol.:(0123456789)www.nature.com/scientificreports/
Figure 4. Kaplan–Meier analysis evaluated the EGFR-TKIs sensitivity rate of low HIF-1α level group and
high HIF-1α level group in 30 months for 103 cases receiving EGFR-TKIs treatment. 103 EGFR-TKI sensitive
mutation patients were divided into low HIF-1α level group (n = 55, ≤ median) and high HIF-1α level group
(n = 48, > median) according to the median level of HIF-1α before receiving treatment. Vertical bars indicate
cases with censored data. Kaplan–Meier survival analysis was conducted. As the treatment going on, EGFR-
TKIs sensitivity rate of low HIF-1α level group was much higher than that of high HIF-1α level group (log-rank:
P = 0.000).
Figure 5. Kaplan–Meier analysis evaluated the EGFR-TKIs sensitivity rate of low HIF-1α level group and high
HIF-1α level group in 30 months for 20 cases with acquired EGFR T790M mutation. 20 acquired EGFR T790M
mutation patients were divided into low HIF-1α level group (n = 10, ≤ median) and high HIF-1α level group
(n = 10, > median) according to the median level (median = 5.5) of HIF-1α before receiving treatment. Kaplan–
Meier survival analysis was conducted. EGFR-TKIs acquired resistance happened in a much shorter time of
high HIF-1α level group than that of low HIF-1α level group (log-rank: P = 0.000).
Clinical characteristics HR 95% CI P value
Age 0.925 0.591–1.447 0.731
Gender 0.653 0.351–1.215 0.178
Smoking 0.649 0.348–1.207 0.172
Clinical stage 1.016 0.658–1.569 0.944
EGFR sensitive mutation type 0.874 0.592–1.291 0.498
EGFR-TKI type 0.722 0.570–0.915 0.007
HIF-1α level 0.045 0.021–0.099 0.000
Table 7. Cox regression analysis of clinical characteristics as influencing factors of EGFR-TKIs acquired
resistance occurring for 103 cases receiving EGFR-TKIs treatment. HR hazard ratio, CI confidence interval.
Scientific Reports | (2021) 11:1199 | https://doi.org/10.1038/s41598-020-79801-1 6
Vol:.(1234567890)www.nature.com/scientificreports/
Clinical characteristics HR 95% CI P value
Age 0.984 0.125–7.738 0.987
Gender 1.098 0.443–2.718 0.840
Smoking 0.791 0.297–2.105 0. 639
Clinical stage 0.922 0.243–3.501 0.905
EGFR sensitive mutation type 0.869 0.347–2.173 0.764
EGFR-TKI type 0.825 0.278–2.452 0.729
HIF-1α level 0.004 0.000–1.324 0.042
Table 8. Cox regression analysis of clinical characteristics as influencing factors of EGFR-TKIs acquired
resistance occurring for 20 cases with acquired EGFR T790M mutation. HR hazard ratio, CI confidence
interval.
We also tested the HIF-1 level of NSCLC tissue after the resistance occurred. We found that the expression
of HIF-1α was much higher in EGFR-TKIs acquired resistant NSCLC tissues than that in EGFR-TKIs sensitive
NSCLC tissues before receiving the first generation EGFR-TKIs treatment. This result was accordant with pre-
vious research17. But this result can’t clarify causation. So we still can’t identify that it is the acquired resistance
of the first generation EGFR-TKIs caused the elevated level of HIF-1α in NSCLC tissue or the up-regulation of
HIF-1 signal pathway induced the acquired resistance. Thus we conducted Kaplan–Meier survival analysis to
further clarify the causation.
In our study, 103 EGFR sensitive mutation NSCLC patients were divided into low HIF-1α group and high
HIF-1α group according to the expression level of HIF-1α in NSCLC tissues before receiving EGFR-TKIs treat-
ment. Kaplan–Meier survival analysis was conducted base on this grouping. Through this analysis, we found that
EGFR-TKIs sensitive rate of low HIF-1α group became higher than that of high HIF-1α group as therapy time
passed. Patients of high HIF-1α group can present EGFR-TKIs acquired resistance in a short time. This result
was accordant with a previous research for cetuximab acquired r esistance17. Therefore, we concluded that high
expression of HIF-1α before receiving the first generation EGFR-TKIs therapy was able to induce the acquired
resistance of the first generation EGFR-TKIs. A series of previous researches indicated that the activation of
HIF-1 signal pathway induced the resistance of solid tumor to medication therapy. HIF-1 pathway achieved
this effect through many mechanisms. First, HIF-1 signal pathway changed the cell metabolism to adapt the
hypoxia condition27–30. Second, hypoxia disturbed the cell apoptosis and a utophagy31–33. Third, hypoxia led
to genome instabilitiy34–37. Fourth, hypoxia can induce epithelial-to-mesenchymal transition (EMT)38–43. Last,
hypoxia promotes the invasiveness and metastasis of tumor cells by regulating extracellular matrix dynamics44–49.
There are many confounding factors in clinical studies. Except the analysis for differences of age, gender and
smoking in different groups, we conducted Cox regression analysis to identify if age, gender, smoking, clinical
stage, EGFR sensitive mutation type, EGFR-TKIs type and HIF-1α level were influencing factors of EGFR-TKIs
acquired resistance occurring. Finally, only the P value of HIF-1α level was less than 0.0001, and the value of HR
was 0.045 which was much less than 1. This indicated that HIF-1α level was the influencing factor of EGFR-TKIs
acquired resistance occurring. Further, previous researches reported that HIF-1α may relate with tumor stage
and tumor s ize50. In our study, we analyzed the relationship between HIF-1α level and clinical stage, as well as
correlation between HIF-1α level and tumor diameter of biopsy site. However, our results for different groups
didn’t show obviously correlations. Thus, we didn’t think that tumor stage and tumor size were indirectly related
with the acquired EGFR-TKIs resistance according to the present data. For EGFR sensitive mutation group
containing 233 cases, the P value and R2 value of correlation analysis between tumor diameter and HIF-1α level
were 0.056 and 0.469, so we can’t absolutely deny the correlation. Maybe a larger sample size is needed to obtain
a statistically significant result. In addition, we found 31 patients with elevated HIF-1α expression after acquired
EGFR-TKIs resistance tended to have advanced stage, though its P value was 0.118 while the sample size was
very small (Table 4). It is possible that HIF-1α level in advanced stage NSCLC is easy to increase in the process
of EGFR-TKIs treatment, and these patients can obtain more benefits from anti-HIF-1 therapy in the future.
Further research with a large sample is necessary.
Our analysis results also suggested that HIF-1α might be the drug resistant factor for the first generation
EGFR-TKIs. However, no previous researches focused on HIF-1α as an initial drug resistant factor of EGFR-TKIs.
To clarify this, we reviewed the initial data of 103 patients receiving EGFR-TKIs treatment, and found that the
earliest time of acquired EGFR-TKIs resistance occurring was 3.7 months with a high HIF-1α expression score of
12 before receiving EGFR-TKI treatment. At least in this 3.7 months, the patient was sensitive to EGFR-TKI. For
other two patients with high HIF-1α expression score of 12 before receiving EGFR-TKIs treatment, their times
of acquired EGFT-TKIs resistance occurring were 4.4 and 3.8 months respectively. This indicated that HIF-1α
was not an initial drug resistant factor of the first generation EGFR-TKIs.
In acquired EGFR T790M mutation patients, HIF-1α level was elevated as well, and patients with high HIF-1α
level before receiving EGFR-TKIs treatment can also present acquired EGFR T790M mutation in a shorter time.
These results were obtained through a small sample size. It showed an obvious statistical significance. For other
mechanisms of acquired EGFR-TKIs resistance such as MET amplification, we didn’t perform statistical analy-
sis because of a very small sample size. However, there was no previous researches mentioned the correlation
between HIF-1 and T790M mutation. This discovery of HIF-1α and acquired T790M mutation here deserves
further research and potential mechanism research.
Scientific Reports | (2021) 11:1199 | https://doi.org/10.1038/s41598-020-79801-1 7
Vol.:(0123456789)www.nature.com/scientificreports/
Amplification site Primer Sequence
Forward primer TGTCCTGGCACCCAAGCCCATGCCGTGGCT
18 exon
Reverse primer GTGGGGAGCCCAGAGTCCTTGCAAGCTGTATA
Forward primer CAGTGTCCCTCACCTTCGGGGTGCATCGCT
19 exon
Reverse primer AACCTCAGGCCCACCTTTTCTCATGTCTGG
Forward primer GCCCTGCGTAAACGTCCCTGTGCTAGGTCT
20 exon
Reverse primer CACATGCGGTCTGCGCTCCTGGGATAGCAA
Forward primer CCATTCTTTGGATCAGTAGTCACTAACGT
21 exon
Reverse primer CCAGGCTGCCTTCCCACTAGCTGTATTG
Table 9. The primer sequences of EGFR 18–21 exons.
In conclusion, we identified the expression of HIF-1α in EGFR sensitive mutation NSCLC tissues, normal
lung tissues and the first generation EGFR-TKIs acquired resistant NSCLC tissues. Through this clinical research,
we also found that the expression level of HIF-1α was much higher after the acquired resistance occurred, and
patients with high HIF-1α level before receiving EGFR-TKIs treatment can present EGFR-TKIs acquired resist-
ance in a shorter time. These phenomena were also obvious in acquired EGFR T790M mutation patients. Thus,
we concluded that the high expression of HIF-1α related with the acquired resistance of the first generation
EGFR-TKIs, and HIF-1α can be a biomarker to predict the early occurrence of acquired resistance of the first
generation EGFR-TKIs.
Materials and methods
Study participants. This study contained EGFR sensitive mutation group and control group. 233 EGFR
sensitive mutation NSCLC patients and 96 controls with normal lung tissue were included in this study. Study
participants were collected from the First Hospital of Jiaxing City and Tongde Hospital of Zhejiang Province
between 06/2014 and 12/2017. EGFR sensitive mutation patients met the following inclusion criteria: (1) NSCLC
patients with definite pathologic diagnosis. (2) With EGFR sensitive mutation. (3) Without other malignancies.
(4) Asiatic race between 18 and 80 years old. Control group met the following inclusion criteria: (1) Perform-
ing bronchoscopy or lobectomy/segmentectomy because of lung nodule which was identified as pulmonary
fibroproliferative nodule after operation. (2) Without malignancy. (3) Asiatic race between 18 and 80 years old.
Exclusion criteria of participants: (1) Not Asiatic race. (2) Older than 80 years old or younger than 18 years old.
(3) With malignancy except NSCLC. Withdrawal criteria: (1) Diagnosed with other malignancy in 30 months
after included in study. (2) Died in 3 months after diagnosed with NSCLC.
Study design. For control group, the normal lung tissue near to the nodule was collected. For EGFR sensi-
tive mutation group, NSCLC tissue was obtained through surgery, bronchoscopy and percutaneous lung biopsy.
We took NSCLC tissues from the primary foci and avoiding the necrotic area. In EGFR sensitive mutation group,
patients receiving EGFR-TKIs treatment were defined as EGFR-TKIs treatment group and were designed to
follow up for 30 months. Follow-up was performed every month. We recorded when the EGFR-TKIs acquired
resistance occurred. EGFR-TKIs acquired resistance was defined as the end point. For patients occurred EGFR-
TKIs acquired resistance in 30 months, a second biopsy was recommeded to obtain EGFR-TKIs acquired resist-
ant NSCLC tissue. In this study, we tested and compared the level of HIF-1α in tissues of two groups through
immunohistochemical method. We also tested the level of HIF-1α in the tissues of NSCLC patients after the
occurrence of EGFR-TKIs acquired resistance, in order to compare it with that before receiving EGFR-TKIs
treatment. Through the data from follow-up, we analyzed the relationship between HIF-1α level and the time of
EGFR-TKIs acquired resistance occurring.
Detection of EGFR gene mutation. NSCLC tissues obtained through surgery, bronchoscopy and per-
cutaneous lung biopsy were collected and fixed in 10% neutral formalin fix solution for 48 h. After paraffin
embedding, 5 μm sections were prepared. DNA of NSCLC tissue was extracted according to the instruction of
DNA extraction Kit (Qiagen GmbH, Hilden, Germany). Human EGFR gene 29 mutation fluorescence poly-
merase chain reaction (PCR) diagnostic kit (Amoy Diagnostics Co.,Ltd., Xiamen, China) was used to detect the
EGFR gene mutation in these NSCLC specimens with the method of real-time PCR. DNA concentration was
adjusted to 3 ng/μl. 2.7 μl Taq polymerase was added into 42.3 μl DNA sample, positive control and purity water.
5 μl of these samples were added into 8-tube strip and centrifuged at 8000×g for 10 s, then putted into Applied
Biosystems 7500 Real-Time PCR system (Applied Biosystems, Foster City, CA, USA) for detection. The primer
sequences of EGFR 18–21 exons were shown in Table 9. EGFR gene amplification was designed as the following
procedure: 95 ℃ for 5 min, 1 cycle; 95 ℃ for 25 s, 64 ℃ for 20 s, 72 ℃ for 20 s, totally 15 cycles; 93 ℃ for 25 s,
60 ℃ for 35 s, 72 ℃ for 20 s, totally 31 cycles.
The EGFR gene mutation result was judged by two professional analysts. If the analysts gave different judg-
ment, a third analyst was invited to give a third judgment. The final result must be come from accordant judg-
ment of two analysts.
Scientific Reports | (2021) 11:1199 | https://doi.org/10.1038/s41598-020-79801-1 8
Vol:.(1234567890)www.nature.com/scientificreports/
Detection of tissue HIF‑1α expression through immunohistochemical method. The method of
collection and fixation of NSCLC tissue and normal lung tissue was the same with the method used in the detec-
tion of EGFR gene mutation. Paraffin sections were treated with heat mediated antigen retrieval after depar-
affinage and rehydration. Sections were put into citrate buffer solution. The temperature of citrate buffer solution
ranged from 92℃ to 98℃ for 10–15 min by microwave heating method. Then citrate buffer solution was put in
room temperature for 10–20 min and washed in PBS. Specimen sections were treated with immunohistochemi-
cal test according to the instruction of kit (Abcam, Cambridge, MA, USA). 0.5% TritonX-100 was added on sec-
tions at room temperature for 20 min and sections were washed in PBS for three times (3 min per time). Then
sections were treated with 3% H 2O2 at room temperature for 15 min and washed in PBS for three times (3 min
per time). Tissues on sections were blocked by goat serum at room temperature for 60 min and then incubated
with the rabbit polyclonal primary antibody (cat. no. ab231951; Abcam, Cambridge, MA, USA) overnight at
4 ℃ and at a dilution of 1:100. Negative control sections were incubated with non-immune rabbit serum instead
of rabbit polyclonal primary antibody. Sections were washed in PBS for three times (5 min per time) and then
incubated with the goat anti rabbit and horseradish peroxidase-labeled polyclonal secondary antibody (cat. no.
ab205718; Abcam, Cambridge, MA, USA) at 37℃ for 30 min and at a dilution of 1:60. Sequentially, sections were
washed in PBS for three times (5 min per time) and stained with 3,3′-diaminobenzidine for 3 to 10 min (avoid
light, observe tissues under microscope until it turn to brown). After staining, sections were washed in distilled
water for two times (5 min per time), re-stained with hematoxylin for 5 min, returned blue with tap water, dehy-
drated in a graded ethanol series (75%, 85%, 95% and 100% ethanol, 3 min for each concentration) and cleared
in xylene for two times (3 min per time). Finally, sections were enveloped with netural gum. Breast cancer tissue
with known positive expression served as a positive control.
All sections were observed under a light microscope. The result of immunohistochemical test was judged
by two professional analysts. If the analysts gave different judgment, a third analyst was invited to give a third
judgment. The final result must be come from accordant judgment of two analysts. The result was calculated
according to the semiquantitative scoring method18,19. Every section was observed for five high power fields ran-
domly. Then the positive cell percentage and the positive expression intensity were recorded. The scoring criteria
of the positive cell percentage: 0: Positive cell ≤ 5%; 1: Positive cell 6–25%; 2: Positive cell 26–50%; 3: Positive
cell 51–75%; 4: Positive cell ≥ 76%. The scoring criteria of the positive expression intensity: 0: No colorization; 1:
Yellow-colored; 2: Yellow brown-colored; 3: Dark brown-colored. Final result of HIF-1α immunohistochemical
test was acquired from the product of positive cell score and positive intensity score: 0: Negative (−); 1–4: Weakly
positive (+); 5–8: Moderately positive (++); 9–12: Strongly positive (+++).
Statistical analysis. Statistical analysis was carried out utilizing SPSS software (version 16.0.0, SPSS, Inc.,
Chicago, IL, USA). Age of participants and expression levels of HIF-1α in different groups were compared
using Wilcoxon-Mann–Whitney test. Sex, pathological type and smoking difference in groups were compared
with Pearson’s chi-squared test. The correlation analysis was performed with the Pearson’s correlation analysis.
HIF-1α level comparison between different clinical stages was analyzed with Kruskal–Wallis rank sum test.
Patients receiving EGFR-TKIs treatment were followed up for 30 months, and the median of HIF-1α expres-
sion level was used as the cut-off value for dichotomizing HIF-1α expression. The time of EGFR-TKIs acquired
resistance occurring was calculated from the date of collecting to the date of EGFR-TKIs acquired resistance
occurring or loss to follow-up. Survival curves (event was defined as EGFR-TKIs acquired resistance occurring)
were generated using the method of Kaplan–Meier. For the expression levels of HIF-1α in the tissues of NSCLC
patients before receiving EGFR-TKIs treatment and after EGFR-TKIs acquired resistance occurring, Wilcoxon
singed rank test of pair matching data was used to compare their difference. Clinical characteristics were ana-
lyzed by multivariate Cox regression analysis to identify if they were influencing factors of EGFR-TKIs acquired
resistance occurring. A P value < 0.05 was considered statistically significant.
Ethics approval and consent to participate. The study protocol was approved by the Ethical Com-
mittee of Tongde Hospital of Zhejiang Province (Q[2014]012) and the First Hospital of Jiaxing City (LS2014-
284), and all procedures performed in studies involving human participants were in accordance with the 1964
Helsinki declaration and its later amendments or comparable ethical standards. Written informed consent to
participate was obtained from all participants.
Consent for publication. Written informed consent for the publication of any associated data and accom-
panying images was obtained from all participants.
Data availability
The datasets used and analyzed during this study are available from the corresponding author on reasonable
request.
Received: 27 August 2020; Accepted: 14 December 2020
References
1. Zhang, K. & Yuan, Q. Current mechanism of acquired resistance to epidermal growth factor receptor-tyrosine kinase inhibitors
and updated therapy strategies in human nonsmall cell lung cancer. J. Cancer Res. Ther. 12, C131–C137 (2016).
2. Wilson, W. & Hay, M. Targeting hypoxia in cancer therapy. Nat. Rev. Cancer. 11, 393–410 (2011).
Scientific Reports | (2021) 11:1199 | https://doi.org/10.1038/s41598-020-79801-1 9
Vol.:(0123456789)www.nature.com/scientificreports/
3. Patiar, S. & Harris, A. L. Role of hypoxia-inducible factor-1 alpha as a cancer therapy target. Endocr. Relat. Cancer. 13(Suppl 1),
61–75 (2006).
4. Wigerup, C., Påhlman, S. & Bexell, D. Therapeutic targeting of hypoxia and hypoxia-inducible factors in cancer. Pharmacol. Ther.
164, 152–169 (2016).
5. Warfel, N. A. & El-Deiry, W. S. HIF-1 signaling in drug resistance to chemotherapy. Curr. Med. Chem. 21, 3021–3028 (2014).
6. Pennacchietti, S. et al. Hypoxia promotes invasive growth by transcriptional activation of the met protooncogene. Cancer Cell 3,
347–361 (2003).
7. Burroughs, S. K. et al. Hypoxia inducible factor pathway inhibitors as anticancer therapeutics. Future Med. Chem. 5(5), 553–572
(2013).
8. Ellis, L. M. & Hicklin, D. J. Resistance to targeted therapies: Refining anticancer therapy in the era of molecular oncology. Clin.
Cancer Res. 15(24), 7471–7478 (2009).
9. Messai, Y. et al. Renal cell carcinoma programmed death-ligand 1, a new direct target of hypoxia-inducible factor-2 alpha, is
regulated by von Hippel-Lindau gene mutation status. Eur. Urol. 70, 623–632 (2016).
10. Ruf, M., Moch, H. & Schraml, P. PD-L1 expression is regulated by hypoxia inducible factor in clear cell renal cell carcinoma. Int.
J. Cancer. 139, 396–403 (2016).
11. Noman, M. Z. et al. Tumor-promoting effects of myeloid-derived suppressor cells are potentiated by hypoxia-induced expression
of miR-210. Cancer Res. 75, 3771–3787 (2015).
12. Rustum, Y. M., Chintala, S., Durrani, F. A. & Bhattacharya, A. Non-coding micro RNAs and hypoxia-inducible factors are selenium
targets for development of a mechanism-based combination strategy in clear-cell renal cell carcinoma-bench-to-bedside therapy.
Int. J. Mol. Sci. 19(11), E3378 (2018).
13. Lin, H. et al. 2ME2 inhibits the activated hypoxia-inducible pathways by cabozantinib and enhances its efficacy against medullary
thyroid carcinoma. Tumour Biol. 37(1), 381–391 (2016).
14. Conley, S. J. et al. CRLX101, an investigational camptothecin-containing nanoparticle-drug conjugate, targets cancer stem cells
and impedes resistance to antiangiogenic therapy in mouse models of breast cancer. Breast Cancer Res. Treat. 150(3), 559–567
(2015).
15. Aghazadeh, S. & Yazdanparast, R. Activation of STAT3/HIF-1α/Hes-1 axis promotes trastuzumab resistance in HER2-overex-
pressing breast cancer cells via down-regulation of PTEN. Biochim. Biophys. Acta Gen. Subj. 1861(8), 1970–1980 (2017).
16. Morgillo, F. et al. Antitumour efficacy of MEK inhibitors in human lung cancer cells and their derivatives with acquired resistance
to different tyrosine kinase inhibitors. Br. J. Cancer. 105, 382–392 (2011).
17. Lu, Y., Liang, K., Li, X. & Fan, Z. Responses of cancer cells with wild-type or tyrosine kinase domain-mutated epidermal growth
factor receptor (EGFR) to EGFR-targeted therapy are linked to downregulation of hypoxia-inducible factor-1alpha. Mol. Cancer.
6, 63 (2007).
18. Allon, I. et al. HIF-1α, VEGF, and EGFR: Contributing factors in the pathogenesis of necrotizing sialometaplasia. Oral Dis. 20(5),
440–445 (2014).
19. Cao, W. D. et al. Relationship of 14-3-3zeta (ζ), HIF-1α, and VEGF expression in human brain gliomas. Brain Tumor. Pathol. 31(1),
1–10 (2014).
20. Huang, J., Wang, Y., Zhai, Y. & Wang, J. Non-small cell lung cancer harboring a rare EGFR L747P mutation showing intrinsic
resistance to both gefitinib and osimertinib (AZD9291): A case report. Thorac. Cancer. 9(6), 745–749 (2018).
21. Kozlov, V., Karpov, I., Kovalenko, S. & Shamanin, V. Adenocarcinoma of the lung with rare insertion mutation in EGFR exon 19
that had partial response to gefitinib: A case report. Exp. Oncol. 39(2), 155–156 (2017).
22. Murakami, A. et al. Hypoxia increases gefitinib-resistant lung cancer stem cells through the activation of insulin-like growth factor
1 receptor. PLoS ONE 9, 86459 (2014).
23. Xu, L. et al. Epidermal growth factor receptor regulates MET levels and invasiveness through hypoxia-inducible factor-1α in non-
small cell lung cancer cells. Oncogene 29, 2616–2627 (2010).
24. Meng, S., Wang, G., Lu, Y. & Fan, Z. Functional cooperation between HIF-1α and c-Jun in mediating primary and acquired resist-
ance to gefitinib in NSCLC cells with activating mutation of EGFR. Lung Cancer. 121, 82–90 (2018).
25. Powis, G. & Kirkpatrick, L. Hypoxia inducible factor-1 alpha as a cancer drug target. Mol. Cancer Ther. 3, 647–654 (2004).
26. Wang, G. L. & Semenza, G. L. Purification and characterization of hypoxia-inducible factor 1. J. Biol. Chem. 270(3), 1230–1237
(1995).
27. Semenza, G. L. HIF-1: upstream and downstream of cancer metabolism. Curr. Opin. Genet. Dev. 20(1), 51–56 (2010).
28. Kim, J. W., Tchernyshyov, I., Semenza, G. L. & Dang, C. V. HIF-1-mediated expression of pyruvate dehydrogenase kinase: A
metabolic switch required for cellular adaptation to hypoxia. Cell Metab. 3(3), 177–185 (2006).
29. Gao, P. et al. HIF-dependent antitumorigenic effect of anti-oxidants in vivo. Cancer Cell 12(3), 230–238 (2007).
30. Santos, C. R. & Schulze, A. Lipid metabolism in cancer. FEBS J. 279(15), 2610–2623 (2012).
31. Notte, A., Ninane, N., Arnould, T. & Michiels, C. Hypoxia counteracts taxol-induced apoptosis in MDA-MB-231 breast cancer
cells: role of autophagy and JNK activation. Cell Death Dis. 4(5), e638 (2013).
32. Mazure, N. M. & Pouysségur, J. Hypoxia-induced autophagy: Cell death or cell survival?. Curr. Opin. Cell Biol. 22(2), 177–180
(2010).
33. Bellot, G. et al. Hypoxia-induced autophagy is mediated through hypoxia-inducible factor induction of BNIP3 and BNIP3L via
their BH3 domains. Mol. Cell Biol. 29(10), 2570–2581 (2009).
34. Luoto, K. R., Kumareswaran, R. & Bristow, R. G. Tumor hypoxia as a driving force in genetic instability. Genome Integr. 4(1), 5
(2013).
35. Shammas, M. A. et al. Dysfunctional homologous recombination mediates genomic instability and progression in myeloma. Blood
113(10), 2290–2297 (2009).
36. Bindra, R. S. et al. Down-regulation of Rad51 and decreased homologous recombination in hypoxic cancer cells. Mol. Cell Biol.
24(19), 8504–8518 (2004).
37. Nakamura, H. et al. Human mismatch repair gene, MLH1, is transcriptionally repressed by the hypoxia-inducible transcription
factors, DEC1 and DEC2. Oncogene 27(30), 4200–4209 (2008).
38. Jiang, J., Tang, Y. L. & Liang, X. H. EMT: a new vision of hypoxia promoting cancer progression. Cancer Biol. Ther. 11(8), 714–723
(2011).
39. Tang, C. et al. Transcriptional regulation of FoxM1 by HIF-1α mediates hypoxia-induced EMT in prostate cancer. Oncol. Rep.
42(4), 1307–1318 (2019).
40. Kalluri, R. & Weinberg, R. A. The basics of epithelial-mesenchymal transition. J. Clin. Invest. 119(6), 1420–1428 (2009).
41. Zavadil, J. & Böttinger, E. P. TGF-beta and epithelial-to-mesenchymal transitions. Oncogene 24(37), 5764–5774 (2005).
42. Wang, Z., Li, Y., Kong, D. & Sarkar, F. H. The role of Notch signaling pathway in epithelial-mesenchymal transition (EMT) during
development and tumor aggressiveness. Curr. Drug Targets. 11(6), 745–751 (2010).
43. Pear, W. S. & Simon, M. C. Lasting longer without oxygen: The influence of hypoxia on Notch signaling. Cancer Cell 8(6), 435–437
(2005).
44. Lu, P., Weaver, V. M. & Werb, Z. The extracellular matrix: A dynamic niche in cancer progression. J. Cell Biol. 196(4), 395–406
(2012).
Scientific Reports | (2021) 11:1199 | https://doi.org/10.1038/s41598-020-79801-1 10
Vol:.(1234567890)www.nature.com/scientificreports/
45. Kauppila, S., Stenbäck, F., Risteli, J., Jukkola, A. & Risteli, L. Aberrant type I and type III collagen gene expression in human breast
cancer in vivo. J. Pathol. 186(3), 262–268 (1998).
46. Liu, S. S., Wang, H. Y., Tang, J. M. & Zhou, X. M. Hypoxia-induced collagen synthesis of human lung fibroblasts by activating the
angiotensin system. Int. J. Mol. Sci. 14(12), 24029–24045 (2013).
47. Gilkes, D. M., Bajpai, S., Chaturvedi, P., Wirtz, D. & Semenza, G. L. Hypoxia-inducible factor 1 (HIF-1) promotes extracellular
matrix remodeling under hypoxic conditions by inducing P4HA1, P4HA2, and PLOD2 expression in fibroblasts. J. Biol. Chem.
288(15), 10819–10829 (2013).
48. Erler, J. T. & Giaccia, A. J. Lysyl oxidase mediates hypoxic control of metastasis. Cancer Res. 66(21), 10238–10241 (2006).
49. Muñoz-Nájar, U. M., Neurath, K. M., Vumbaca, F. & Claffey, K. P. Hypoxia stimulates breast carcinoma cell invasion through
MT1-MMP and MMP-2 activation. Oncogene 25(16), 2379–2392 (2006).
50. Ren, W. et al. The expression of hypoxia-inducible factor-1alpha and its clinical significance in lung cancer: A systematic review
and meta-analysis. Swiss Med. Wkly. 143, w13855 (2013).
Acknowledgements
The authors would like to thank Professor Kequn Chai, Professor Jianying Zhou, Miss Guizhi Zhao and the
Scientific Research and Education Department staff of the First Hospital of Jiaxing (Jiaxing, China) and Tongde
Hospital of Zhejiang Province (Hangzhou, China) for providing advice and technical assistance for the present
study.
Author contributions
Q.J. and Y.Z. developed the research idea, designed this research and wrote the manuscript. F.H. and X.X. con-
tributed to discussion and reviewed the manuscript, and analysis the data. H.H. took responsible for the data
collection and immunohistochemistry. All authors reviewed the manuscript.
Competing interests
The authors declare no competing interests.
Additional information
Correspondence and requests for materials should be addressed to Y.Z.
Reprints and permissions information is available at www.nature.com/reprints.
Publisher’s note Springer Nature remains neutral with regard to jurisdictional claims in published maps and
institutional affiliations.
Open Access This article is licensed under a Creative Commons Attribution 4.0 International
License, which permits use, sharing, adaptation, distribution and reproduction in any medium or
format, as long as you give appropriate credit to the original author(s) and the source, provide a link to the
Creative Commons licence, and indicate if changes were made. The images or other third party material in this
article are included in the article’s Creative Commons licence, unless indicated otherwise in a credit line to the
material. If material is not included in the article’s Creative Commons licence and your intended use is not
permitted by statutory regulation or exceeds the permitted use, you will need to obtain permission directly from
the copyright holder. To view a copy of this licence, visit http://creativecommons.org/licenses/by/4.0/.
© The Author(s) 2021
Scientific Reports | (2021) 11:1199 | https://doi.org/10.1038/s41598-020-79801-1 11
Vol.:(0123456789)You can also read