Identification of novel neuroblastoma biomarkers in urine samples
←
→
Page content transcription
If your browser does not render page correctly, please read the page content below
www.nature.com/scientificreports
OPEN Identification of novel
neuroblastoma biomarkers in urine
samples
Kazuki Yokota1, Hiroo Uchida1*, Minoru Sakairi2,3, Mayumi Abe2, Yujiro Tanaka1,
Takahisa Tainaka1, Chiyoe Shirota1, Wataru Sumida1, Kazuo Oshima1, Satoshi Makita1,
Hizuru Amano1 & Akinari Hinoki1,3
Urine is a complex liquid containing numerous small molecular metabolites. The ability to non-
invasively test for cancer biomarkers in urine is especially beneficial for screening child patients.
This study attempted to identify neuroblastoma biomarkers by comprehensively analysing urinary
metabolite samples from children. A total of 87 urine samples were collected from 54 participants
(15 children with neuroblastoma and 39 without cancer) and used to perform a comprehensive
analysis. Urine metabolites were extracted using liquid chromatography/mass spectrometry and
analysed by Metabolon, Inc. Biomarker candidates were extracted using the Wilcoxon rank sum test,
random forest method (RF), and orthogonal partial least squares discriminant analysis (OPLS-DA).
RF identified three important metabolic pathways in 15 samples from children with neuroblastoma.
One metabolite was selected from each of the three identified pathways and combined to create a
biomarker candidate (3-MTS, CTN, and COR) that represented each of the three pathways; using
this candidate, all 15 cases were accurately distinguishable from the control group. Two cases in
which known biomarkers were negative tested positive using this new biomarker. Furthermore,
the predictive value did not decrease in cases with a low therapeutic effect. This approach could be
effectively applied to identify biomarkers for other cancer types.
Childhood cancers are rare, accounting for less than 1% of all cancers, but are the second leading cause of
childhood death after road a ccidents1. Therefore, early cancer detection methods are urgently needed. Current
approaches include blood tests and imaging studies, such as CT or PET. However, these tests are invasive and
involve pain, radiation exposure, and sedation. Recent studies on liquid biopsy have been sequentially conducted
using minimally invasive sampling techniques2, but generally use blood samples. For children in particular,
simple and minimally invasive testing is desirable.
Urine is a complicated and variegated fluid that contains numerous small molecular m etabolites3–5. There
has been significant progress in recent research into the use of urine-derived metabolites for cancer testing,
such as polyamines or micro RNA4,5. In addition, metabolomics research continues to p rogress4,6–12. Using
blood, tissue, bile, and urine samples, metabolomics technology has been used to explore biomarkers for colo-
rectal, breast, bile duct, bladder, and liver c ancers3,4,8–12. In metabolomics studies, liquid chromatography/mass
spectrometry (LC/MS) is often initially used to extract numerous metabolites. Candidate biomarkers are then
selected from the many metabolites obtained in the first step. The following method has been successfully used
to identify biomarkers for urinary system cancer, breast cancer, and colon c ancer3,4,7,8. Identified metabolites are
first ranked by a machine learning method called the random forest method (RF)4,9. Orthogonal partial least
squares discriminant analysis (OPLS-DA) is then used to discriminate between groups with or without cancer
and evaluate biomarker validity4,7,9,10,12. However, all previous studies included only adult patients. Therefore,
additional information specific to childhood cancer is required. Neuroblastoma is the most common childhood
extracranial malignant solid tumour, comprising between 8 and 10% of all childhood cancers deriving from
the adrenal medulla and paravertebral sympathetic g anglia13. It is the only childhood cancer for which urinary
tumour markers are clinically u sed13,14.
1
Department of Paediatric Surgery, Nagoya University Graduate School of Medicine, 65 Tsurumai, Showa,
Nagoya 466‑8550, Japan. 2Hitachi, Ltd., R & D Group, Centre for Exploratory Research, Tokyo 185‑8601,
Japan. 3Department of Rare/Intractable Cancer Analysis Research, Nagoya University Graduate School of
Medicine, Nagoya 466‑8550, Japan. *email: hiro2013@med.nagoya‑u.ac.jp
Scientific Reports | (2021) 11:4055 | https://doi.org/10.1038/s41598-021-83619-w 1
Vol.:(0123456789)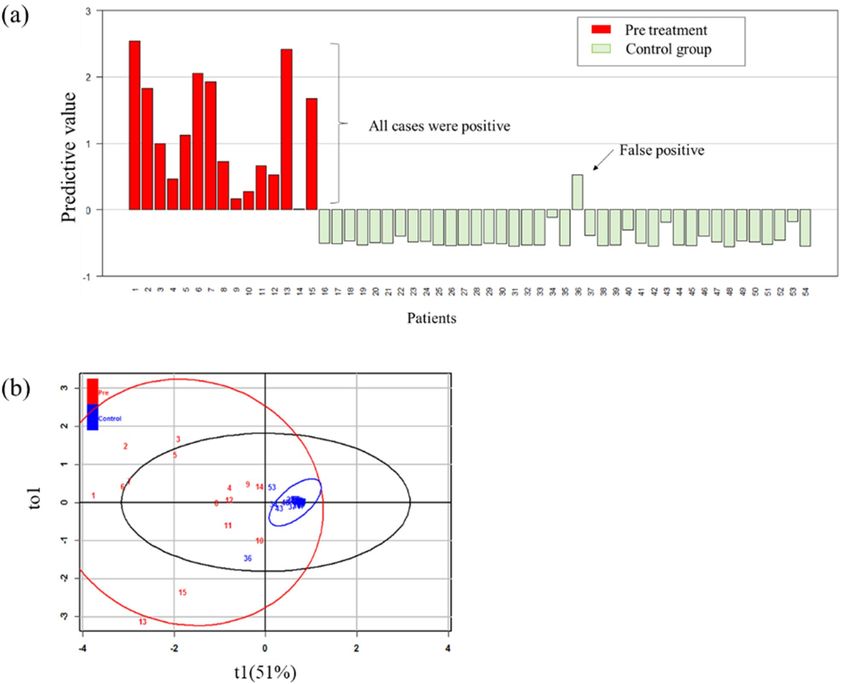
www.nature.com/scientificreports/

                                             Variable                      Control participants   Neuroblastoma patients   p value
                                             Number, n                     39                     15
                                             Age, years (mean ± 2SD)       2.9 ± 4.1              1.8 ± 3.5                0.056
                                             Sex, male/female              19/20                  8/7                      1.000
                                             Stage (INSS classification)
                                             2A, n                         (−)                    1
                                             3, n                          (−)                    1
                                             4, n                          (−)                    13
                                             Primary tumour localisation
                                             Mediastinum, n                (−)                    3
                                             Adrenal gland, n              (−)                    10
                                             Retroperitoneum, n            (−)                    2

                                            Table 1.  Patient and control characteristics. SD standard deviation, INSS International Neuroblastoma Staging
                                            System, (−) not applicable.

                                                Therefore, this study aimed to establish methods for LC/MS, statistical processing, and machine learning
                                            to identify tumour markers for childhood cancers using urinary samples. Since potential new neuroblastoma
                                            biomarkers can be verified by comparison with existing markers, neuroblastoma patient samples were used in
                                            this study as a representative of childhood cancers. Successful establishment of this method will enable non-
                                            invasive and convenient tumour screening and follow-up, thereby increasing the comfort of paediatric patients
                                            during examination for cancer.

                                            Results
                                            Patients and controls. Fifteen patients with neuroblastoma and 39 controls were included in the study.
                                            Patient and control characteristics are shown in Table 1. The control group included preoperative patients, such
                                            as patients with inguinal or umbilical hernia. The mean age and ± 2 SD of neuroblastoma patients and control
                                            participants were 1.8 ± 3.5 and 2.9 ± 4.1 years of age, respectively.

                                            LC/MS, Wilcoxon rank sum test, and random forest methods. A total of 998 metabolites were
                                            detected by LC/MS. Of the 998 detected metabolites, we extracted 255 metabolites that significantly (P < 0.05)
                                            increased or decreased in the neuroblastoma group compared to that in the control group using the Wilcoxon
                                            rank sum test. The number of metabolites was decreased to 191 when exogenous substances, such as drugs,
                                            were removed from the 255 metabolites. The contribution and importance of the 191 metabolites were ranked
                                            using the RF method. Of the top 30 metabolites, a search of the available databases revealed that 11 did not have
                                            identified structures; these were therefore excluded. Of the remaining 19 metabolites, 6 significantly decreased in
                                            neuroblastoma patients compared to the control group, and 13 were significantly increased. The 19 metabolites
                                            are shown in Table 2, along with their associated metabolic pathways. Known tumour markers such as homova-
                                            nillate (HVA) and vanillylmandelate (VMA) appeared in the top ranked metabolites. Focusing on the metabolic
                                            pathways of metabolites that significantly increased in neuroblastoma patients compared to the control group,
                                            most highly ranked metabolites (including HVA and VMA) were involved in tyrosine metabolism, methionine
                                            metabolism, steroid metabolism, or Leucine metabolism. Based on this information, we believed that it was
                                            possible to select biomarker candidates with a higher sensitivity than single metabolites by combining multiple
                                            metabolic pathways. We examined various combinations through trial and error. As a result, there were fewer
                                            false negatives and higher explained variation (R2) and predictive ability (Q2) when combining substances with
                                            different metabolic systems than when combining substances with the same metabolic system. In addition, the
                                            combination with a steroid system with a slightly lower ranking had fewer false negatives and a higher R2 and
                                            Q2 than the combination with a leucine system with a higher ranking. Therefore, we selected one representa-
                                            tive metabolite from each of three different metabolic pathways, tyrosine metabolism and methionine metabo-
                                            lism, which are amino acid metabolism system, and steroid metabolism, which is a lipid metabolism system,
                                            as a candidate biomarker. Specifically, 3-methoxytyramine sulphate (3-MTS) was selected as a representative
                                            of tyrosine metabolites, cystathionine (CTN) was selected as a representative of methionine metabolites, and
                                            cortisol (COR) was selected as a representative of steroid metabolites. The combination of the three metabolites
                                            was examined as a tumour marker candidate. Known biomarkers (HVA and VMA) were purposely excluded.
                                            However, the combination of HVA and VMA was examined for comparison.

                                            Analysis of the combination of three metabolites using OPLS‑DA. An OPLS-DA model used the
                                            three selected metabolites (3-MTS, CTN, and COR) to discriminate between the neuroblastoma and control
                                            groups and determine their respective constants. The calculated constants of 3-MTS, CTN, and COR were 0.52,
                                            0.39, and 0.23, respectively. The predicted value was calculated by adding these constants multiplied by their
                                            relative intensities (Fig. 1a). A cut-off value of 0 was designated so that a positive value indicated a high risk of
                                            cancer and a negative value indicated a low risk of cancer. The graph showed that all 15 patients with neuro-
                                            blastoma showed a positive result and one control group patient displayed a false positive result. One patient
                                            with a false positive result was seven months old; there were three additional patients aged under one year in the

          Scientific Reports |   (2021) 11:4055 |                      https://doi.org/10.1038/s41598-021-83619-w                                              2

Vol:.(1234567890)
www.nature.com/scientificreports/
Fold-change
(neuroblastoma/
Rank Metabolites control) Increase or decrease p value Super pathway Sub pathway
1 homovanillate (HVA) 17 Increase < 0.01 Amino acid Tyrosine metabolism
3-methoxytyramine
2 12 Increase < 0.01 Amino acid Tyrosine metabolism
sulfate
vanillylmandelate
3 27 Increase < 0.01 Amino acid Tyrosine metabolism
(VMA)
4 vanillactate 31 Increase < 0.01 Amino acid Tyrosine metabolism
3-methoxy-4-hydroxy-
9 19 Increase < 0.01 Amino acid Tyrosine metabolism
phenylglycol
10 cystathionine 11 Increase < 0.01 Amino acid Methionine metabolism
3,4-dihydroxypheny-
11 19 Increase < 0.01 Amino acid Tyrosine metabolism
lacetate
3,4-dihydroxyphenylac-
13 9.3 Increase < 0.01 Amino acid Tyrosine metabolism
etate sulfate
14 dopamine 3-O-sulfate 7.8 Increase < 0.01 Amino acid Tyrosine metabolism
17 dehydroascorbate 0.29 Decrease 0.02 Cofactors Ascorbate metabolism
18 3-methoxytyrosine 13 Increase < 0.01 Amino acid Tyrosine metabolism
alpha-hydroxyisovaler-
19 3.6 Increase < 0.01 Amino acid Leucine metabolism
ate
N2,N5-diacetylorni-
23 0.56 Decrease < 0.01 Amino acid Arginine metabolism
thine
24 urea 0.77 Decrease < 0.01 Amino acid Arginine metabolism
25 cortisol 10 Increase < 0.01 Lipid Corticosteroids
26 3-methoxytyramine 10 Increase < 0.01 Amino acid Tyrosine metabolism
28 homocitrulline 0.33 Decrease < 0.01 Amino acid Arginine metabolism
29 tiglyl carnitine (C5) 0.77 Decrease 0.018 Amino acid Leucine metabolism
30 xanthurenate 0.49 Decrease < 0.01 Amino acid Tryptophan metabolism
Table 2. Nineteen of the highest-ranking metabolites according to their contributions evaluated by the
random forest method.
control group who all had negative results but high values. The validity of this result was evaluated by OPLS-DA
(Fig. 1b); the control group formed a clustered pattern and the tumour group formed a scattered pattern. R 2 was
0.726 and Q2 was 0.687, which was considered a reasonable result.
Analysis of the combination of VMA and HVA. We also examined the combination of the known
tumour markers, HVA and VMA. The calculated VMA and HVA constants were 0.52 and 0.39, respectively, and
the predicted value was calculated for each patient (Fig. 2a). All control group cases were negative. However, in
the pretreatment tumour group, two cases were false negatives. In addition, the two cases that were negative for
HVA and VMA also had low 3-MTS and CTN levels; only COR was significantly elevated. In the two cases with
false negative results, VMA was within the standard clinical value and HVA was slightly higher than the standard
value. In OPLS-DA (Fig. 2b), the control group formed a clustered pattern and the tumour group formed a scat-
tered pattern. R2 was 0.583 and Q2 was 0.512, which was considered a reasonable result.
Correlation of the predictive value with tumour status after treatment initiation. To evaluate
the correlation of the values of the three-metabolite combination with tumour presence or absence, we exam-
ined urine samples collected during and after treatment; thirty-three samples were collected from 13 patients.
Table 3 shows the correlation between the positive and negative predictive values and the presence or absence of
a residual tumour. Tumour presence or absence was judged by 123I metaiodobenzylguanidine (MIBG) scintigra-
phy imaging. There were four false negatives but no false positives. The specificity was 1.000 and the sensitivity
was 0.692.
Similarly, the correlation between HVA and VMA and residual tumour status was analysed. The results are
shown in Table 4. There were two false negatives but no false positives. The specificity was 1.000 and the sensi-
tivity was 0.818.
Discussion
This study identified a new tumour marker candidate for neuroblastoma that can be identified through non-
invasive testing (urine samples). HVA and VMA are known urinary tumour markers for neuroblastoma and their
sensitivities are 0.882 and 0.842, respectively14. In the current study, although 2 of the 15 pre-treatment patients
displayed a false negative for HVA and VMA, all of the novel markers that we identified were positive. Therefore,
the markers identified in the current study are not inferior to known markers. Furthermore, R2 and Q2 of HVA
and VMA are also relatively low. It may be possible to discover tumour markers that are more sensitive than HVA
and VMA, as it is now possible to measure even low concentrations of metabolites. The control group had one
Scientific Reports | (2021) 11:4055 | https://doi.org/10.1038/s41598-021-83619-w 3
Vol.:(0123456789)www.nature.com/scientificreports/
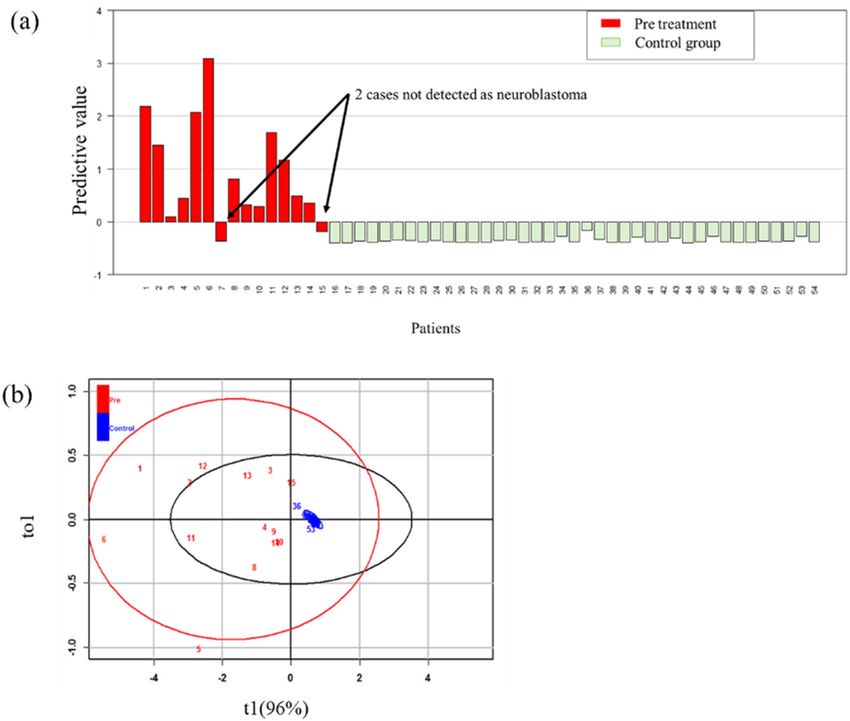
Figure 1. Predictive value analysis of the combinations of three metabolites in pretreatment patients. (a) Plot of
the predictive values; one bar shows one sample. Positive bars indicate a positive predictive value and negative
bars show a negative predictive value. Numbers 1–15 are patients and 16–54 are controls. Patient number 11 was
stage 2A and 12 was stage 3. Others were stage 4. (b) OPLS-DA results showed that the control group formed
a very narrowly scattered pattern and the tumour group formed a widely scattered pattern. The explained
variation (R2) was 0.726 and predictive ability (Q2) was 0.687. These results show that this is an accurate model
and that the control group and the tumour group are clearly differentiable.
false positive result from a 7-month-old patient and four other patients under one year of age. The values in the
other three cases were in the negative range but close to the cut-off value of 0, indicating that the dynamics may
differ for children under one year of age. In addition, the markers that we identified were useful as indicators of
the course of treatment. There were no false positives and the specificity was 1.000. There were four false negatives
and the sensitivity was low at 0.692. However, three of the four false negatives came from a single patient. If this
patient is considered heterogeneous, the sensitivity reaches 0.900, which is a satisfactory result. Some reports
have indicated that combining known markers is effective in identifying additional biomarker candidates15,16. This
is corroborated by the findings of the current research. The variation in the absolute value of each of the three
metabolites was resolved by using a statistical standardisation m ethod3,17. The predictive value is the combined
value after statistically standardising each of the three metabolites. This method of standardisation is widely used
and considered a reasonable statistical p rocedure3,7,17,18.
Metabolomics is a novel and promising tool that has emerged in recent years; it is effective for biomarker
identification and discovery7,10. The broadest metabolome coverage is achieved by MS-based methods and among
MS techniques, LC–MS is the most v ersatile7,17. It is for that reason that we first extracted a wide range of
metabolites using LC–MS. Since approximately 1,500 different metabolites were detected by the comprehensive
analysis of urinary metabolites, substances that increased or decreased in cancer patients were analysed using
the Wilcoxon rank sum test. Even so, 240 metabolites were still considered potential biomarkers. To reduce the
number of metabolites, we evaluated the importance of individual metabolites using the RF method, which is
an ensemble, supervised machine learning algorithm4,9,18. There are many machine learning techniques, but the
RF method was adopted because it reduces variance and overfitting, thereby improving accuracy19. By excluding
Scientific Reports | (2021) 11:4055 | https://doi.org/10.1038/s41598-021-83619-w 4
Vol:.(1234567890)www.nature.com/scientificreports/
Figure 2. Predictive value analysis of the combination of VMA and HVA in pretreatment patients. (a) Plot of
predictive values using VMA and HVA. All control group cases were negative. However, in the pretreatment
tumour group, two cases were false negatives. Numbers 1–15 are patients and 16–54 are controls. Patient
number 11 was stage 2A and 12 was stage 3. Others were stage 4. Two false negative patients were both stage 4.
(b) OPLS-DA analysis showed that, similar to Fig. 1b, the control group formed a very narrow pattern and the
tumour group is out of the graphic. The explained variation ( R2) was 0.583, and the predictive ability (Q2) was
0.512. The control and tumour groups can be clearly discriminated.
Residual tumour ( +), n Residual tumour (−), n Sum
Predictive value ( +) 9 0 9
Predictive value (−) 4 20 24
Sum 13 20 33
Table 3. Correlation between positive and negative predictive values of the combination of novel tumour
markers and the presence or absence of a residual tumour.
substances with an unknown structure, RF analysis further reduced the list of candidates to 20 metabolites. By
focusing on the metabolic pathways and selecting one representative substance from each of three different
metabolic pathways, we were able to successfully identify novel biomarkers. Both the novel biomarker candidate
and the known marker combinations had sufficiently high R2 values, indicating a statistically valid and reason-
able result4,7,9,10,12. Based on this information, the novel biomarker for neuroblastoma was determined to be a
combination of 3-MTS, CTN, and COR.
Scientific Reports | (2021) 11:4055 | https://doi.org/10.1038/s41598-021-83619-w 5
Vol.:(0123456789)www.nature.com/scientificreports/
Residual tumor ( +), n Residual tumor ( +), n Sum
Predictive value ( +) 9 0 9
Predictive value (−) 2 20 22
Sum 11 20 31
Table 4. Correlation between positive and negative predictive values of combination of HVA and VMA and
the presence or absence of a residual tumour.
The following sections discuss the relationship between each of these three metabolites and neuroblastoma.
First, we considered 3-MTS. Neuroblastoma arises from neural crest cells and a characteristic of neural crest-
derived cells is the synthesis of catecholamines such as noradrenalin, adrenalin, and d opamine20,21. VMA is the
end product of adrenaline and noradrenaline, and HVA is the end product of dopamine20,22. Therefore, these
have long reigned as known biomarkers. Catecholamine is a metabolite derived from tyrosine21. Based on this
information, the involvement of tyrosine metabolism in neuroblastoma can be seen. In this study, we chose
3-MTS as a representative of tyrosine metabolites. Several recent studies have evaluated new urinary tumour
markers of childhood neuroblastoma and reported 3-MTS as a good m arker22–24. One report states that 3-MTS
is correlated with neuroblastoma stage and prognosis25. In our study, all 15 patients had significantly elevated
3-MTS levels before treatment, and 13 of the 15 patients were at stage 4 (Table 1). No correlation with prognosis
was found during or after treatment.
We then considered CTN. CTN is an intermediate in the trans-sulphuration pathway of methionine to
cysteine26,27. Cystathionase, a metabolising enzyme of CTN, requires pyridoxal phosphate (active vitamin B6) as
a coenzyme20,26. When dopamine is biosynthesised from dopa, dopa decarboxylase acts and requires pyridoxal
phosphate as a coenzyme28. As described above, catecholamines are overproduced in neuroblastoma. Therefore,
in neuroblastoma, pyridoxal phosphate is utilised for dopa decarboxylase activity. As a result, cystathionase activ-
ity is reduced and CTN is excreted in large amounts in u rine21,26–28. Therefore, it makes sense to select CTN as a
candidate biomarker. In fact, although there have been no reports in recent years, CTN has been reported as a
useful tumour marker for neuroblastoma in the p ast21,26,28. Despite its usefulness, it has not been considered supe-
rior to biomarkers such as HVA and VMA. However, it is an important metabolite for neuroblastoma and cannot
be excluded when searching for biomarkers using a combination of metabolites, as was the case in our study.
Finally, COR was considered. COR is a type of glucocorticoid (a corticosteroid). Functional adrenal neoplasms
such as neuroblastoma, pheochromocytoma, adrenocortical carcinoma, and adrenal adenoma can secrete COR,
aldosterone, sex hormones, or catecholamines29. There is also a case report of neuroblastoma with elevated corti-
sol levels30. In our study, eight of ten adrenal neuroblastoma patients had significantly elevated COR. COR level
did not appear to increase unless the neuroblastoma appeared in the adrenal gland. Therefore, COR appears to
be less important for diagnosis than 3-MTS and CTN. However, the two cases that were negative for HVA and
VMA may not have been positive for the combination of 3-MTS and CTN alone, and could be extracted with a
significant difference by combining COR with 3-MT and CTN.
Based on the above information, the combination of all three metabolites is required to provide a biomarker
that is statistically effective and confirms pathology both during and after treatment. Furthermore, these extracted
metabolites are all theoretically associated with neuroblastoma. Therefore, we believe that this method of explor-
ing new biomarkers is effective. However, to prove the efficacy of the extracted biomarkers, this marker must be
studied in another patient group and a ROC curve must be generated.
The limitations of this study are as follows: First, the number of cases is not large. Significant differences
have been observed and the number of populations is statistically sufficient. However, validation using a larger
cohort is required in the future. Secondly, there were no cases of early stage neuroblastoma or recurrence. It is
important that the extracted biomarkers are able detect tumours early. Recurrence will be considered during
follow up on these patients.
In conclusion, we devised an LC/MS and subsequent analysis method to identify new biomarkers for neu-
roblastoma. Validation of this method focused on three extracted metabolites: 3-MTS, CTN, and COR. The
combination of these three metabolites makes them a more useful biomarker than the currently known markers.
In the future, we hope to further validate this new marker for neuroblastoma, while applying this method to
identify new biomarkers for other childhood cancers. In particular, we would like to facilitate the detection and
identification of tumours for which biomarkers have not yet been discovered. The development of urinary exami-
nations that can detect tumours will improve the ease of diagnosis and follow-up for paediatric cancer patients,
because this non-invasive method greatly reduces the discomfort inherent in the currently used methods.
Methods
Patients and urinary sample collection. This study recruited paediatric neuroblastoma patients who
were treated at Nagoya University Hospital between January 2016 and December 2018. The control group
included the patients with no known cancer who were admitted to Nagoya University Hospital for inguinal
hernia treatment. After written, informed consent was obtained from each of their parents, urine samples were
collected from both patients and controls. If the patient was over 5 years old, they provided informed consent.
Urine samples of neuroblastoma patients were collected once before treatment and then according to the
treatment course such as after surgery, chemotherapy, and hematopoietic stem cell transplantation, etc. For the
controls, urine samples were only collected once before treatment. The following information was collected from
Scientific Reports | (2021) 11:4055 | https://doi.org/10.1038/s41598-021-83619-w 6
Vol:.(1234567890)www.nature.com/scientificreports/
the patient’s medical records: Sex, age, stage, tumour location, treatment, treatment effect, and fluctuation of
known biomarkers. Univariate analyses were performed using Fisher’s exact test for sex and the Mann–Whitney
U test for age.
Comprehensive analysis of urinary metabolites. An LC/MS system was used for the comprehensive
analysis of urinary metabolites. The multiple isolation mode was selected for LC (reverse phase liquid chroma-
tography and hydrophilic interaction chromatography). This is because LC/MS cannot be limited to a single
isolation mode to target metabolites with a wide polarity range for isolation when the substances in urinary
metabolites have unknown properties (including being either hydrophilic or hydrophobic or having a charge
in solution). We used electrospray ionisation (ESI) in positive and negative ionisation modes (+ ESI mode/-ESI
mode) for the MS ionisation method, and a high-resolution Orbitrap mass spectrometer. A high-resolution mass
spectrometer enables the refinement of the compositional formula from the precise mass of the ions observed in
the obtained mass spectra. This makes it extremely effective for detecting metabolites with unknown structures.
The LC/MS analysis was outsourced to Metabolon Inc. (Morrisville, NC, USA), which analysed the metabolites
using an original analytical platform and an accepted protocol for LC/MS analysis4. However, detailed informa-
tion about this platform, such as LC gradient conditions, has not been d isclosed4. The value of each metabolite
was expressed in osmotic normalisation value, because components in urine vary widely compared to compo-
nents in blood.
Statistical analysis. Metabolites that differed in level significantly in the urine of cancer patients compared
to those in the urine of healthy individuals were extracted, and the importance of these metabolites was evalu-
ated. A typical example of this analysis would include creating an S-Plot using the OPLS-DA method; there
are reports of methods that extract metabolites with a significant difference in the abundance between healthy
individuals and cancer patients with high repeatability31,32. However, a large number of urinary metabolites with
varying structures exist. Therefore, candidate biomarkers differ for each analysis lot, and it is not always easy to
extract biomarker candidates.
Consequently, we adopted the following analysis procedure. We constructed this analysis system indepen-
dently using the statistical program R version 3.3.2.
1) Comprehensive LC/MS analysis results were refined using p values for metabolites that showed a significant
difference between cancer patients and healthy individuals based on the Wilcoxon rank sum test. The level
of significance was set at 5%. In this study, the results were obtained by a single test of significance, not a
multiple comparison, so correction such as Bonferroni correction or a correction based on the false discov-
ery rate was not used. The variation was so large that normalization could not be performed. Therefore, a
nonparametric test was conducted without log-transformation.
2) While it was possible to refine important metabolites using the above testing method, quantitative evalua-
tion was difficult. Therefore, we applied the RF method to the refined analysis targets obtained in step 1 to
evaluate metabolite i mportance18,19,33.
3) Biomarker candidates were extracted from metabolites identified as important in step 2. At this point, we
excluded conjugates that were estimated to be exogenous metabolites by searching the database owned by
Metabolon Inc.
4) We then constructed a cancer detection model based on the OPLS-DA method using the extracted biomarker
candidates. A predictive equation represented by the first-order equation of intensities of urinary tumour
markers enabled the calculation of the predictive values. For example, in a case with three markers, the
predictive value would be calculated as follows:
Predictive value = α × Relative intensity of biomarker 1 + β × Relative intensity of biomarker 2
+ γ × Relative intensity of biomarker 3,
where α, β, and γ are constants.
OPLS-DA model quality was evaluated by predicting R2 and Q2. Q2 was calculated by seven cross-validations.
A 100-permutation test was used to estimate Q2 and R2 significance18. OPLS-DA revealed that this model suc-
cessfully calculated the predictive value for that combination and identified valid biomarker candidates.
The predicted values thus obtained were plotted on a graph. This allowed us to compare new biomarker can-
didates and known markers. For the neuroblastoma group, predicted values were graphed in urinary samples
during and after treatment; positive and negative values were determined and summarised in a 2 × 2 contingency
table with tumour activity. Tumour presence or absence was judged by MIBG scintigraphy imaging.
Ethical concerns. This study was approved by the Ethics Committee of Nagoya University Hospital
(Approval no: 2016-0303). The legal guardians of all participants provided informed consent. All study proce-
dures were performed in accordance with the guidelines of the Declaration of Helsinki.
Data availability
The datasets generated and/or analysed during the current study are available from the corresponding author
upon reasonable request.
Received: 28 August 2020; Accepted: 3 February 2021
Scientific Reports | (2021) 11:4055 | https://doi.org/10.1038/s41598-021-83619-w 7
Vol.:(0123456789)www.nature.com/scientificreports/
References
1. Scollon, S., Anglin, A. K., Thomas, M., Turner, J. T. & Wolfe, S. K. A comprehensive review of pediatric tumors and associated
cancer predisposition syndromes. J. Genet. Couns. 26, 387–434 (2017).
2. Mitchell, P. S. et al. Circulating microRNAs as stable blood-based markers for cancer detection. Proc. Natl. Acad. Sci. U S A. 105,
10513–10518 (2008).
3. Ma, Y. L. et al. Ultra-high performance liquid chromatography-mass spectrometry for the metabolomic analysis of urine in colo-
rectal cancer. Dig. Dis. Sci. 54, 2655–2662 (2009).
4. Sakairi, M., Abe, M. & Tanaka, N. Extraction of urinary metabolite-derived biomarker candidate for breast cancer. Bull. Chem.
Soc. Jpn. 91, 1351–1356 (2018).
5. Yasui, T. et al. Unveiling massive numbers of cancer-related urinary-microRNA candidates via nanowires. Sci. Adv. 3, e1701133
(2017).
6. Peiyuan, Y. & Guowang, X. Metabolomics for tumor marker discovery and identification based on chromatography-mass spec-
trometry. Expert Rev. Mol. Diagn. 13, 339–348 (2013).
7. Zhang, A., Sun, H., Wang, P., Han, Y. & Wang, X. Modern analytical techniques in metabolomics analysis. Analyst. 137, 293–300
(2012).
8. Liu, X. et al. Investigation of the urinary metabolic variations and the application in bladder cancer biomarker discovery. Int. J.
Cancer. 143, 408–418 (2018).
9. Nakajima, T. et al. Urinary polyamine biomarker panels with machine-learning differentiated colorectal cancers, benign disease,
and healthy controls. Int. J. Mol. Sci. 19, 756 (2018).
10. Xiaofeng, X. et al. Identification of bile biomarkers of biliary tract cancer through a liquid chromatography/mass spectrometry-
based metabolomic method. Mol. Med. Rep. 11, 2191–2198 (2015).
11. Feng, C., Jihua, X., Linfu, Z., Shanshan, W. & Zhi, C. Identification of serum biomarkers of hepatocarcinoma through liquid
chromatography/mass spectrometry-based metabonomic method. Anal. Bioanal. Chem. 401, 1899–1904 (2011).
12. Zhu, J. et al. Targeted serum metabolite profiling and sequential metabolite ratio analysis for colorectal cancer progression moni-
toring. Anal. Bioanal. Chem. 407, 7857–7863 (2015).
13. Riley, R. D. et al. A systematic review of molecular and biological tumor markers in neuroblastoma. Clin. Cancer Res. 10, 4–12
(2004).
14. Sawada, T. Measurement of urinary vanillylmandelic acid (VMA) and homovanillic acid (HVA) for diagnosis of neural crest
tumors. Pediatr. Hematol. Oncol. 14, 291–293 (1997).
15. Tokunaga, R., Sakamoto, Y., Nakagawa, S., Yoshida, N. & Baba, H. The utility of tumor marker combination, including serum P53
antibody, in colorectal cancer treatment. Surg. Today. 47, 636–642 (2017).
16. Kobayashi, T. A blood tumor marker combination assay produces high sensitivity and specificity for cancer according to the natural
history. Cancer Med. 7, 549–556 (2018).
17. Lu, W. et al. Metabolite measurement: Pitfalls to avoid and practices to follow. Annu. Rev. Biochem. 86, 277–304 (2017).
18. Okareva, A. O. et al. Feature selection for OPLS discriminant analysis of cancer tissue lipidomics data. J. Mass Spectrom. 55, e4457
(2020).
19. Montazeri, M., Montazeri, M., Montazeri, M. & Beigzadeh, A. Machine learning models in breast cancer survival prediction.
Technol. Health Care. 24, 31–42 (2016).
20. Klein, C. E., Roberts, B., Holcenberg, J. & Glode, L. M. Cystathionine metabolism in neuroblastoma. Cancer 62, 291–298 (1988).
21. Abeling, N., Gennip, A. H., Overmars, H. & Voûte, P. A. Biochemical monitoring of children with neuroblastoma. Radiother. Oncol.
7, 27–35 (1986).
22. Peitzsch, M. et al. Biochemical testing for neuroblastoma using plasma free 3-O-methyldopa, 3-methoxytyramine, and norme-
tanephrine. Pediatr. Blood Cancer. 67, e28081 (2020).
23. Lam, L., Woolard, G., Teague, L. & Davidson, J. S. Clinical validation of urine 3-methoxytyramine as a biomarker of neuroblastoma
and comparison with other catecholamine-related biomarkers. Ann. Clin. Biochem. 54, 264–272 (2017).
24. Verly, I. R. N. et al. Catecholamines profiles at diagnosis: Increased diagnostic sensitivity and correlation with biological and clinical
features in neuroblastoma patients. Eur. J. Cancer. 72, 235–243 (2017).
25. Verly, I. R. N. et al. 3-Methoxytyramine: An independent prognostic biomarker that associates with high-risk disease and poor
clinical outcome in neuroblastoma patients. Eur. J. Cancer. 90, 102–110 (2018).
26. Rajnherc, J. R., van Gennip, A. H., Abeling, N. G., van der Zee, J. M. & Voûte, P. A. Cystathioninuria in patients with neuroblastoma.
Med. Ped. Oncol. 12, 81–84 (1984).
27. Bronowicka-Adamska, P., Bentke, A. & Wróbel, M. Hydrogen sulfide generation from L-cysteine in the human glioblastoma-
astrocytoma U-87 MG and neuroblastoma SHSY5Y cell lines. Acta Biochim. Pol. 64, 171–176 (2017).
28. Chakrabarty, K., Gupta, S. N., Das, G. K. & Roy, S. Theoretical studies on the pyridoxal-5’-phosphate dependent enzyme dopa
decarboxylase: effect of thr 246 residue on the co-factor-enzyme binding and reaction mechanism. Indian J. Biochem. Biophys. 49,
155–164 (2012).
29. Low, G. & Sahi, K. Clinical and imaging overview of functional adrenal neoplasms. Int. J. Urol. 19, 697–708 (2012).
30. Gulleroglu, K. et al. Neuroblastoma accompanied by hyperaldosteronism. J. Renal Inj. Prev. 3, 79–82 (2014).
31. Susanne, W. et al. Visualization of GC/TOF-MS-based metabolomics data for identification of biochemically interesting compounds
using OPLS class models. Anal Chem. 80, 115–122 (2008).
32. Hirayama, A. et al. Metabolic profiling reveals new serum biomarkers for differentiating diabetic nephropathy. Anal Bioanal Chem.
404, 3101–3109 (2012).
33. Chen, C. H., Tanaka, K. & Funatsu, K. Random forest approach to QSPR study of fluorescence properties combining quantum
chemical descriptors and solvent conditions. J. Fluoresc. 28, 695–706 (2018).
Acknowledgements
The authors thank Metabolon Inc. for performing the LC/MS analysis for this study.
Author contributions
K.Y., H.U., M.S., M.A., H.A., and A.H. designed the study protocol. K.Y., H.U., Y.T., T.T., C.S., W.S., K.O., S.M.,
and A.H. obtained written, informed patient consent and collected urinary samples. K.Y., M.S., A.A., and A.H.
processed the urine samples. K.Y., H.U., M.S., M.A., H.A., and A.H. analysed the data. H.U. and A.H. con-
ducted and supervised the study. K.Y. and M.S. wrote the first draft of the manuscript. All authors reviewed the
manuscript.
Funding
This study was a joint research project with Hitachi, Ltd., and was funded by a joint research fund.
Scientific Reports | (2021) 11:4055 | https://doi.org/10.1038/s41598-021-83619-w 8
Vol:.(1234567890)www.nature.com/scientificreports/
Competing interests
Dr. Uchida received joint research funding with Hitachi, Ltd [Grant number 2617Dm-08b]. All other authors
have no conflict of interest to declare.
Additional information
Correspondence and requests for materials should be addressed to H.U.
Reprints and permissions information is available at www.nature.com/reprints.
Publisher’s note Springer Nature remains neutral with regard to jurisdictional claims in published maps and
institutional affiliations.
Open Access This article is licensed under a Creative Commons Attribution 4.0 International
License, which permits use, sharing, adaptation, distribution and reproduction in any medium or
format, as long as you give appropriate credit to the original author(s) and the source, provide a link to the
Creative Commons licence, and indicate if changes were made. The images or other third party material in this
article are included in the article’s Creative Commons licence, unless indicated otherwise in a credit line to the
material. If material is not included in the article’s Creative Commons licence and your intended use is not
permitted by statutory regulation or exceeds the permitted use, you will need to obtain permission directly from
the copyright holder. To view a copy of this licence, visit http://creativecommons.org/licenses/by/4.0/.
© The Author(s) 2021
Scientific Reports | (2021) 11:4055 | https://doi.org/10.1038/s41598-021-83619-w 9
Vol.:(0123456789)You can also read