Craniofacial shape in patients with beta thalassaemia: a geometric morphometric analysis - Nature
←
→
Page content transcription
If your browser does not render page correctly, please read the page content below
www.nature.com/scientificreports
OPEN Craniofacial shape in patients
with beta thalassaemia:
a geometric morphometric analysis
Petros Roussos1, Anastasia Mitsea2, Demetrios Halazonetis1 & Iosif Sifakakis1*
The shape of the craniofacial complex of patients with beta thalassaemia was evaluated using
geometric morphometrics on lateral cephalometric radiographs and was compared with matched
controls. The beta thalassaemia group consisted of 40 patients (16 females, 24 males, mean age 33.4).
Each patient was matched by age and gender to two controls (32 females, 48 males, mean age 33.1).
The 120 lateral cephalometric radiographs were digitized and traced with 15 curves, 10 landmarks
and 117 sliding semi-landmarks. These landmarks were subjected to Procrustes superimposition and
principal component analysis in order to describe shape variability of the cranial base, maxilla and
mandible, as well as of the entire craniofacial complex for each sex. The first 4 principal components
accounted for 50% of the total sample’s variability. The beta thalassaemia group was significantly
different in overall shape to the control group for both sexes. Similar findings were noted for the
maxilla, the mandible and the cranial base. The main differences were related to smaller mandibular
body for the thalassaemia group, midface protrusion and decrease in posterior face height. The shape
of the craniofacial complex in these patients is prone to be more convex and hyperdivergent.
Thalassaemia syndromes are hereditary haemolytic anaemias characterised by absent or reduced synthesis of
one or more globin chains of haemoglobin. The decline in globin chain production leads to decreased assembly
of functioning haemoglobin tetramers resulting in unpaired α and β chains that are incapable of properly releas-
ing oxygen1–6. The accumulation of unpaired chains disrupts the majority of the organ systems, leading to high
mortality rate, if left untreated2,6–8.
Thalassaemias are divided into alpha and beta, according to the affected gene. Beta thalassaemias are classi-
fied as major, intermediate and minor, depending on the level of β chain p roduction1. Clinical manifestations
differ, varying from minor morphologic abnormalities to life threatening conditions2–12. Skeletal changes are
produced by the hypertrophy of erythroid m arrow7, resulting in expansion of marrow cavities and consequent
skeletal deformities, osteoporosis and pathological fractures13. The cranial vault, the maxilla and the vertebrae
are the craniofacial structures most commonly affected leading to a convex face. Controversy is reported in the
literature as some studies report protrusion of the frontal bones and the cheekbones, depression of the bridge
of the nose and cant of the e yes1,11, while a recent anthropometric study resulted in no statistical differences of
the head and the eye regions between thalassaemia patients and healthy controls7. Tooth size and dental arch
dimensions are often reduced, the development and eruption of dentition is delayed and tooth discolouration is
routinely apparent8. The dentition is often displaced by the marrow expansion resulting in interdental spacing
and flared maxillary incisors, Class II intermaxillary relationship, increased overjet and anterior open‐bite8.
Previous studies on the structure of the craniofacial complex of beta thalassaemia patients relied on clinical
examination or conventional cephalometric a nalysis10,11,13,15–18. The latter has well-known inherent limitations.
A major problem is its reliance on a few landmarks that serve as a reference basis for the measurements. Point
Nasion, at the nasofrontal suture, and point Orbitale, at the inferior orbital rim, are commonly used. Both these
points are potentially affected by the skeletal manifestations of beta thalassaemia, so any cephalometric measure-
ments based on them are difficult to interpret and potentially unreliable.
Geometric morphometrics (GM) offers another perspective for studying shape variation, circumventing some
of the deficiencies of conventional c ephalometrics19–22. Combined with modern statistical analysis methods, it
offers the possibility of comparing the craniofacial pattern between two subjects or groups, invariant to location,
scale and orientation19–21. GM methods have been used to study shape differences between healthy controls and
patients affected by major syndromes, such as Down’s s yndrome23, fetal alcohol s yndrome24, Glut-1Ds25, 22q11.2
1
Department of Orthodontics, School of Dentistry, National and Kapodistrian University of Athens, 2, Thivon
Str., 11527 Athens, Greece. 2Department of Oral Diagnosis and Radiology, School of Dentistry, National and
Kapodistrian University of Athens, Athens, Greece. *email: isifak@dent.uoa.gr
Scientific Reports | (2021) 11:1686 | https://doi.org/10.1038/s41598-020-80234-z 1
Vol.:(0123456789)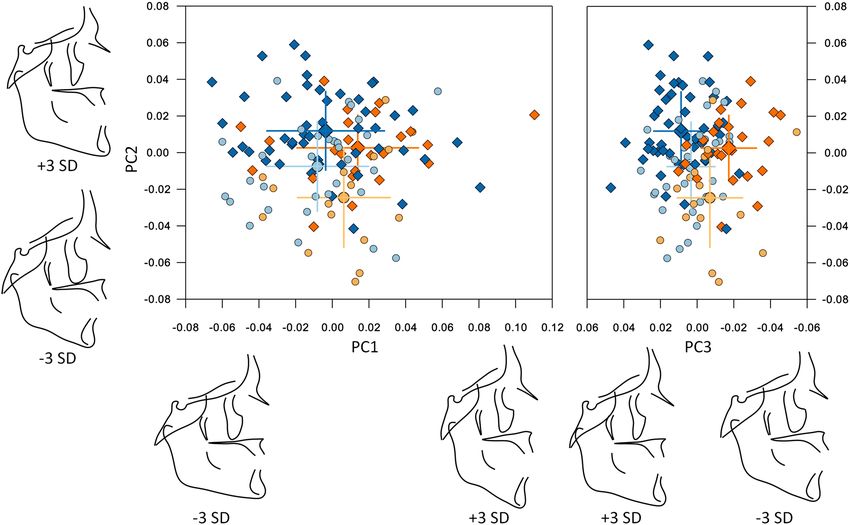
www.nature.com/scientificreports/
Figure 1. Age distribution of the βTh group (centre) and the control group (left and right). Lines connect
matched subjects. Circles: females; diamonds: males.
deletion syndrome26, Apert’s syndrome27, Pierre Robin sequence and Treacher Collins syndrome28, as well as
syndromic and nonsyndromic c raniosynostoses29.
The present study considered three main advantages of GM, compared to traditional cephalometrics, for
the evaluation of patients with thalassaemia; (a) there is no strong reliance on a reference structure, such as the
anterior cranial base, which may also be affected by the condition, (b) sliding semilandmarks are available for a
much denser description of the anatomy, including the curves between customary landmarks, and, therefore, (c)
sub-regions of the craniofacial complex can be independently studied, even when the number of conventional
landmarks on them is small.
The present study evaluated a sample of cephalometric radiographs of patients with beta thalassaemia (βTh)
and matched healthy controls (Ctrl) (Fig. 1). GM methods were applied in order to compare the shape of the
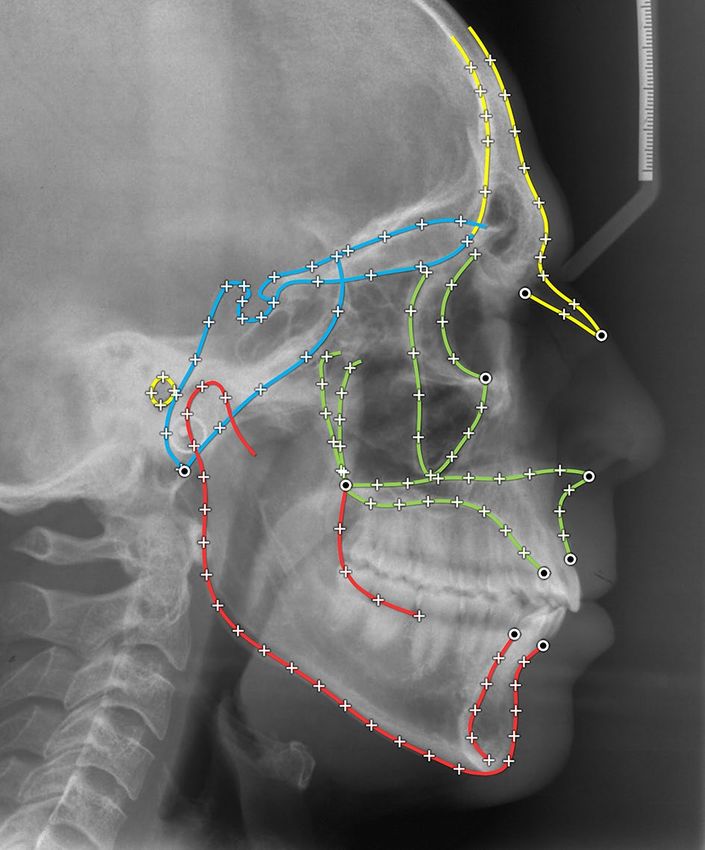
craniofacial structures. Salient structures on the radiographs were digitized and described by 10 fixed landmarks
and 117 sliding semilandmarks (Fig. 2). In addition to the entire craniofacial shape (CrF), we focused on three
sub-regions; the cranial base (CrB), the maxilla (Mx) and the mandible (Mnd). Generalized Procrustes align-
ment and Principal Components Analysis (PCA) were applied to extract principal components (PCs) of shape
variation.
Results
Overall craniofacial shape (CrF). Approximately 83% of the shape variance of the CrF region was
described by the 16 principal components that individually accounted for at least 1% of the variance (Table 1). A
scree plot (Supplementary Fig. S1) confirmed that the first 3 were the most important, accounting for just over
45% of shape variance. PC1 described variability in the vertical direction, divergency between the cranial base,
the maxilla and the mandible, and differences in the anterior to posterior facial height ratio. PC2 was linked
mainly to the anteroposterior relationship between the maxilla and the mandible, whereas PC3 described more
subtle variations, related to the protrusion of the maxilla and the symphysis, and to the gonial angle (Fig. 3). Age
is correlated to the first three principal components for both groups (Supplementary Fig. S2).
Males were significantly different than females in both the Ctrl and βTh groups (Table 2). Males had larger
PC1 and PC2 values than females, signifying hyperdivergency of the skeletal pattern and tendency towards a
skeletal Class III discrepancy (relative mandibular protrusion and maxillary retrusion). Differences between the
sexes were mainly along the PC2 axis and were very similar in both groups, except for the PC3 axis, where the
βTh males showed a tendency towards maxillary protrusion and forward inclination of the symphysis, relative
to females, in contrast to the Ctrl group males (Fig. 3, Fig. 4).
Comparison between the two groups for each sex separately showed significant differences (Fig. 3, Table 2).
The βTh group showed more hyperdivergency and a Class II skeletal pattern, combined with maxillary protru-
sion, forward symphysis inclination and a larger gonial angle (Fig. 5).
Regression of the Procrustes coordinates on the logarithm of age showed a statistically significant correla-
tion, but the percentage of variance explained by age was low, approximately 6%. A repeat of the inter-group
Scientific Reports | (2021) 11:1686 | https://doi.org/10.1038/s41598-020-80234-z 2
Vol:.(1234567890)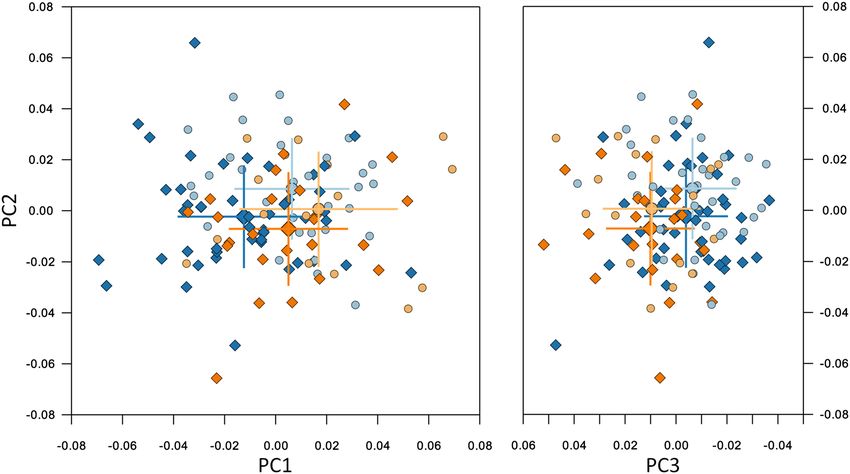
www.nature.com/scientificreports/

                                  Figure 2.  The digitized curves and landmarks. Circles: fixed landmarks; crosses: sliding semilandmarks,
                                  initially placed at equidistant positions, then allowed to slide. Blue: cranial base structures (CrB); green:
                                  maxillary structures (Mx); red: mandible (Mnd).

                                           %variance (%)   % cumulative variance (%)
                                   PC 1    22.80           22.80
                                   PC 2    15.30           38.10
                                   PC 3     7.50           45.60
                                   PC 4     6.60           52.20
                                   PC 5     5.60           57.80
                                   PC 6     4.40           62.20
                                   PC 7     3.30           65.50
                                   PC 8     3.00           68.40
                                   PC 9     2.70           71.10
                                   PC 10    2.30           73.40
                                   PC 11    2.10           75.50
                                   PC 12    1.80           77.30
                                   PC 13    1.70           79.00
                                   PC 14    1.50           80.60
                                   PC 15    1.40           82.00
                                   PC 16    1.30           83.30
                                   PC 17    1.00           84.30
                                   PC 18    1.00           85.30
                                   PC 19    1.00           86.30

                                  Table 1.  Sample variability for the first 19 PCs of the CrF configuration.

                                  comparisons, using the regression residuals, did not result in any appreciable differences to the results listed in
                                  Table 2. A scatter plot of the sample with subject markers coloured by age is shown in Supplementary Fig. 2.

                                  Cranial base (CrB). Cranial shape variation showed two main patterns, aligned to PC1 and PC2, which
                                  collectively described 42.6% of shape variance (Supplementary Table S1). One pattern was related to the ratio

Scientific Reports |   (2021) 11:1686 |                https://doi.org/10.1038/s41598-020-80234-z                                                      3

                                                                                                                                                  Vol.:(0123456789)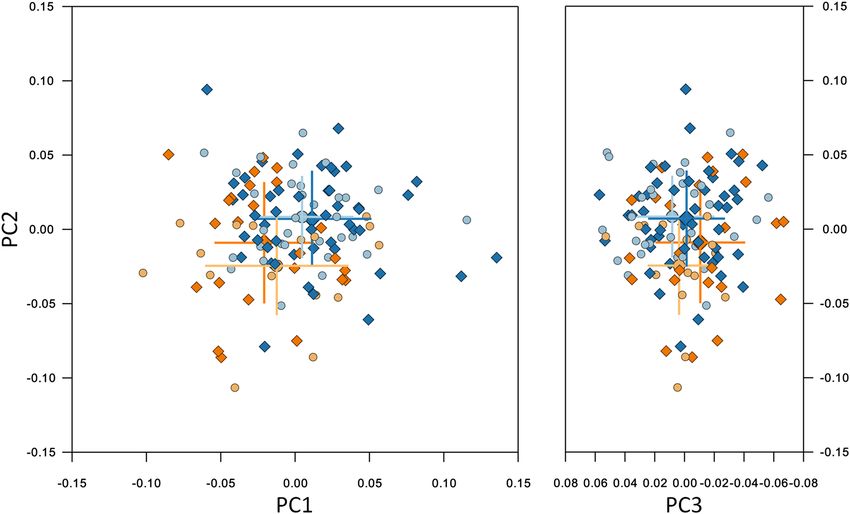
www.nature.com/scientificreports/

                                            Figure 3.  Composite of the shape space and first 3 PCs for the CrF region. Centre and right: the subjects
                                            plotted in the 3D shape space (centre: PC2 vs. PC1, right: PC2 vs. PC3). Blue and light blue: control subjects;
                                            orange and light orange: βTh group. Circles: females; diamonds: males. Large markers show group means
                                            with standard deviation lines. Axes scaling is in Procrustes distances from the average (all subjects scaled to a
                                            centroid size of 1). Left and bottom: the extreme shapes of variation along the PC1, PC2 and PC3 axes. Each
                                            extreme is + 3 or − 3 standard deviations from the average.

                                                                      Groups under
                                             Landmark configuration   comparison                  P value (procrustes distance)   P value (Goodall’s F test)
                                                                      Ctrl male     Ctrl female   0.0011                          0.0012
                                                                      βTh male      βTh female    0.0037                          0.0039
                                             Craniofacial (CrF)
                                                                      Ctrl male     βTh male      0.0001                          0.0001
                                                                      Ctrl female   βTh female    0.0048                          0.0049
                                                                      Ctrl male     Ctrl female   0.0767                          0.0757
                                                                      βTh male      βTh female    0.1133                          0.1142
                                             Cranial base (CrB)
                                                                      Ctrl male     βTh male      0.1649                          0.1660
                                                                      Ctrl female   βTh female    0.0968                          0.1004
                                                                      Ctrl male     Ctrl female   0.2855                          0.2851
                                                                      βTh male      βTh female    0.3505                          0.3512
                                             Maxilla (Mx)
                                                                      Ctrl male     βTh male      0.0001                          0.0000
                                                                      Ctrl female   βTh female    0.0033                          0.0032
                                                                      Ctrl male     Ctrl female   0.0002                          0.0004
                                                                      βTh male      βTh female    0.3331                          0.3316
                                             Mandible (Mnd)
                                                                      Ctrl male     βTh male      0.0002                          0.0002
                                                                      Ctrl female   βTh female    0.0056                          0.0050

                                            Table 2.  Permutation test results for each of the 4 regions, comparing males to females and the Ctrl group to
                                            the βTh group. All results are based on 100,000 permutations without replacement. P values are reported to the
                                            4th decimal point.

          Scientific Reports |   (2021) 11:1686 |                 https://doi.org/10.1038/s41598-020-80234-z                                                    4

Vol:.(1234567890)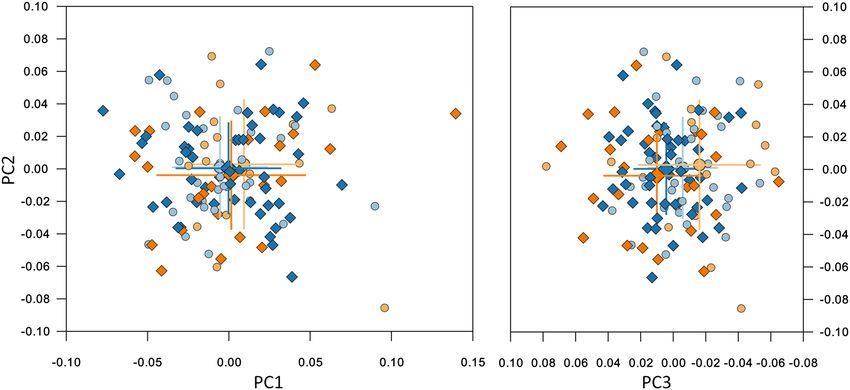
www.nature.com/scientificreports/

                                  Figure 4.  Procrustes superimposition of the average shapes of the craniofacial structures of males (solid line)
                                  and females (dotted line) of the βTh (orange) and Ctrl (blue) groups separately.

                                  Figure 5.  Procrustes superimposition of the average shapes of the craniofacial structures of the βTh (orange)
                                  and Ctrl (blue) groups for males (solid line) and females (dotted line) separately.

                                  of anterior to posterior cranial base length (PC1) and the other to the angle between the anterior and posterior
                                  cranial bases (PC2) (Supplementary Fig. S3).
                                      No significant differences in shape of the CrB between males and females, or between the βTh and Ctrl groups,
                                  were detected (Figs. 6, 7, Table 2).

                                  Maxilla (Mx).       Shape variation of the maxilla was spread of several PCs, without any clear threshold in the
                                  scree plot (Supplementary Fig. S1, Supplementary Table S2). The first 3 PCs, which accounted for 50% of the
                                  shape variance, are shown in Supplementary Fig. S4.
                                     Males and females were similar in shape in both groups (Fig. 8, Table 2). However, the βTh group showed
                                  significant differences to the Ctrl group, mainly in males, but also in females (Fig. 8). In the subjects with βTh, the

Scientific Reports |   (2021) 11:1686 |                https://doi.org/10.1038/s41598-020-80234-z                                                      5

                                                                                                                                                  Vol.:(0123456789)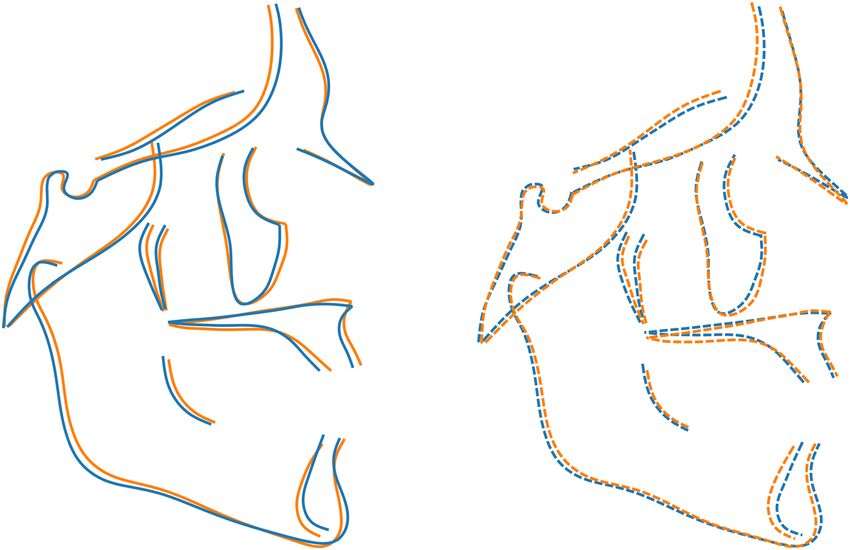
www.nature.com/scientificreports/
Figure 6. Shape space of the CrB region. Blue and light blue: control subjects; orange and light orange: βTh
group. Circles: females; diamonds: males. Large markers show group means and standard deviation.
Figure 7. Procrustes superimposition of the average shapes of the cranial base. Orange: βTh group, blue: Ctrl
group, solid line: males, dotted line: females.
alveolar process was protruded, the palate was thicker, the pterygomaxillary fissure was located more anteriorly,
and the zygomatic process of the maxilla was wider (Fig. 9).
Mandible (Mnd). Shape variation of the mandible was related mainly to the gonial angle and the ratio
between the length of the ramus and body. The first 3 PCs, accounting for 60% of the variance (Supplementary
Fig. S5, Supplementary Table S3).
Sexual dimorphism of mandibular shape was evident in the control group, but not in the βTh group (Fig. 10,
Table 2). There was a statistical difference both between the males of the two groups, and the females. The subjects
of the βTh group had a larger gonial angle, an anteriorly inclined symphysis and a larger ramal width (Fig. 11).
Discussion
Beta thalassaemia requires multidisciplinary management; dental professionals contribute decisively to the treat-
ment of patients with this condition. Correction of their malocclusion can be achieved with either orthodontic or
combined orthodontic-surgical approach30,31. The orthodontic-surgical approach may be more indicated, since
Scientific Reports | (2021) 11:1686 | https://doi.org/10.1038/s41598-020-80234-z 6
Vol:.(1234567890)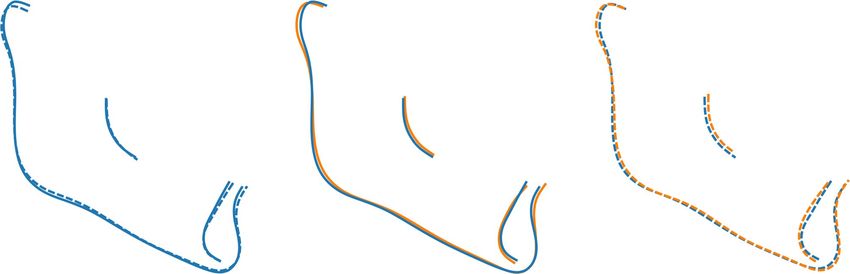
www.nature.com/scientificreports/
Figure 8. Shape space of the Mx region. Blue and light blue: control subjects; orange and light orange: βTh
group. Circles: females; diamonds: males. Large markers show group means and standard deviation.
Figure 9. Procrustes superimposition of the average shapes of the maxilla. Orange: βTh group, blue: Ctrl group,
solid line: males, dotted line: females.
beta thalassaemia affects the growth of the craniofacial complex. However, heavy bleeding, stability problems
due to multiple segmental osteotomies and the need to keep hemoglobin levels over 10 mg/dl postoperatively
are considerations that make this approach not suitable for all patients with beta thalassaemia30,32. During treat-
ment with fixed orthodontic appliances the forces are suggested to be lighter and the appointments to be more
frequent because of the thinner cortical bone that may hasten tooth movement in beta thalassaemia patients8.
Initial observational studies of the craniofacial complex of thalassaemia patients have shown that they are
more prone to a Class II skeletal pattern (increased facial convexity with the mandible positioned posteriorly
Scientific Reports | (2021) 11:1686 | https://doi.org/10.1038/s41598-020-80234-z 7
Vol.:(0123456789)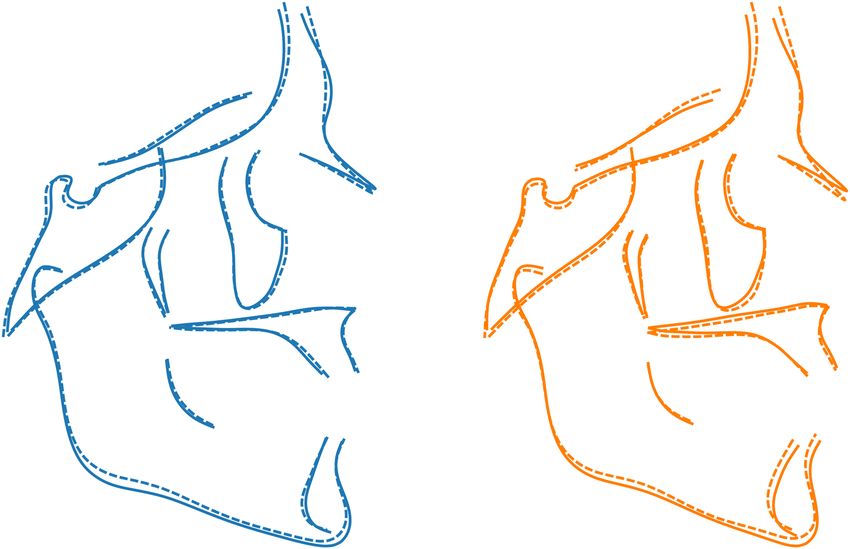
www.nature.com/scientificreports/
Figure 10. Shape space of the Mnd region. Blue and light blue: control subjects; orange and light orange: βTh
group. Circles: females; diamonds: males. Large markers show group means and standard deviation.
Figure 11. Procrustes superimposition of the average shapes of the mandible. Orange: βTh group, blue: Ctrl
group, solid line: males, dotted line: females. Left: control group, centre: males of control and βTh groups, right:
females of control and βTh groups.
at the sagittal level in relation to the maxilla), without being able to define the exact structural differences from
the normal population that could support their findings10,11. Further observational anthropometric studies are
available14,32–36, while 6 more studies15–17,37–39 and one systematic review40 could be found in the literature. These
studies used conventional cephalometrics to compare beta thalassaemia patients with controls. This is the first
study to use geometric morphometrics to evaluate the cranial structure of these patients. The results point to the
same direction with the previous observational and cephalometric studies.
Toman et al. (2011)38 concluded that the vertical dimension is the most affected in thalassaemia patients. They
demonstrated an increase in the angles related to mandibular plane inclination and a reduction in posterior face
height. They also reported a shorter mandibular body and ramus, but no differences in maxillary length. These
findings agree with the results of the present study. Moreover, the present morphometric approach presented a
reduction of the posterior to anterior facial height ratio. The counter clockwise rotation of the maxilla contributed
to this height discrepancy too.
Amini et al. (2007)15 agree with the results of the Toman et al. (2011)38 study regarding maxillary length
and position in relation to the cranial base, as well as regarding the smaller and retruded mandible. Vertical
Scientific Reports | (2021) 11:1686 | https://doi.org/10.1038/s41598-020-80234-z 8
Vol:.(1234567890)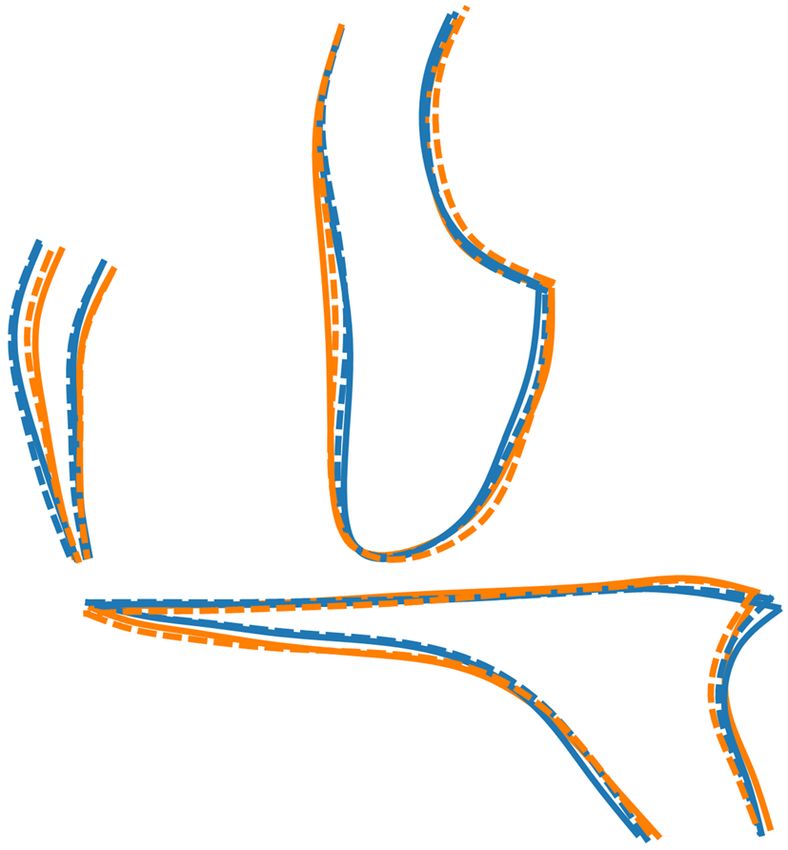
www.nature.com/scientificreports/
differences with reduction in posterior face height and a vertical face pattern were additionally reported. Con-
cerning the cranial base, Amini et al. (2007)15 did not find any differences.
Abu Alhaija et al. (2002)16 examined patients with beta thalassaemia major radiographically and clinically
and divided the sample in three categories according to patients’ dental age. Since the differences between sexes
in their study were not statistically significant, male and female measurements in each dental age group were
pooled. The authors used both conventional and the Wylie analysis in order to overcome the potential error of
using the Nasion point, since beta thalassaemia patients may present with depression of the nose bridge. They
reported a Class II pattern because of the relative projection of the maxilla on a shorter mandible and cranial
base without augmentation in maxillary length. Superimposition of the two groups in the present investigation
did not find a great amount of relocation of Nasion point, nor any differences in the length of the cranial base;
however it highlights the relative projection of the maxilla. Both studies agree on a hyperdivergent profile with
reduced posterior facial height.
Akkurt et al. (2017)37 evaluated lateral cephalometric radiographs obtained from cone-beam computed tomo-
graphic images of beta thalassaemia patients. The angular measurements revealed a hyperdivergent Class II
skeletal pattern (maxillary prognathism), whereas the linear measurements also indicated an increased length
of the maxilla and no statistically significant differences in length of the cranial base. The dental and soft tissue
variables showed protrusive lower incisors, retrusive upper incisors and an increased nasolabial angle in the
beta thalassaemia sample.
As far as sexual dimorphism is concerned, conventional cephalometric studies have shown that men have
increased total facial height and mandibular size, regarding both sagittal and vertical dimensions18, yet the
mandible is located in a clockwise rotated position in women. No sexual dimorphism in maxillary prognathism
or inclination has been r eported6,41,42. Geometric morphometric analysis has shown adequate power for assess-
ment of sexual d imorphism43,44. The present study agrees with the results emerged through both methodological
approaches. Moreover, the present morphometric approach provided additional information on sexual differ-
ences, in that the zygomatic area was less protruded, whereas the frontal area was more protruded in males
compared to females.
Conclusions
The midface in beta thalassaemia patients was protruded with a counter-clockwise rotation of the maxilla. The
mandible was smaller, posteriorly positioned and showed an increased gonial angle and clockwise rotation,
resulting in a relative reduction of the posterior facial height.
The shape of the craniofacial complex in these patients is prone to be more convex and divergent.
Shape differences tend to be more pronounced in male than in female patients.
Methods
This study was approved by the Ethics and Research Committee of the School of Dentistry, National and Kapo-
distrian University of Athens, Greece (147/31.5.2010). Informed consent was obtained from all participants and/
or their legal guardians. All methods were carried out in accordance with relevant guidelines and regulations.
Sample collection and inclusion criteria. The patients of the beta thalassaemia group were in treatment
in the Department of Hematology of “Aghia Sofia” General Children’s Hospital and referred to the Department
of Oral Diagnosis & Radiology, School of Dentistry, National and Kapodistrian University of Athens for dental
screening and orthodontic consultation. Patients who met the following inclusion criteria were eligible to partic-
ipate in the study: (a) diagnosed with beta thalassaemia, (b) of Caucasian origin, (c) without previous orthodon-
tic treatment and (d) already having a lateral cephalometric radiograph or requiring one for diagnosis. This beta
thalassaemia group (βTh) consisted of 40 patients, 24 males, 16 females, mean age 33.4 (range 8.0–59.4 years).
A control group (Ctrl) was selected from the patients seeking orthodontic treatment at the Department of
Orthodontics, School of Dentistry, National and Kapodistrian University of Athens. This group consisted of 80
healthy individuals, 48 males and 32 females, mean age 33.1 (range 7.9–60.4 years), who met the following inclu-
sion criteria: (a) Caucasian origin, (b) no craniofacial malformations or syndromes, (c) no previous orthodontic
treatment, and (d) requiring a lateral cephalometric radiograph for diagnosis and treatment planning. Each
patient of the beta thalassaemia group was age and sex matched to two individuals from the control group. The
median age difference between each βTh subject and their matched control was 0.8 years (interquartile range:
0.3–1.4) (Fig. 1). The cephalometric radiographs were taken with the aid of a cephalostat that ensures reproduc-
ible and stable patient positioning, aligning the mid-sagittal plane parallel to the film and perpendicular to the
central ray.
Morphometric methodology. The lateral cephalometric radiographs were scanned at a resolution of 150
dpi (Epson 1600 scanner, Seiko Epson Corporation, Nagano, Japan) and digitized using the Viewbox 4 software
(dHAL software, Kifissia, Greece) by the same examiner (PR). The main craniofacial structures were described
by 15 digitized curves, represented by 127 landmarks for the morphometric analysis45. Ten landmarks were fixed
and 117 were semilandmarks, allowed to slide from their initial position along a vector tangent to their respec-
tive curve (Fig. 2).
Four landmark configurations were considered: (a) the mandible (Mnd), consisting of 3 curves and 34 land-
marks, (b) the maxillary structures (Mx), 6 curves and 45 landmarks, (c) the cranial base (CrB), 4 curves and
27 landmarks, and (d) the whole craniofacial configuration (CrF), 15 curves, 127 landmarks. Independently for
each of these configurations, the following procedure was followed:
Scientific Reports | (2021) 11:1686 | https://doi.org/10.1038/s41598-020-80234-z 9
Vol.:(0123456789)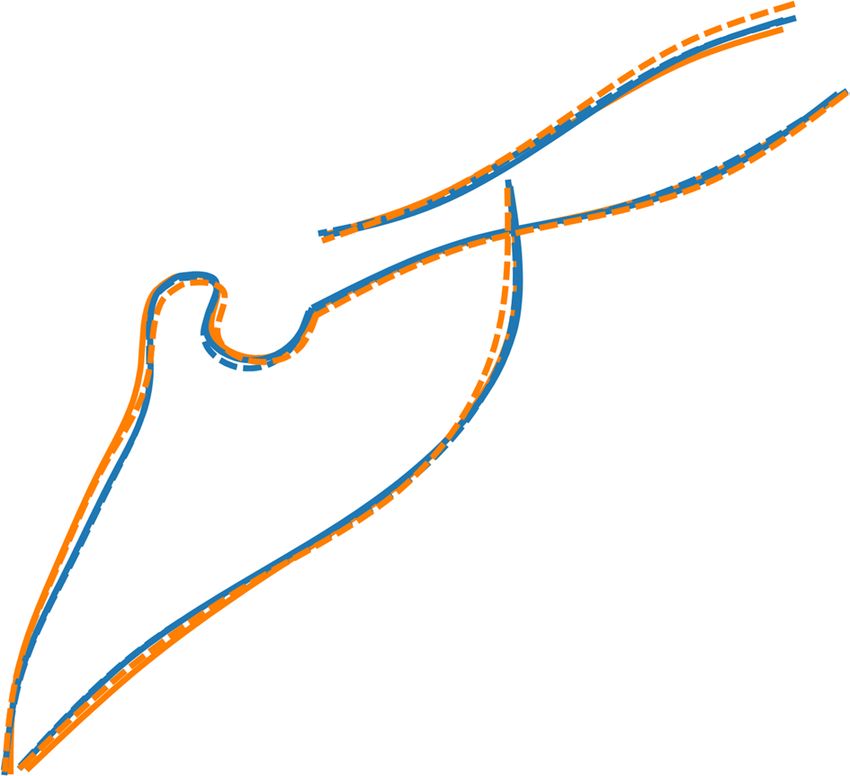
www.nature.com/scientificreports/
1. The curves were digitized.
2. The fixed landmarks were automatically located at the end points of their respective curves.
3. The semilandmarks were automatically placed by the software at predefined equidistant positions.
4. The average of the total sample was computed.
5. The semilandmarks were slid to minimize bending energy relative to the pre-computed average of step 4.
Sliding was performed along the tangent to the curve and was followed by projection of the landmark on
the curve46,47. This step was repeated 6 times to ensure convergence.
Steps 4 and 5 were repeated 3 times, each time recomputing the new average.
Following sliding, the data were subjected to a generalized Procrustes alignment (GPA)21 and Principal
Component Analysis (PCA), to extract the Principal Components (PCs) of shape variation. Digitization, sliding,
GPA and PCA were performed with the Viewbox software.
Statistical analysis. Groups were compared by permutation tests in the Viewbox software (100,000 per-
mutations, with and without replacement) using the Procrustes distance between group means and Goodall’s F
statistic as test criteria. All comparisons were conducted separately for each sex, and separately for each of the 4
landmarks configurations (CrB, Mx, Mnd, CrF).
To test for a potential effect of age on craniofacial shape, a regression of the shape variables on the logarithm
of age was run using M orphoJ48. Group comparisons were repeated using the residuals of the regression.
Error estimation. Intra-observer error was evaluated by re-tracing 20 randomly selected radiographs one
month after the first tracing. Inter-observer error was assessed by tracing the same 20 radiographs by a second
examiner with previous experience in digitizing cephalometric radiographs for morphometric studies. The Pro-
crustes distance between the repeated digitizations was measured in shape space and assessed relative to the
sample’s shape variation, which was computed as the diagonal across the shape space.
Intra- and inter-observer errors were computed as 9.6% and 10.9% of the total sample’s variance, respectively.
Data availability
All data generated or analysed during this study are included in this published article and its Supplementary
Information files.
Received: 22 February 2020; Accepted: 15 December 2020
References
1. Drew, S. J. & Sachs, S. A. Management of the thalassemia-induced skeletal facial deformity: case reports and review of the literature.
J. Oral. Maxillofac. Surg. 55, 1331–1339 (1997).
2. Cao, A. & Galanello, R. Beta-thalassemia. Genet. Med. 12, 1–76 (2010).
3. Origa, R. β-Thalassemia. Genet. Med. 19, 609–619 (2017).
4. Rund, D. & Rachmilewitz, E. Beta-thalassemia. N. Engl. J. Med. 353, 1135–1146 (2005).
5. Asadov, C. et al. β-Thalassemia intermedia: a comprehensive overview and novel approaches. Int. J. Hematol. 108, 5–21 (2018).
6. Ursi, W. J., Trotman, C. A., McNamara, J. A. Jr. & Behrents, R. G. Sexual dimorphism in normal craniofacial growth. Angle Orthod.
63, 47–56 (1993).
7. Bouguila, J., Besbes, G. & Khochtali, H. Skeletal facial deformity in patients with β thalassemia major: Report of one Tunisian case
and a review of the literature. Int. J. Pediatr. Otorhinolaryngol. 79, 1955–1958 (2015).
8. Einy, S., Ben-Barak, A., Kridin, K. & Aizenbud, D. Craniofacial deformities in patients with beta-thalassemia: orthodontic versus
surgical correction-a systematic review. J. Pediatr. Hematol. Oncol. 42, 198–203 (2020).
9. Vogiatzi, M. G. et al. Thalassemia Clinical Research Network. Bone disease in thalassemia: a frequent and still unresolved problem.
J. Bone Miner. Res. 24, 543–557 (2009).
10. Cooley, T. B. & Lee, P. Series of cases of splenomegaly in children with anemia and peculiar bone changes. Tr. Am. Pediat. Soc. 37,
29–30 (1925).
11. Logothetis, J. et al. Cephalofacial deformities in thalassemia major (Cooley’s anemia). A correlative study among 138 cases. Am.
J. Dis. Child. 121, 300–306 (1971).
12. Galanello, R. & Origa, R. Beta-thalassemia. Orphanet J. Rare Dis. 5, 11 (2010).
13 Weatherall, D. J. & Clegg, J. B. The b-thalassaemias. In The Thalassaemia Syndromes, 4th edn (eds Weatherall, D. J. & Clegg, J. B.)
290 (Blackwell Science Ltd, Hoboken, 2001).
14. Karakas, S. et al. Craniofacial characteristics of thalassemia major patients. Eurasian J. Med. 48, 204–208 (2016).
15. Amini, F., Jafari, A., Eslamian, L. & Sharifzadeh, S. A cephalometric study on craniofacial morphology of Iranian children with
beta-thalassemia major. Orthod. Craniofac. Res. 10, 36–44 (2007).
16. Abu Alhaija, E. S., Hattab, F. N. & Al-Omari, M. A. Cephalometric measurements and facial deformities in subjects with beta-
thalassaemia major. Eur. J. Orthod. 24, 9–19 (2002).
17. Başsimitçi, S., Yücel-Eroğlu, E. & Akalar, M. Effects of thalassaemia major on components of the craniofacial complex. Br. J. Orthod.
23, 157–162 (1996).
18. Miyajima, K., McNamara, J. A., Kimura, T., Murata, S. & Iizuka, T. Craniofacial structure of Japanese and European-American
adults with normal occlusions and well-balanced faces. Am. J. Orthod. DentofacialOrthop. 110, 431–438 (1996).
19. Halazonetis, D. J. Morphometrics for cephalometric diagnosis. Am. J. Orthod. DentofacialOrthop. 125, 571–581 (2004).
20 Bookstein, F. In Morphometric Tools for Landmark Data: Geometry and Biology (ed. Bookstein, F.) (Cambridge University Press,
Cambridge, 1991).
21. Rohlf, F. J. & Slice, D. Extensions of the procrustes method for the optimal superimposition of landmarks. Syst. Zool. 39, 40–59
(1990).
22. Bookstein, F. L. Reconsidering “The inappropriateness of conventional cephalometrics”. Am. J. Orthod. DentofacialOrthop. 149,
784–797 (2016).
Scientific Reports | (2021) 11:1686 | https://doi.org/10.1038/s41598-020-80234-z 10
Vol:.(1234567890)www.nature.com/scientificreports/
23. Starbuck, J. M., Cole, T. M. 3rd., Reeves, R. H. & Richtsmeier, J. T. The influence of trisomy 21 on facial form and variability. Am.
J. Med. Genet. A. 173, 2861–2872 (2017).
24. Mutsvangwa, T. E., Meintjes, E. M., Viljoen, D. L. & Douglas, T. S. Morphometric analysis and classification of the facial phenotype
associated with fetal alcohol syndrome in 5- and 12-year-old children. Am. J. Med. Genet. A. 152A, 32–41 (2010).
25. Pucciarelli, V. et al. The face of Glut1-DS patients: a 3D craniofacial morphometric analysis. Clin. Anat. 30, 644–652 (2017).
26. Lewyllie, A. et al. A comprehensive craniofacial study of 22q11.2 deletion syndrome. J. Dent. Res. 96, 1386–1391 (2017).
27. Glass, G. E. et al. The role of bipartition distraction in the treatment of Apert syndrome. Plast. Reconstr. Surg. 141, 747–750 (2018).
28. Chung, M. T. et al. Pierre Robin sequence and Treacher Collins hypoplastic mandible comparison using three-dimensional mor-
phometric analysis. J. Craniofac. Surg. 23(7 Suppl 1), 1959–1963 (2012).
29. Weber, J., Collmann, H., Czarnetzki, A., Spring, A. & Pusch, C. M. Morphometric analysis of untreated adult skulls in syndromic
and non-syndromic craniosynostosis. Neurosurg. Rev. 31, 179–188 (2008).
30. Einy, S., Hazan-Molina, H., Ben-Barak, A. & Aizenbud, D. Orthodontic consideration in patients with beta-thalassemia major:
case report and literature review. J. Clin. Pediatr. Dent. 40, 241–246 (2016).
31. Pektas, Z., Cubuk, S., Kircelli, B. & Uckan, S. Management of maxillary deformity with segmental osteotomy followed by implant
insertion in β-thalassemia major patient. J. Contemp. Dent. Pract. 16, 704–707 (2015).
32. Carson, J. L. et al. Effect of anaemia and cardiovascular disease on surgical mortality and morbidity. Lancet 348, 1055–1060 (1996).
33 Poyton, H. G. & Davey, K. W. T. Changes visible in radiographs used in dentistry. Oral Surg. Oral Med. Oral Pathol. 25, 564–576
(1968).
34. Jackson, I. T., Weel, F., Crookendale, W. A. & McMichan, J. Gross jaw deformities in thalassaemia major. Eur. J. Plast. Surg. 10,
32–36 (1987).
35. Cannell, H. The development of oral and facial signs in beta thalassaemia major. Br. Dent. J. 164, 50–51 (1988).
36. Hes, J., van der Waal, I. & de Man, K. Bimaxillary hyperplasia: the facial expression of homozygous beta-thalassemia. Oral Surg.
Oral Med. Oral Pathol. 69, 185–190 (1990).
37. Akkurt, A., Dogru, M., Dogru, A. G. & Keskin, K. Skeletal dentoalveolar and soft tissue effects of β thalassemia major. Int. Arch.
Med. Res. 9, 39–49 (2017).
38. Toman, H. A., Nasir, A. & Hassan, R. Skeletal, dentoalveolar, and soft tissue cephalometric measurements of Malay transfusion-
dependent thalassaemia patients. Eur. J. Orthod. 33, 700–704 (2011).
39. Baker, D. H. Roentgen manifestations of Cooley’s anemia. Ann. N. Y. Acad. Sci. 119, 641–661 (1964).
40. Mulimani, P., Abas, A. B., Karanth, L., Colombatti, R. & Kulkarni, P. Treatment of dental and orthodontic complications in thalas-
saemia. Cochrane Database Syst. Rev. 8, CD012969 (2019).
41. Johannsdottir, B. Craniofacial skeletal and soft tissue morphology in Icelandic adults. Eur. J. Orthod. 26, 245–250 (2004).
42. Daraze, A., Delatte, M., BouSaba, S. & Majzoub, Z. Craniofacial characteristics in the sagittal dimension: a cephalometric study
in Lebanese young adults. Int. Orthod. 15, 114–130 (2017).
43. Kimmerle, E. H., Ross, A. & Slice, D. Sexual dimorphism in America: geometric morphometric analysis of the craniofacial region.
J. Forensic Sci. 53, 54–57 (2008).
44. Pretorius, E., Steyn, M. & Scholtz, Y. Investigation into the usability of geometric morphometric analysis in assessment of sexual
dimorphism. Am. J. Phys. Anthropol. 129, 64–70 (2005).
45. Cocos, A. & Halazonetis, D. J. Craniofacial shape differs in patients with tooth agenesis: geometric morphometric analysis. Eur. J.
Orthod. 39, 345–351 (2017).
46. Gunz, P. & Mitteroecker, P. Semilandmarks: a method for quantifying curves and surfaces. Hystrix It. J. Mamm. 24, 1–7 (2013).
47. Bookstein, F. L. Landmark methods for forms without landmarks: morphometrics of group differences in outline shape. Med.
Image Anal. 1, 225–243 (1997).
48. Klingenberg, C. P. MorphoJ: an integrated software package for geometric morphometrics. Mol. Ecol. Resour. 11, 353–357 (2011).
Acknowledgements
The authors would like to thank Dimitris Sampaziotis, postgraduate student of the Department of Orthodontics
of National and Kapodistrian University of Athens, who re-traced the radiographs to evaluate inter-observer
error.
Author contributions
P.R. had full access to the study data. Data collection: A.M., I.S. Data analysis: P.R., D.H. Drafting of the manu-
script: All. Critical revision of the manuscript: All. I.S. was the supervisor and takes full responsibility for the
integrity of the final decision to submit the manuscript.
Competing interests
The authors declare no competing interests.
Additional information
Supplementary Information The online version contains supplementary material available at https://doi.
org/10.1038/s41598-020-80234-z.
Correspondence and requests for materials should be addressed to I.S.
Reprints and permissions information is available at www.nature.com/reprints.
Publisher’s note Springer Nature remains neutral with regard to jurisdictional claims in published maps and
institutional affiliations.
Scientific Reports | (2021) 11:1686 | https://doi.org/10.1038/s41598-020-80234-z 11
Vol.:(0123456789)www.nature.com/scientificreports/
Open Access This article is licensed under a Creative Commons Attribution 4.0 International
License, which permits use, sharing, adaptation, distribution and reproduction in any medium or
format, as long as you give appropriate credit to the original author(s) and the source, provide a link to the
Creative Commons licence, and indicate if changes were made. The images or other third party material in this
article are included in the article’s Creative Commons licence, unless indicated otherwise in a credit line to the
material. If material is not included in the article’s Creative Commons licence and your intended use is not
permitted by statutory regulation or exceeds the permitted use, you will need to obtain permission directly from
the copyright holder. To view a copy of this licence, visit http://creativecommons.org/licenses/by/4.0/.
© The Author(s) 2021
Scientific Reports | (2021) 11:1686 | https://doi.org/10.1038/s41598-020-80234-z 12
Vol:.(1234567890)You can also read


