A novel predictive model incorporating immune related gene signatures for overall survival in melanoma patients
←
→
Page content transcription
If your browser does not render page correctly, please read the page content below
www.nature.com/scientificreports
OPEN A novel predictive model
incorporating immune‑related
gene signatures for overall survival
in melanoma patients
Mengting Liao1,2,3,4,5, Furong Zeng2,3,4,5, Yao Li2,3,4, Qian Gao2,3,4, Mingzhu Yin2,3,4,
Guangtong Deng2,3,4* & Xiang Chen2,3,4*
Melanoma is the most invasive type of skin cancer, in which the immune system plays a vital role.
In this study, we aimed to establish a prognostic prediction nomogram for melanoma patients that
incorporates immune-related genes (IRGs). Ninety-seven differentially expressed IRGs between
melanoma and normal skin were screened using gene expression omnibus database (GEO). Among
these IRGs, a two-gene signature consisting of CCL8 and DEFB1 was found to be closely associated
with patient prognosis using the cancer genome atlas (TCGA) database. Survival analysis verified that
the IRGs score based on the signature gene expressions efficiently distinguished between high- and
low-risk patients, and was identified to be an independent prognostic factor. A nomogram integrating
the IRGs score, age and TNM stage was established to predict individual prognosis for melanoma. The
prognostic performance was validated by the TCGA/GEO-based concordance indices and calibration
plots. The area under the curve demonstrated that the nomogram was superior than the conventional
staging system, which was confirmed by the decision curve analysis. Overall, we developed and
validated a nomogram for prognosis prediction in melanoma based on IRGs signatures and clinical
parameters, which could be valuable for decision making in the clinic.
Abbreviations
PD-1 Programmed death-1
CLTA-4 Cytotoxic T-lymphocyte antigen 4
GEO Gene expression omnibus
TCGA The cancer genome atlas
DEGs Differentially expressed genes
IRGs Immune-related genes
DE-IRGs Differentially expressed immune-related genes
KEGG Kyoto encyclopedia of genes and genomes
GO Gene ontology
PPI Protein-protein interactions
LASSO Least absolute shrinkage and selection operator
OS Overall survival
GEPIA Gene expression profiling interactive analysis
ROC Receiver operating characteristic
AUC Area under the curve
DCA Decision curve analysis
HR Hazard ratio
1
Health Management Center, Xiangya Hospital, Central South University, Changsha 410008, China. 2Department
of Dermatology, Xiangya Hospital, Central South University, Xiangya Road 87, Changsha 410008, China. 3Hunan
Key Laboratory of Skin Cancer and Psoriasis, Changsha 410008, China. 4Hunan Engineering Research Center of
Skin Health and Disease, Changsha 410008, China. 5These authors contributed equally: Mengting Liao and Furong
Zeng. *email: dengguangtong@outlook.com; chenxiangck@126.com
Scientific Reports | (2020) 10:12462 | https://doi.org/10.1038/s41598-020-69330-2 1
Vol.:(0123456789)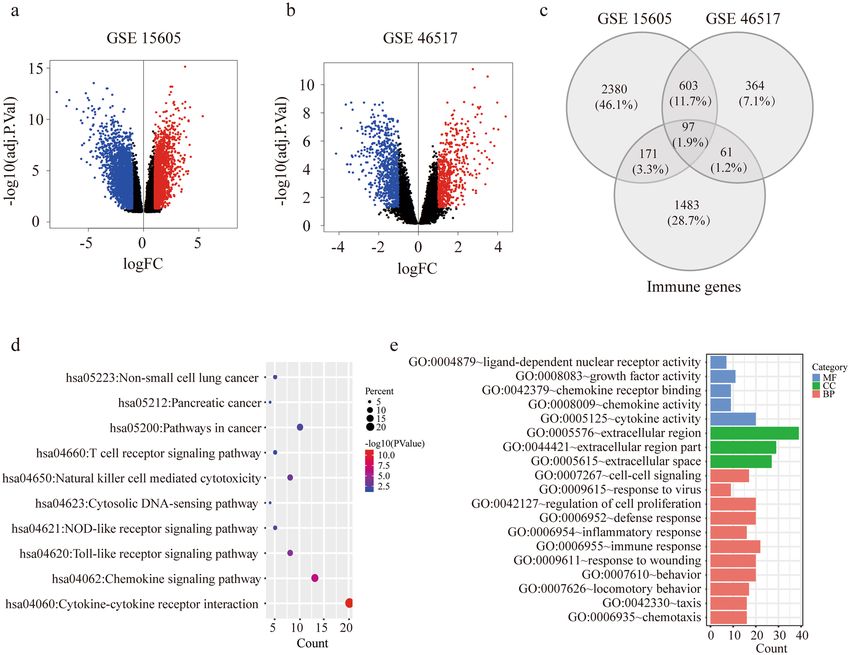
www.nature.com/scientificreports/
CI Confidence interval
GSEA Gene set enrichment analysis
Melanoma is an aggressive malignancy with incidence rate constantly growing over the past 40 years1–3. There
were approximately 287,723 new cases and 60,712 deaths of melanoma in 2018 globally4. The prognosis of
melanoma is generally unfavorable, with a 5-year overall survival (OS) ranging from 30 to 55% in recent clini-
cal trials for immunotherapy5,6. Much effort has been put into identifying biomarkers to evaluate the prognosis
of melanoma p atients7,8. Currently well-established markers include clinicopathologic features such as depth
of tumor and ulceration, molecular biomarkers S100, HMB-45 and serum LDH according to the American
Joint Committee on Cancer (AJCC) staging s ystem9–12. However, these markers still remain deficient given that
patients at the same stage could have varied survival outcomes. Therefore, developing more superior biomarkers
for melanoma is in urgent need.
Immune system is largely involved in surveillance and elimination of melanoma, while immunosuppression
potentiates its proliferation and m etastasis13. Over the past decade, mechanistic understanding of immune regu-
lation in tumor fueled the development of novel immunotherapy, including checkpoint inhibitors PD-1 (pro-
grammed death-1) and CTLA-4 (cytotoxic T-lymphocyte antigen 4) monoclonal antibodies, which transformed
the prognosis for many patients14–17. Consequently, increasing research began to focus on finding immune-related
biomarkers18. Typically, PD-L1 expression, tumor mutational burden and tumor infiltrating T cells are shown
to be predictive of patient outcomes, but these markers are used only for reference in the clinic due to their
insufficient sensitivity and s pecificity19–23. Moreover, the development of combined immune markers recently
arose, for single biomarkers can be inadequate to achieve desirable e fficiency24,25. Despite all these, no combined
immune markers are formally validated or recommended as a clinical tool for p rognosis9.
Bioinformatics analysis based on public database has been used to investigate the prognostic markers in
various cancers, with which predictive models can be established to assess individual s urvival26. Until now,
there have been a few nomograms for melanoma prognosis prediction, which however, are limited by including
merely clinical features as their evaluation indicators, without regard to any gene expression information, let
alone combined immune m arkers27,28. In this study, we identified immune-related genes (IRGs) that optimally
predicted OS in melanoma, with the use of Gene Expression Omnibus (GEO) and The Cancer Genome Atlas
(TCGA) database. For the first time, a prognostic nomogram combining IRGs score with clinical characteristics
was constructed, thus providing values for recognizing high risk patients and helping with individualized treat-
ment strategy options.
Methods
Data retrieval and processing. Transcriptome profiling datasets and clinical parameters were down-
loaded from Gene Expression Omnibus (GEO) (https://www.ncbi.nlm.nih.gov/geo) and The Cancer Genome
Atlas (TCGA) database (https://xenabrowser.net/datapages). GSE15605 and GSE46517 were used to screen dif-
ferentially expressed genes (DEGs). TCGA melanoma dataset was selected as the training dataset which included
460 melanoma samples. GSE54467 dataset including 79 melanoma samples was selected as the GEO validation
dataset. The DEGs in TCGA and GEO dataset were overlapped and their expressions were normalized using
“limma” and “sva” packages in R version 3.6.0 software. IRGs were acquired from the ImmPort database (https
://www.immport.org).
Identification of differential expressed immune‑related genes. GSE15605 including 46 primary
melanoma patient samples and 16 normal skin samples and GSE46517 consisting of 31 primary melanoma
patient samples and 7 normal skin samples were used to extract DEGs using GEO2R. Benjamini & Hochberg
false discovery rate method was used as a P value adjustment. Adjusted P < 0.05 and log (fold change) ≥ 1 were
considered as statistically significant. The overlap of the DEGs and IRGs was selected as the set of the differen-
tially expressed immune-related genes (DE-IRGs) for further analysis and visualized via Venn diagram.
Functional analysis with DE‑IRGs. Kyoto Encyclopedia of Genes and Genomes (KEGG) and Gene
Ontology (GO) enrichment pathway analyses were performed to investigate the molecular functions, cellular
component and biological processes of DE-IRGs. Signaling pathways that significantly related (P < 0.05) to DE-
IRGs were identified by DAVID (https://david.ncifcrf.gov/). Protein–protein interactions (PPI) network of the
DE-IRGs were explore by The STRING database (https://string-db.org) where confidence score ≥ 0.4 was u sed29,
and visualized with Cytoscape v. 3.7.1 (https://cytoscape.org/). Hub nodes were identified with the Cytoscape
plugin cytoHubba by the maximal clique centrality method. DE-IRGs clusters that strongly correlated in the PPI
network were identified with the Cytoscape plugin MCODE. GO enrichment analysis were further performed
on DE-IRGs clusters.
Identification and validation of the prognostic IRGs score. Univariate Cox analysis was first per-
formed to screen the DE-IRGs significantly associated with overall survival (OS) in TCGA melanoma dataset
using the “survival” package. Next, genes with P < 0.01 by the univariate analysis were chosen for least absolute
shrinkage and selection operator (LASSO) logistic regression. Genes with nonzero coefficients were subsequently
selected for multivariate Cox analysis to identify the independent prognostic genes. P < 0.05 was regarded as sta-
tistically significant in the multivariate Cox analysis. With these independent prediction genes, the IRGs score
for OS was further calculated as follows: IRG score = β1*X1 + β1*X1 + … + βn*Xn (β: the coefficient derived from
multivariate regression; X: gene expression value). The median risk score was chosen as a cutoff value in TCGA
melanoma dataset, which was also used to separate patients in GEO validation datasets into high-risk or low-risk
Scientific Reports | (2020) 10:12462 | https://doi.org/10.1038/s41598-020-69330-2 2
Vol:.(1234567890)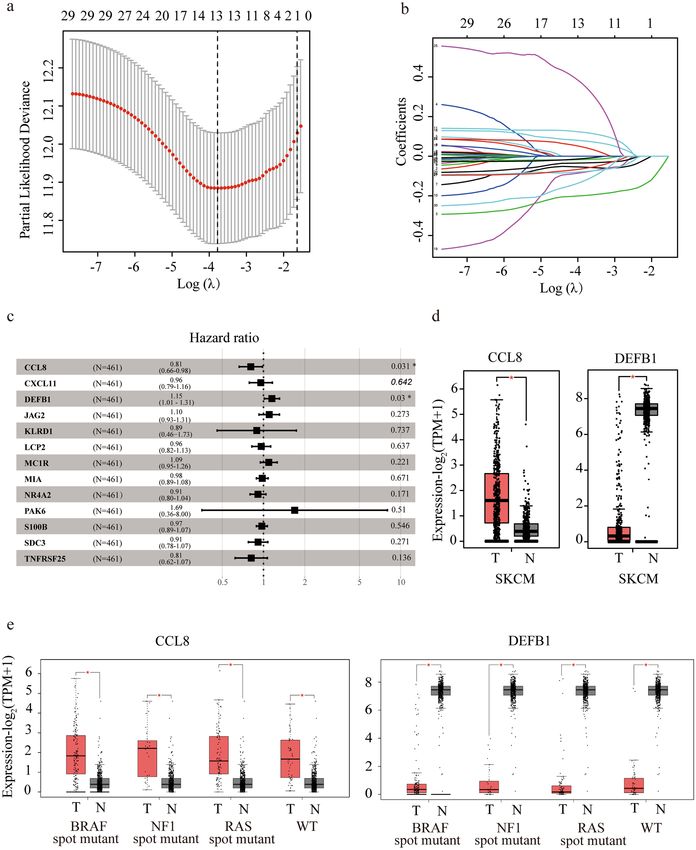
www.nature.com/scientificreports/
group30–32. Accordingly, a Kaplan–Meier survival curve was constructed to describe the survival of patients in
the high-risk and low-risk group. Furthermore, patient clinicopathological features including age, gender, local
ulceration, Breslow depth and tumor stage were obtained from TCGA melanoma dataset; Age, gender and stage
were obtained from GEO validation dataset. Univariate and multivariate Cox regression with both IRGs score
and clinicopathological features were performed to find out the independent prediction factors significantly
associated with survival. To explore whether the IRGs score is helpful in the application of immunotherapy,
GSE78220 dataset which includes a melanoma patient cohort treated with anti-PD-1 therapy and pre-treatment
RNA sequencing data was analyzed. IRGs score, high- and low-risk groups were generated by the calculation
formula and cutoff value described above. The proportions of anti-PD-1 therapy responders and non-responders
in low-risk and high-risk groups were obtained.
Gene set enrichment and pathway analysis (GSEA). To illustrate the biological functions of the prog-
nostic genes in high-risk and low-risk patient groups, GSEA was performed in java GSEA (verision 3.0) based
on the Molecular Signatures Database version 6.233. With the 460 melanoma samples in TCGA dataset, KEGG
pathways, biological processes, cellular components, molecular functions associated with high-risk and low-risk
groups were identified by using C2 (curated gene sets), C5 (GO gene sets). FDR q value < 0.05, |NES|> 1 were
considered statistically significant.
Validation of CCL8 and DEFB1 expression. Gene expression profiling interactive analysis (GEPIA) is
a website server to analyze the RNA sequencing data of tumors and normal samples from the TCGA and the
Genotype-Tissue Expression (GTEx) projects (https://gepia.cancer-pku.cn/index.html). Expressions of CCL8
and DEFB1 were plotted with GEPIA in cutaneous melanoma and its subtypes.
Development and validation of the nomogram. Following multivariate analysis, all independent
prognostic predictors including age, stage and IRGs score were used to develop a nomogram. Concordance
index, receiver operating characteristic (ROC), area under the curve (AUC) and calibration curves were applied
to evaluate the discrimination and accuracy of the nomogram. Decision curve analysis (DCA) was conducted to
evaluate the clinical utility of the nomogram and TNM stage through quantifying net benefits against a range of
threshold probabilities34,35. Finally, the prognostic nomogram was externally validated in the GEO dataset. All
analyses were conducted in R software. The packages of R used in this study included “rms”, “foreign”, “survival”,
“survivalROC” and "stdca.R". P < 0.05 was considered statistically significant unless otherwise noted.
Results
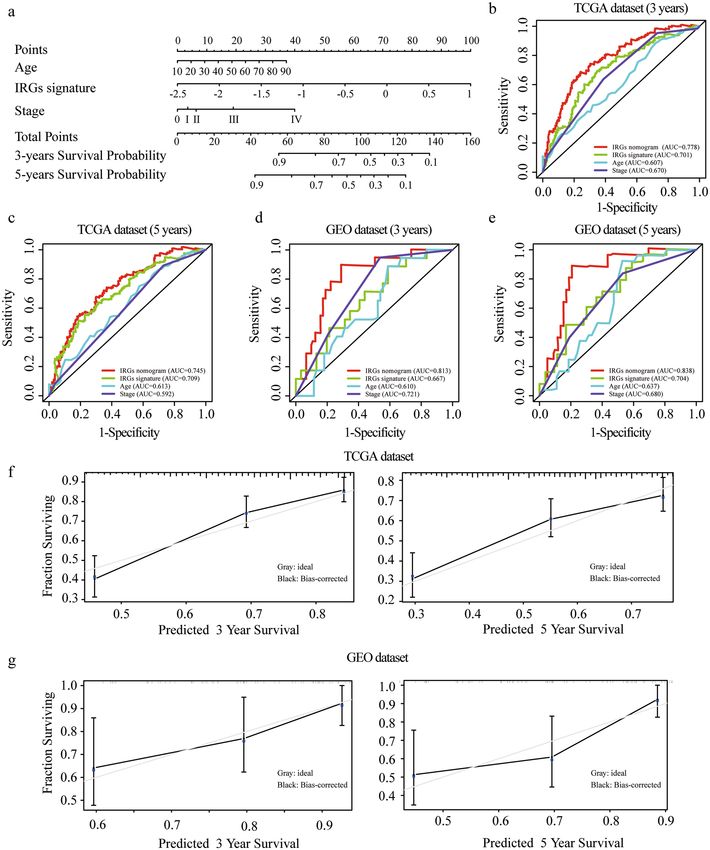
Screening of differentially expressed IRGs on melanoma. The whole workflow for the study was
presented in Fig. 1. By comparing expression profiles from melanoma tissue and normal skin in GSE15605 and
GSE46517 dataset, 3,251 and 1,125 genes were identified as DEGs respectively with volcano plot analysis (FC ≥ 1,
FDR ≤ 0.05) (Fig. 2a, b). A total of 1812 immune-related genes (IRGs) were downloaded from Immport data-
base. Ninety-seven candidate genes, defined as DE-IRGs, were overlapped between DEGs and IRGs and visual-
ized by Venn diagram (Fig. 2c). Finally, 81 DE-IRGs were identified mapped with TCGA (melanoma) dataset
and GEO (GSE54467) dataset, where patient survival information was available for downstream prognostic gene
identification.
Functional enrichment and PPI network analysis of DE‑IRGs. KEGG and GO enrichment pathway
analyses were applied to discover the functions of the 81 DE-IRGs (Fig. 2d,e). The DE-IRGs were remarkably
enriched in biological processes related to chemokine signaling pathway and cytokine-cytokine receptor interac-
tions from KEGG analysis. And the extracellular region, immune response and cytokine activity were enriched
in the DE-IRGs from GO analysis. These indicated an immune-related, secretary and soluble factor dominant
function in DE-IRGs. A PPI network of the 81 DE-IRGs was established, where 76 nodes and 324 interactions
was constructed, to identify the interactions between genes (Supplementary figure S1a). The top 15 candidate
genes were identified to be significantly involved in the network (Supplementary figure S1b). Module analysis
recognized related clustering modules in the PPI network (Supplementary figure S1c). With the DE-IRGs clus-
ters, GO analysis were applied for functional enrichment (Supplementary figure S1d). The results from PPI net-
work and pathway analysis suggested the extracellular region, specifically multiple chemokines and cytokines,
were densely connected and enriched in the DE-IRGs.
Identification of CCL8 and DEFB1 as the independent prognostic DE‑IRGs. With the 81 can-
didate DE-IRGs identified, TCGA melanoma dataset (training) and GEO GSE54467 dataset (validation) were
used to recognize the genes associated with survival. Clinical features of these two datasets were summarized in
Supplementary table S1. The 81 DE-IRGs in TCGA melanoma dataset were analyzed in univariate Cox analysis,
and 30 DE-IRGs were significantly associated with patient survival (P < 0.01) (Supplementary table S2). Then, a
LASSO logistic regression was applied to avoid collinearity of multiple variables, and 13 DE-IRGs were obtained
(Fig. 3a). Coefficient of each gene in TCGA melanoma dataset was illustrated in Fig. 3b. With the 13 DE-IRGs
selected, multivariate Cox regression were further performed to figure out the association of gene expression
with the patient OS, where CCL8 (HR = 0.81, 95% CI 0.66–0.98, P = 0.031) and DEFB1 (HR = 1.15, 95% CI 1.01–
1.31, P = 0.030) were finally identified to be the independent prognostic genes (Fig. 3c). In addition, the differ-
ential expressions of CCL8 and DEFB1 were validated with GEPIA program in all mutation subtypes including
BRAF, NF1, RAS mutations and triple wild type (Fig. 3d,e).
Scientific Reports | (2020) 10:12462 | https://doi.org/10.1038/s41598-020-69330-2 3
Vol.:(0123456789)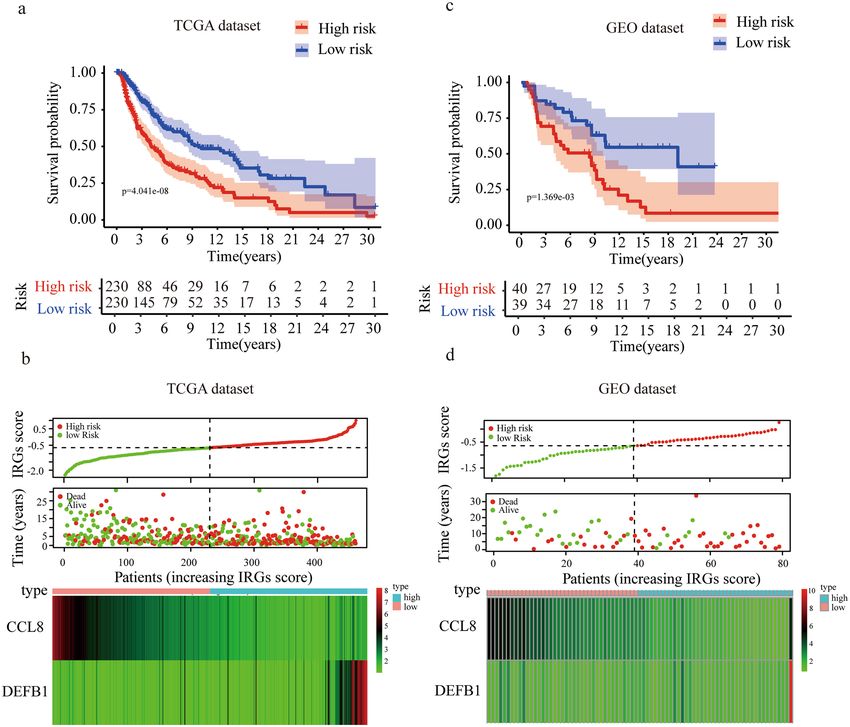
www.nature.com/scientificreports/
Figure 1. Overall design of the present study. DEGs differentially expressed genes, IRGs immune-related genes,
DE-IRGs differentially expressed immune-related genes, TCGAthe cancer genome atlas, GEO gene expression
omnibus, LASSO least absolute shrinkage and selection operator, C-index concordance index, ROC receiver
operating characteristic, AUCarea under the curve, DCA decision curve analysis.
Development and validation of IRGs score model. The independent prognostic genes CCL8 and
DEFB1 were chosen to establish a risk score model. From multivariate Cox regression, the coefficients for CCL8
and DEFB1 were − 0.364 and 0.200 respectively. Therefore, the IRG score of each patient was calculated accord-
ing to the formula: IRGs score = (− 0.364) × (expression value of CCL8) + 0.200 × (expression value of DEFB1).
The patients were divided into high- and low-risk groups based on the median risk score (− 0.644) in TCGA
melanoma dataset. Kaplan–Meier survival analysis showed that patients in the high-risk group had significantly
shorter OS than those in the low-risk group (Fig. 4a). The distribution of the risk score, OS, expressions of CCL8
and DEFB1 were also presented, suggesting that patients with high-risk score had lower expressions of CCL8,
higher expressions of DEFB1 and more death cases (Fig. 4b). To confirm the robustness of our model, GEO
dataset (GSE54467) which included 79 melanoma patients was applied as the external validation. The patients
were divided into high- and low-risk groups according to the same formula and cutoff above. Consistent with the
previous results, high-risk patients had significantly worse survival than low-risk patients (Fig. 4c). Expressions
of decreased CCL8, increased DEFB1 and more deaths were found in high-risk group than in low-risk group in
the GEO validation dataset (Fig. 4d). To further explore the application of IRGs in immunotherapy, we analyzed
the pre-treatment mRNA data of 26 melanoma patients who received anti-PD-1 therapy in GSE78220 dataset.
Scientific Reports | (2020) 10:12462 | https://doi.org/10.1038/s41598-020-69330-2 4
Vol:.(1234567890)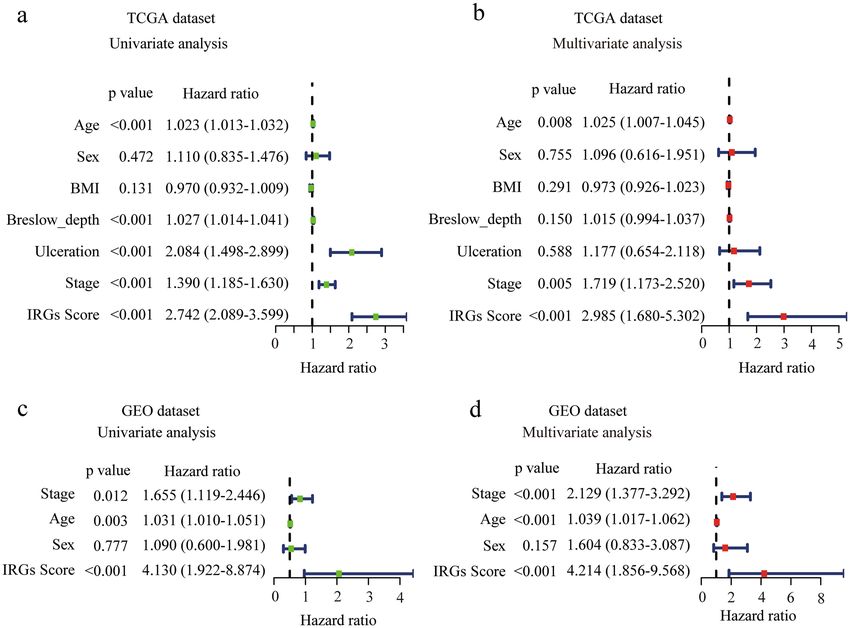
www.nature.com/scientificreports/

                            Figure 2.  Identification of DE-IRGs and functional enrichment analysis. (a,b) Volcano plot illustrating
                            differentially expressed genes (DEGs) between melanoma tissue and normal skin in GSE15605 (a) and
                            GSE46517 (b). (c) Venn diagram of the overlapped genes between DEGs and IRGs. (d) Enriched Kyoto
                            Encyclopedia of Genes and Genomes (KEGG) pathways of DE-IRGs. (e) Enriched Gene Ontology (GO)
                            pathways of DE-IRGs. MF molecular funcion, CC cell component, BP biological process.

                            According to the IRGs score model described above, 11 and 15 patients were identified as high- and low-risk
                            patients respectively. Surprisingly, 9 (81.8%) high-risk patients responded to the therapy, while only 5 (33.3%)
                            low-risk patients responded, which suggested the high-risk patients were more sensitive to anti-PD-1 treatment
                            than the low-risk group (Supplementary figure S2).

                            Gene set enrichment and pathway analysis for DE‑IRGs. To investigate the underlying molecular
                            mechanism of the IRGs signature, we conducted GSEA comparing the high-risk group with the low-risk group
                            in 460 melanoma patients from TCGA. There was no GO or KEGG pathway significantly enriched in the high-
                            risk group. However, 946 and 35 pathways in GO and KEGG analysis were identified to be associated with low-
                            risk group, and the top 10 significant terms for each module were summarized in Supplementary table S3. The
                            results demonstrated a major role of antigen presenting cells and T cells in the low-risk group (Supplementary
                            figure S3).

                            Development and validation of nomogram based on IRGs and clinicopathological risk fac‑
                            tors. To construct a clinical nomogram that predicts the prognosis of melanoma patients, the clinicopatho-
                            logical factors including age, gender, ulceration, Breslow depth and stage, as well as IRGs score in TCGA mela-
                            noma dataset were analyzed with univariate and multivariate Cox analysis (Fig. 5a,b). Importantly, IRGs score
                            was shown to be significantly associated with OS in both with univariate and multivariate analyses. Independ-
                            ent prognostic predictors for melanoma were found to be IRGs score (HR = 2.985, 95%CI 1.680–5.302), age
                            (HR = 1.025, 95%CI 1.007–1.045) and stage (HR = 1.719, 95%CI 1.173–2.520) by multivariate analysis (Fig. 5b).
                            We reached a similar conclusion in GEO validation dataset (IRGs score: HR = 4.214, 95%CI 1.856–9.568, age:
                            HR = 1.039, 95%CI 1.017–1.062, and stage (HR = 2.129, 95%CI 1.377–3.292) (Fig. 5c,d).

Scientific Reports |   (2020) 10:12462 |              https://doi.org/10.1038/s41598-020-69330-2                                            5

                                                                                                                                       Vol.:(0123456789)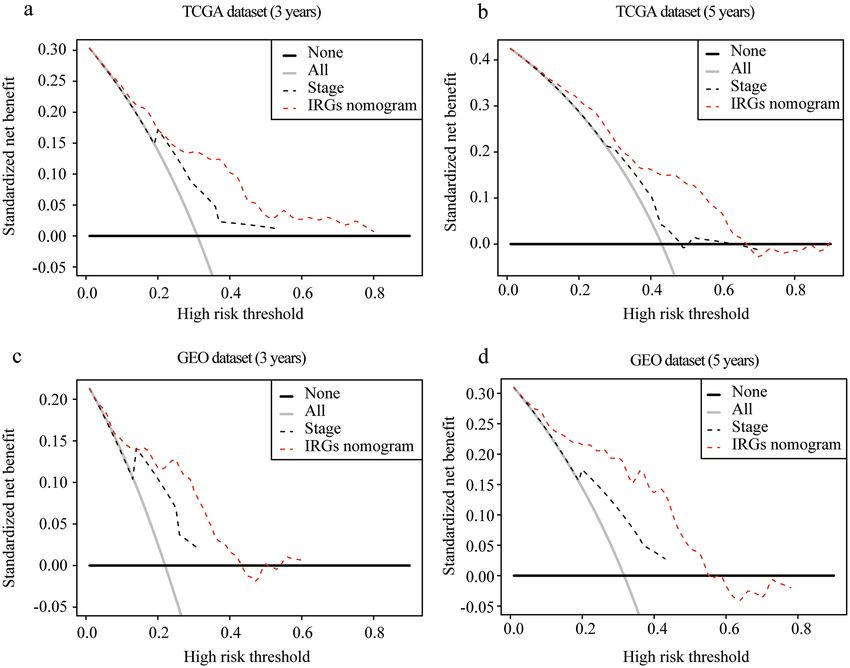
www.nature.com/scientificreports/

                                      Figure 3.  Screening and verification of prognosis-related IRGs. (a,b) LASSO analysis for selecting the candidate
                                      IRGs in TCGA dataset. (c) Forest plot by multivariate analysis showing hazard ratio of the candidate IRGs.
                                      (d,e) Boxplots showing expressions of identified IRGs in melanoma tissue and normal skin in general (d) or its
                                      subtype (e) from Gene expression profiling interactive analysis (GEPIA). SKCM: skin cutaneous melanoma; T:
                                      tumor; N: normal; WT: wild type.

          Scientific Reports |   (2020) 10:12462 |              https://doi.org/10.1038/s41598-020-69330-2                                           6

Vol:.(1234567890)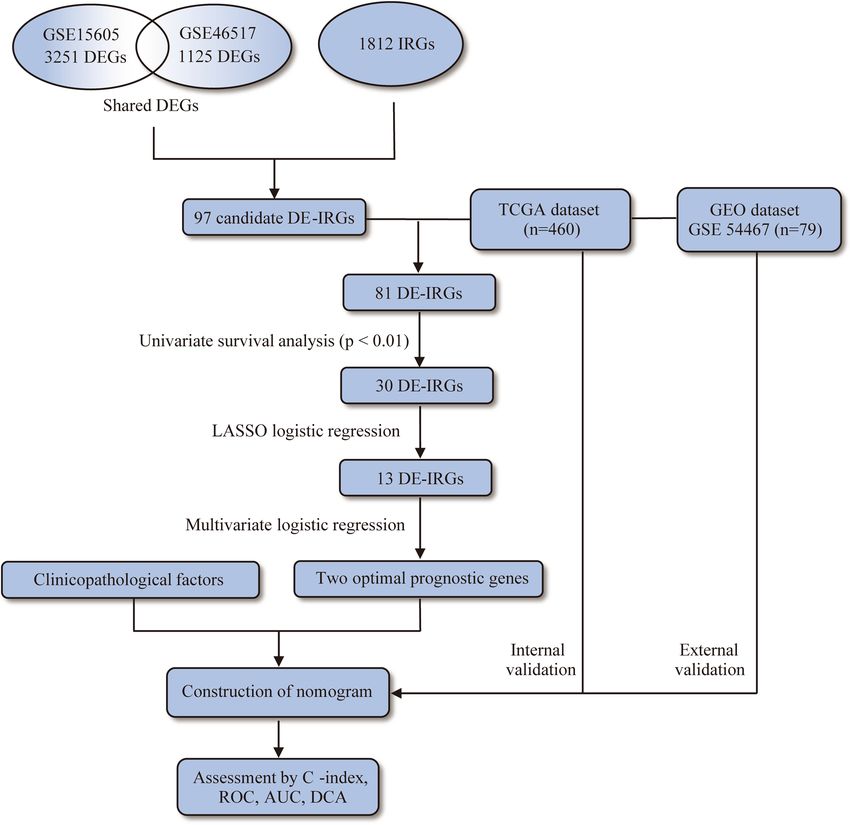
www.nature.com/scientificreports/

                            Figure 4.  Prognostic analysis of the IRGs signature. (a,c) Kaplan–Meier survival curves of patients in high
                            versus low risk groups in TCGA (a) and GEO datasets (c). (b,d) Distribution of IRGs score and survival days of
                            each patient, and a heatmap of selected IRG expression profiles presented in order of IRGs score in TCGA (b)
                            and GEO datasets (d).

                                With the combination of age, stage and IRGs score, we established an IRGs nomogram based on TCGA
                            melanoma dataset to predict the individual risk of 3-year or 5-year survival (Fig. 6a). The concordance index
                            of the nomogram was 0.705. Moreover, ROC analyses suggested that the nomogram achieved a superior 3-year
                            prediction efficacy with an AUC of 0.778 compared to other models such as IRGs signature (0.701), age (0.607),
                            and tumor stage (0.670), and a better 5-year prediction efficacy with an AUC of 0.745 compared to IRGs signature
                            (0.709), age (0.613), and tumor stage (0.592) (Fig. 6b,c). Also, calibration curves indicated excellent agreement
                            between the nomogram prediction and actual observation in terms of the 3-year and 5-year survival rates in the
                            TCGA melanoma dataset (Fig. 6f). In addition, the nomogram of GEO validation dataset reached a concord-
                            ance index of 0.715. ROC analyses in the validation dataset demonstrated that the nomogram generated an AUC
                            of 0.813 higher than that in IRGs signature (0.667), age (0.610), and tumor stage (0.721) in 3-year prediction,
                            and an AUC of 0.838 in the nomogram higher than that in IRGs signature (0.704), age (0.637), and tumor stage
                            (0.680) in 5-year prediction (Fig. 6d,e). Calibration curves also showed a satisfactory goodness-of-fit in GEO
                            dataset (Fig. 6g). Decision Curve Analysis (DCA) has been used to assess the clinical value of models which
                            integrates the preferences of the patients into analysis. DCAs results for the nomogram and the stage model in
                            3-year and 5-year survival predictions were presented in Fig. 7, showing that melanoma prognostic prediction
                            based on the nomogram added more net benefit than the “treat all”, “treat none” strategies and the stage model
                            in both TCGA and GEO datasets.

Scientific Reports |   (2020) 10:12462 |              https://doi.org/10.1038/s41598-020-69330-2                                             7

                                                                                                                                      Vol.:(0123456789)
www.nature.com/scientificreports/
Figure 5. Determination of IRGs score as an independent prognostic factor in melanoma. (a,b) Forest plot
showing the risk of IRGs score and clinical parameters for overall survival by univariate (a) and multivariate (b)
analysis in TCGA dataset. (c,d) Forest plot showing the risk of IRGs score and clinical parameters for overall
survival by univariate (c) and univariate (d) analysis in GEO dataset. P < 0.05 was regarded as statistically
significant.
Discussion
Melanoma is the most invasive type of skin cancer with a challenge to identify prognostic biomarkers. As a
cancer largely regulated by immune system, the development of immune-related biomarkers would be of much
value36–38. And prediction model for prognosis based on multiple markers including immune genes would
potentially help with selecting the optimal therapy in the clinic.
In this study, we sorted out the most influential immune-related genes affecting patient survival with public
database and bioinformatical method. Combining several clinical features, we generated a nomogram model
that was capable of predicting patient outcomes. Notably, a satisfying AUC was obtained with patient age, stage
and expressions of only two genes, which means that in our model, a relatively accurate survival prediction for
prognosis can be achieved with a handful of accessible parameters. Further, the comparison between nomogram
and other models demonstrated that, our nomogram, which included staging information, had a significantly
higher efficiency than staging system alone, with AUC raised from 0.670 to 0.778 in 3-year prediction and from
0.592 to 0.745 in 5-year prediction. This suggests that although tumor stage is a traditional indicator when pre-
dicting prognosis, the additional factors in our nomogram, IRGs signatures consisting CCL8 and DEFB1, and
the age of patients, are also worth considering.
CCL8 was shown to be negatively correlated with high-risk status in our study. In present literatures, CCL8 is
a cytokine that promotes the metastasis in kinds of tumors, including breast cancer, lung cancer and esophageal
squamous cell carcinoma39–41. The role of CCL8 is controversial when it comes to melanoma. Tamas Barbai et al.
found an increased migration of melanoma cell lines with CCL8 added as a chemoattractant, whereas Kiyokazu
Hiwatashi et al. demonstrated that CCL8 suppressed metastatic ability of B16F10 melanoma cells42,43. Our results,
however, showed that higher expression of CCL8 indicated better survival in patients, which was confirmed by
external validation. This is in favor of the point that CCL8 in melanoma might play a protective role overall, of
which the mechanism warrants further investigation.
DEFB1 is a peptide with multiple immune-related functions and is thought to be a tumor s uppressor44,45. It
was found to be downregulated in renal, prostate and colorectal cancers46,47. Our study demonstrated for the first
Scientific Reports | (2020) 10:12462 | https://doi.org/10.1038/s41598-020-69330-2 8
Vol:.(1234567890)www.nature.com/scientificreports/
Figure 6. Developing and validating a nomogram based on the IRGs risk score model. (a) A prognostic
nomogram through combining the IRGs score and clinical parameters. (b,e) ROC curves of IRGs nomogram
compared with stage, age or IRGs score alone in TCGA 3-year (b) and 5-year (c) prediction and GEO 3-year (d)
and 5-year (e) prediction. (f,g) Calibration curves for TCGA (f) and GEO (g) dataset. The grey line represents a
perfect prediction, and the black line describes the predictive performance of the nomogram, where the fitness
of the black line to the grey line indicates a good prediction by the model.
Scientific Reports | (2020) 10:12462 | https://doi.org/10.1038/s41598-020-69330-2 9
Vol.:(0123456789)www.nature.com/scientificreports/
Figure 7. Model comparison and clinical usefulness of IRGs nomogram. Decision curve analysis of the
nomogram model in TCGA 3-year (a) and 5-year (b) prediction and GEO 3-year (c) and 5-year (d) prediction.
The clinical usefulness of IRGs nomogram model and the stage evaluation system were compared to treating
none or all of the patients. The higher the net benefit, the better the evaluation model was. In both training and
validation sets, using the IRGs nomogram to predict patient prognosis added more benefit than treating none or
all patients, and was more beneficial compared to using the stage evaluation to predict.
time, an aberrant expression of DEFB1 in melanoma compared to normal skin. However, little was known about
its function in melanoma, except for that Lara Fernandez et al. reported that genetic variations of DEFB1 might
be correlated with the risk for melanoma, but they did not perform confirmatory studies on this conclusion48.
In this study, we showed that the higher DEFB1 expression indicated unfavorable prognosis, which would be
informative in clinical evaluation for patients. On the other hand, though identified as a tumor suppressor gene
by previous research, DEFB1 might play a different role in melanoma than other types of cancer, which could
potentially fuel mechanistic research on its unfavorable role in melanoma. Taken together, DEFB1 is indicative
of patient survival and is a potential biomarker in melanoma.
We attempted to apply our IRGs score model to predict patient response to anti-PD-1 therapy, and it showed
differential response rates in low- and high-risk group patients, indicating that the high-risk group was more
sensitive to anti-PD-1 treatment, while the low-risk group was tend to be resistant. However, there were only
26 patients in this cohort, although the difference is statistically significant, larger scale validation is required to
make a convincing conclusion.
Admittedly, there are a few limitations in our analysis. Firstly, our analysis is based on expressions at messen-
ger RNA level, without regard to protein level expressions or posttranscriptional modifications, which also have
important biological effects. Further, we applied DEGs between melanomas and normal controls in predicting
patient survivals, however, we might have ignored some genes with critical prognostic value that do not neces-
sarily differ between melanomas and normal controls. Lastly, there is a lack of validation by more melanoma
cohorts, which is limited by the data availability.
Scientific Reports | (2020) 10:12462 | https://doi.org/10.1038/s41598-020-69330-2 10
Vol:.(1234567890)www.nature.com/scientificreports/
Conclusions
In conclusion, we have constructed a predictive model which combined immune-related genes with clinical
characteristics for the first time, to estimate melanoma patient survivals and therefore help with decision mak-
ing in the treatment.
Data availability
The GEO datasets analyzed during the current study are available in the Gene Expression Omnibus repository,
https: //www.ncbi.nlm.nih.gov/geo/query/acc.cgi?acc=GSE15605, https: //www.ncbi.nlm.nih.gov/geo/query/acc.
cgi?acc=GSE46517, https://www.ncbi.nlm.nih.gov/geo/query/acc.cgi?acc=GSE54467.
The TCGA datasets analyzed during the current study are available in The Cancer Genome Atlas repository,
https://xenabrowser.net/datapages.
Received: 30 April 2020; Accepted: 9 July 2020
References
1. Siegel, R. L., Miller, K. D. & Jemal, A. Cancer statistics, 2019. CA Cancer J. Clin. 69, 7–34 (2019).
2. Eggermont, A. M., Spatz, A. & Robert, C. Cutaneous melanoma. Lancet (London, England). 383, 816–827 (2014).
3. Lo, J. A. & Fisher, D. E. The melanoma revolution: from UV carcinogenesis to a new era in therapeutics. Science 346, 945–949
(2014).
4. Bray, F. et al. Global cancer statistics 2018: GLOBOCAN estimates of incidence and mortality worldwide for 36 cancers in 185
countries. CA Cancer J. Clin. 68, 394–424 (2018).
5. Hodi, F. S. et al. Nivolumab plus ipilimumab or nivolumab alone versus ipilimumab alone in advanced melanoma (CheckMate
067): 4-year outcomes of a multicentre, randomised, phase 3 trial. Lancet Oncol. 19, 1480–1492 (2018).
6. Robert, C. et al. Five-year outcomes with dabrafenib plus trametinib in metastatic melanoma. N. Engl. J. Med. 381, 626–636 (2019).
7. Axelrod, M. L., Johnson, D. B. & Balko, J. M. Emerging biomarkers for cancer immunotherapy in melanoma. Semin. Cancer Biol.
52, 207–215 (2018).
8. Guo, Y., Long, J. & Lei, S. Promoter methylation as biomarkers for diagnosis of melanoma: A systematic review and meta-analysis.
J. Cell Physiol. 234, 7356–7367 (2019).
9. Gershenwald, J. E. & Scolyer, R. A. Melanoma staging: American Joint Committee on Cancer (AJCC) 8th edition and beyond.
Ann. Surg. Oncol. 25, 2105–2110 (2018).
10. Balch, C. M. et al. Final version of 2009 AJCC melanoma staging and classification. J. Clin. Oncol. 27, 6199–6206 (2009).
11. Nagarajan, P. et al. Tumor thickness and mitotic rate robustly predict melanoma-specific survival in patients with primary vulvar
melanoma: a retrospective review of 100 cases. Clin. Cancer Res. 23, 2093–2104 (2017).
12. Fantin, V. R., St-Pierre, J. & Leder, P. Attenuation of LDH-A expression uncovers a link between glycolysis, mitochondrial physiol-
ogy, and tumor maintenance. Cancer Cell 9, 425–434 (2006).
13. Rotte, A., Jin, J. Y. & Lemaire, V. Mechanistic overview of immune checkpoints to support the rational design of their combinations
in cancer immunotherapy. Ann. Oncol. 29, 71–83 (2018).
14. Schachter, J. et al. Pembrolizumab versus ipilimumab for advanced melanoma: final overall survival results of a multicentre,
randomised, open-label phase 3 study (KEYNOTE-006). Lancet (London, England). 390, 1853–1862 (2017).
15. Tumeh, P. C. et al. PD-1 blockade induces responses by inhibiting adaptive immune resistance. Nature 515, 568–571 (2014).
16. Van Allen, E. M. et al. Genomic correlates of response to CTLA-4 blockade in metastatic melanoma. Science 350, 207–211 (2015).
17. Yang, W. et al. Smart nanovesicle-mediated immunogenic cell death through tumor microenvironment modulation for effective
photodynamic immunotherapy. ACS Nano 14, 620–631 (2020).
18. Gibney, G. T., Weiner, L. M. & Atkins, M. B. Predictive biomarkers for checkpoint inhibitor-based immunotherapy. Lancet Oncol.
17, e542–e551 (2016).
19. Topalian, S. L. et al. Safety, activity, and immune correlates of anti-PD-1 antibody in cancer. N. Engl. J. Med. 366, 2443–2454 (2012).
20. McGranahan, N. et al. Clonal neoantigens elicit T cell immunoreactivity and sensitivity to immune checkpoint blockade. Science
351, 1463–1469 (2016).
21. Li, H. et al. Dysfunctional CD8 T cells form a proliferative, dynamically regulated compartment within human melanoma. Cell
176(775–789), e718 (2019).
22. Larkin, J. et al. Combined nivolumab and ipilimumab or monotherapy in untreated melanoma. N. Engl. J. Med. 373, 23–34 (2015).
23. Snyder, A. et al. Genetic basis for clinical response to CTLA-4 blockade in melanoma. N. Engl. J. Med. 371, 2189–2199 (2014).
24. Gartrell, R. D. et al. Validation of melanoma immune profile (MIP), a prognostic immune gene prediction score for stage II–III
melanoma. Clin. Cancer Res. 25, 2494–2502 (2019).
25. Li, X. & Cai, Y. Better prognostic determination and feature characterization of cutaneous melanoma through integrative genomic
analysis. Aging (Albany NY). 11, 5081–5107 (2019).
26. Balachandran, V. P., Gonen, M., Smith, J. J. & DeMatteo, R. P. Nomograms in oncology: more than meets the eye. Lancet Oncol.
16, e173-180 (2015).
27. Verver, D. et al. Development and validation of a nomogram to predict recurrence and melanoma-specific mortality in patients
with negative sentinel lymph nodes. Br. J. Surg. 106, 217–225 (2019).
28. Maurichi, A. et al. Prediction of survival in patients with thin melanoma: results from a multi-institution study. J. Clin. Oncol. 32,
2479–2485 (2014).
29. Szklarczyk, D. et al. STRING v10: protein-protein interaction networks, integrated over the tree of life. Nucleic Acids Res. 43,
D447-452 (2015).
30. Skrzypski, M. et al. Three-gene expression signature predicts survival in early-stage squamous cell carcinoma of the lung. Clin.
Cancer Res. 14, 4794–4799 (2008).
31. He, A. et al. Prognostic value of long non-coding RNA signatures in bladder cancer. Aging (Albany NY). 11, 6237–6251 (2019).
32. Hedditch, E. L. et al. ABCA transporter gene expression and poor outcome in epithelial ovarian cancer. J. Natl. Cancer Inst. 106,
dju149 (2014).
33. Subramanian, A. et al. Gene set enrichment analysis: a knowledge-based approach for interpreting genome-wide expression
profiles. Proc. Natl. Acad. Sci. USA 102, 15545–15550 (2005).
34. Vickers, A. J. & Elkin, E. B. Decision curve analysis: a novel method for evaluating prediction models. Med. Decis. Mak. 26, 565–574
(2006).
35. Rousson, V. & Zumbrunn, T. Decision curve analysis revisited: overall net benefit, relationships to ROC curve analysis, and appli-
cation to case-control studies. BMC Med. Inf. Decis. Mak. 11, 45 (2011).
36. Liu, C. et al. Research Advances in the Treatment of Melanoma by Treat Melanoma. Curr. Top. Med. Chem. 16, 242–250 (2015).
Scientific Reports | (2020) 10:12462 | https://doi.org/10.1038/s41598-020-69330-2 11
Vol.:(0123456789)www.nature.com/scientificreports/
37. Guo, Y., Yang, L., Lei, S., Tan, W. & Long, J. NEDD4 Negatively Regulates GITR via Ubiquitination in Immune Microenvironment
of Melanoma. Onco Targets Ther. 12, 10629–10637 (2019).
38. Zou, P., Tang, R. & Luo, M. Oncolytic virotherapy, alone or in combination with immune checkpoint inhibitors, for advanced
melanoma: A systematic review and meta-analysis. Int. Immunopharmacol. 78, 106050 (2020).
39. Farmaki, E., Chatzistamou, I., Kaza, V. & Kiaris, H. A CCL8 gradient drives breast cancer cell dissemination. Oncogene 35,
6309–6318 (2016).
40. Halvorsen, E. C. et al. Maraviroc decreases CCL8-mediated migration of CCR5(+) regulatory T cells and reduces metastatic tumor
growth in the lungs. Oncoimmunology 5, e1150398 (2016).
41. Zhou, J. et al. MCP2 activates NF-kappaB signaling pathway promoting the migration and invasion of ESCC cells. Cell Biol. Int.
42, 365–372 (2018).
42. Barbai, T., Fejos, Z., Puskas, L. G., Timar, J. & Raso, E. The importance of microenvironment: the role of CCL8 in metastasis
formation of melanoma. Oncotarget 6, 29111–29128 (2015).
43. Hiwatashi, K. et al. Suppression of SOCS3 in macrophages prevents cancer metastasis by modifying macrophage phase and MCP2/
CCL8 induction. Cancer Lett. 308, 172–180 (2011).
44. Alvarez, A. H. & Martinez Velazquez, M. Prado Montes de Oca E. Human beta-defensin 1 update: potential clinical applications
of the restless warrior. Int. J. Biochem. Cell Biol. 104, 133–137 (2018).
45. Prado-Montes de Oca, E. Human beta-defensin 1: a restless warrior against allergies, infections and cancer. Int. J. Biochem. Cell
Biol. 42, 800–804 (2010).
46. Donald, C. D. et al. Cancer-specific loss of beta-defensin 1 in renal and prostatic carcinomas. Lab Investig. 83, 501–505 (2003).
47. Bonamy, C. et al. Expression of the human antimicrobial peptide beta-defensin-1 is repressed by the EGFR-ERK-MYC axis in
colonic epithelial cells. Sci. Rep. 8, 18043 (2018).
48. Fernandez, L. P. et al. Human beta-defensins (HBD1 and HBD3) and malignant melanoma susceptibility. Melanoma Res. 19,
340–341 (2009).
Acknowledgements
The authors would like to thank TCGA and GEO projects for data sharing. This study was funded by grants from
the National Natural Science Foundation of China (No. 81620108024. https://www.nsfc.gov.cn).
Author contributions
M.L., F.Z. and G.D. contributed to the data analysis, result interpretation and manuscript drafting. X.C. and G.D.
contributed to the study design and reviewing the manuscript. M.Y., Q.G. and Y.L. helped with reviewing the
manuscript. All authors read and approved the final manuscript.
Competing interests
The authors declare no competing interests.
Additional information
Supplementary information is available for this paper at https://doi.org/10.1038/s41598-020-69330-2.
Correspondence and requests for materials should be addressed to G.D. or X.C.
Reprints and permissions information is available at www.nature.com/reprints.
Publisher’s note Springer Nature remains neutral with regard to jurisdictional claims in published maps and
institutional affiliations.
Open Access This article is licensed under a Creative Commons Attribution 4.0 International
License, which permits use, sharing, adaptation, distribution and reproduction in any medium or
format, as long as you give appropriate credit to the original author(s) and the source, provide a link to the
Creative Commons license, and indicate if changes were made. The images or other third party material in this
article are included in the article’s Creative Commons license, unless indicated otherwise in a credit line to the
material. If material is not included in the article’s Creative Commons license and your intended use is not
permitted by statutory regulation or exceeds the permitted use, you will need to obtain permission directly from
the copyright holder. To view a copy of this license, visit http://creativecommons.org/licenses/by/4.0/.
© The Author(s) 2020
Scientific Reports | (2020) 10:12462 | https://doi.org/10.1038/s41598-020-69330-2 12
Vol:.(1234567890)You can also read