A flexible, laboratory scale and image analysis based equipment to assess rice quality classes - FOSAN
←
→
Page content transcription
If your browser does not render page correctly, please read the page content below
A flexible, laboratory scale and image
analysis based equipment to assess rice
quality classes
F. Antonucci1*, F. Pallottino1, C. Costa1, L. Gazza2,
S. Bellato2, P. Menesatti1
1
  Consiglio per la Ricerca e la sperimentazione in Agricoltura, Unità di ricerca per l’ingegneria
agraria – Via della Pascolare 16, 00015 Monterotondo Scalo (Roma), Italy
2
  Consiglio per la Ricerca e la sperimentazione in Agricoltura, Unità di ricerca per la valorizzazione
qualitativa dei cereali – Via Cassia 176, 00191 Roma, Italy

*
 Corresponding author: E-Mail: francescaantonucci@hotmail.it; Phone: +390690675213;
Fax: +390690625591

Riassunto
La valutazione della qualità del riso si basa su diverse caratteristiche tra cui il numero di grani spez-
zati, l’aspetto (bianco vitreo e gessato) e la forma, caratteri che dipendono soprattutto dalla varietà,
dalle condizioni climatiche, dalle tecniche di coltivazione e dai processi di lavorazione (es. pulizia,
essiccazione e molitura). La qualità del riso alla molitura è definita dalla resa potenziale alla lavo-
razione come riportato dall’International Organization for Standardization (ISO 7301: 2011). Anche se i
processi industriali includono già i sistemi di analisi di immagine durante le loro linee di selezione,
questi non sono facilmente configurabili dagli operatori che non riescono ad adattarli alla valutazio-
ne delle caratteristiche del riso come richiesto dalla legislazione vigente. Questo lavoro propone un
dispositivo flessibile basato sull’analisi di immagine configurabile dagli operatori per la selezione
dei grani basata su 3 attributi qualitativi quali la forma, la taglia (Analisi Ellittica di Fourier e mor-
fometria di base) e sull’aspetto (colore), utilizzando differenti modelli di classificazione multivaria-
ta (Partial Least Squares Discriminant Analysis). Il presente studio ha lo scopo di fornire un sistema
quantitativo, non distruttivo e rapido per classificare differenti classi qualitative industriali e difetti
(sani, semi sbramati, con il ventre bianco, gessati e rotti) appartenenti ad alcune importanti varietà
di riso commerciali non parboiled (Carnaroli, Demetra, Ducato, Onice, Opale e Salvo). I risultati dei
modelli per la classificazioni di ogni classe industriale/difetto delle varietà considerate tutte insieme
(all) e per delle varietà considerate singolarmente (Carnaroli, Demetra, Ducato, Onice, Opale e Salvo)
mostrano come la percentuale di corretta classificazione dei test siano molto alte per tutti i modelli
(dall’82,85 % per il modello “all” al 93,16 % per il modello “Onice”).

Parole chiave: Morfometria, qualità della molitura, analisi multivariata, difetti del riso.

                                                                                                        37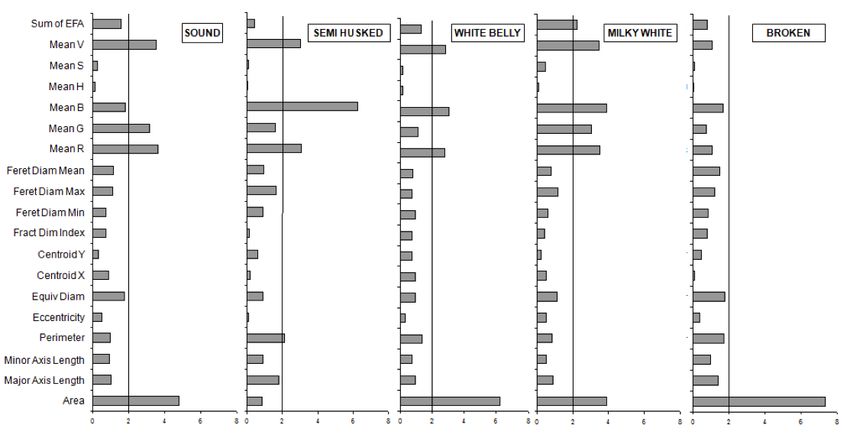
La Rivista di Scienza dell’Alimentazione, numero 1,   gennaio-aprile   2014, ANNO 43

Abstract
The milled rice quality evaluation is based on several traits among which number of broken grains,
appearance (translucency and chalkiness) and shape, depending mainly on the variety, weather con-
ditions, growing techniques and production processes (e.g., cleaning, drying and milling). Milling
quality of rice is defined as potential milling yield from paddy and from husked rice as reported by
the International Organization for Standardization (ISO 7301: 2011). Although industrial processes
already include imaging systems along their sorting lines, these are not easily configurable by the op-
erator adapting the assessment to the grain characteristics following a specific legislation. This work
proposes a flexible image analysis equipment configurable by operators to select grains on the base
of 3 quality attributes such as shape, size (i.e., Elliptic Fourier Analysis coefficients and basic mor-
phometry) and appearance (colour), using different multivariate classification models (i.e., Partial
Least Squares Discriminant Analysis). The presented study would provide a quantitative, non-de-
structive and rapid method to classify different qualitative industrial classes and defects (i.e., sound,
semi husked, white belly, milky white and broken) of some important commercial non parboiled rice
varieties (i.e., Carnaroli, Demetra, Ducato, Onice, Opale and Salvo). The results of the models for the
classification of each industrial/defects classes for both all varieties considered together (all) and
each variety separately considered (Carnaroli, Demetra, Ducato, Onice, Opale and Salvo) show as the
percentages of correct classification of the tests are very high for all the models (from 82.85% of “all”
model to 93.16% of “Onice” model). This could represent an opportunity for the industry which need
to annually adapt to the international and national legislations on the basis of the market requests.

Keywords: morphometry, milling quality, multivariate analysis, rice defects.

Introduction                                                   Organization for Standardization (ISO 7301:
Rice (Oryza sativa L.) constitutes the world’s                 2011). The ISO 7301 gives also the minimum
principal source of food, being the basic grain                specifications for rice suitable for international
for the planet’s largest population (Yadav and                 trade. For example, these specifications refer to
Jindal, 2001). The product quality is based on                 the definition of rough rice or paddy rice (i.e.,
several characteristics among which the num-                   rice grains still protected by the hull) and of
ber of broken grains, size (length, width and                  white rice or milled rice (i.e., rice without all or
their ratio), appearance (translucency and                     part of the bran and germ from the rough rice
chalkiness) and shape, depending mainly on                     containing whole grains or head rice, and bro-
the variety, weather conditions, growing tech-                 ken). Milling is a crucial step in post-produc-
niques and production processes (e.g., clean-                  tion of rice. The main objective of a rice mill-
ing, drying and milling). Milling rice quality                 ing system is to remove the husk and the bran
has become increasingly important represent-                   layers, and produce an edible, white rice kernel
ing the white rice final yield. Milling quality is             that is sufficiently milled and free of impuri-
defined as brown rice rate (i.e., the percentage               ties. Following the customer requirements, the
of grains from which the hulls have been re-                   rice should include a minimum part of broken
moved) and milled rice rate (i.e., the percentage              kernels (MacRobert et al., 2007). The shape of
of grains from which the bran layers and germs                 agricultural products such as fruit, vegetables
are removed) as reported by the International                  and grains is one of the most important factors

38
A flexible, laboratory scale and image......   F. Antonucci, F. Pallottino, C. Costa, L. Gazza, S. Bellato, P. Menesatti

for their classification and grading in relation         cy). Such attributes as stated by Ikehashi and
to commercial quality and organoleptic prop-             Khush (1979) represent conspicuous factors de-
erties. Morphological features are widely used           termining the commercial value of milled rice,
in automated grading, sorting and detection of           along with the proportion of broken grains, dis-
objects in the industry (Costa et al., 2011).            coloured grain, immature grain and damaged
  Although industrial processes already in-              grain. The study reported as in every standard
clude imaging systems along their sorting lines,         grade of rice there are specific percentages of
these are not easily configurable by the opera-          chalky grain permissible within each quality
tor in order to adapt the assessment to the grain        class. Chalkiness can be classified into several
characteristics following a specific legislation.        types: white center (chalky spots in the center
An example is represented by the system based            of grain), white belly (chalkiness on the dor-
on a visible light segregator proposed by Ka-            sal side of the grain), milky white (grain with
wamura et al. (2003) for the differentiation be-         a chalky texture except in the peripheral part
tween brown and milled rice. In addition, there          of the grain) and opaque (overall chalky tex-
are some approaches that can be used to deal             ture caused by the interruption of final filling
with shape outline data. These methods involve           of the grain) (Ikehashi and Khush, 1979). Ming
the fitting of some type of curve to the object          et al. (2002) to automatically select chalky and
outline and the use of the resulting coefficients        white rice grains presented a method based on
as variables for statistical analysis (Rohlf and         computer vision technology in place of human
Bookstein, 1990). The most common approach               visual assessment. Their approach meets the
is the fitting using polynomial functions or             needs of automation in the agricultural engi-
trigonometric series such as the Elliptic Fouri-         neering developing a new algorithm. Experi-
er Analysis (EFA) on the contour coordinates             ments are conducted on different rice images to
(Rohlf and Archie, 1984). About the broken rice          measure the chalkiness parameters (i.e., degree
grains, these are defined when they are small-           of chalkiness and rate of chalky grains).
er than three-fourths of whole grains (USDA,
1997). As reported by van Dalen (2004) the bro-
ken rice grains are separated during milling of          Aim
rice (removal of the hull and bran layers from           This work proposes a flexible image analysis
the rough rice) and re-added later depending             equipment configurable by operators to select
on the desired quality and price. The head rice          grains on the base of 3 quality attributes such
yield is another important physical characteris-         as shape, size (i.e., Elliptic Fourier Analysis
tics that determines rice quality. Generally, the        coefficients and basic morphometry) and ap-
amount of broken rice grains is mainly deter-            pearance (colour), using different multivariate
mined by visual selection from a large quanti-           classification models (i.e., Partial Least Squares
ty of rice. This technique is very slow, requires        Discriminant Analysis, PLSDA). The presented
trained personnel and results in a classification        study would provide a quantitative, non-de-
largely incorrect. Moreover, the length and              structive and rapid method to classify different
width of rice grains is generally measured using         qualitative industrial classes and defects (i.e.,
a sliding calliper. Van Dalen (2004) proposed a          sound, semi husked, white belly, milky white
more accurate method based on machine vision             and broken) of some important commercial non
systems.                                                 parboiled rice varieties (i.e., Carnaroli, Demet-
  Another parameter crucially contributing to            ra, Ducato, Onice, Opale and Salvo). This could
the rice milling quality is represented by the ap-       represent an opportunity for the industry which
pearance (defined as chalkiness and translucen-          need to annually adapt to the international and

                                                                                                                    39
La Rivista di Scienza dell’Alimentazione, numero 1, gennaio-aprile 2014, ANNO 43
national legislations on the basis of the market one qualitativa dei cereali (CRA-QCE, Rome).
requests. A total number of 3178 (about 500 per variety)
grains belonging to 6 important commercial rice
varieties (Carnaroli, Demetra, Ducato, Onice,
Materials and methods Opale and Salvo; Fig. 1) and to 5 industrial/de-
Data collection fected classes (sound, semi husked, white belly,
Milled rice samples, kindly provided by Con- milky white and broken; Fig. 2) were analysed
siglio per la Ricerca e la sperimentazione in Agri- by three expert people and classified according
coltura (CRA), Unità di ricerca per la risicoltura to their physical characteristics. Some of the
(CRA-RIS, Vercelli), were collected at the labora- sample classes were named after the terms re-
tory of CRA, Unità di ricerca per la valorizzazi- ported by Ikehashi and Khush (1979).
Figure 1: Digital high resolution images (600 d.p.i. 24 bit colour) of milled rice grain samples belonging to 6
important commercial rice varieties analysed in this study: A) Carnaroli, B) Demetra, C) Ducato, D) Onice, E)
Opale and F) Salvo.
Figure 2: Digital high resolution images (600 d.p.i. 24 bit colour) of rice grain (Carnaroli variety) samples
belonging to 5 industrial/defected classes analysed in this study: A) Sound, B) Semi husked, C) White belly, D)
Milky white and E) Broken. Some of the samples classes were named after the terms reported by Ikehashi
and Khush (1979).
40A flexible, laboratory scale and image...... F. Antonucci, F. Pallottino, C. Costa, L. Gazza, S. Bellato, P. Menesatti
Digital image analysis sion index (ratio providing a statistical index of
The grain samples of each varieties and industri- complexity comparing how detail in a pattern
al/defected classes were disposed on the plane changes with the scale at which it is measured),
of a professional scanner (Epson GT10000+) and minimum, maximum and mean Feret diame-
a high resolution image (600 d.p.i. 24 bit colour) ter. For the multivariate statistical classification
for each sample (about 100) were acquired for a techniques (i.e., PLSDA) were analysed also the
total of 30 images. ratios between these then considering other 7
Colour calibration was carried out with a col- variables. The colour (COL) data extracted refers
our checker (GretagMacbeth ColourChecker 24 to: mean RGB (red, green and blue) and mean
colour-patches) placed within each acquired im- HSV (hue, brightness and saturation). Also in
age. The measured coordinates within each im- this case for the PLSDA others 6 variables (ratios
age were warped into the reference coordinates between RGB and HSV) were considered.
of the same ColourChecker. This transformation
was performed through the Thin-Plate Spline Elliptic Fourier analysis
interpolation function (Bookstein, 1989) in the The overall shape of each rice grain was ana-
RGB space (for the procedure see Menesatti et lyzed by EFA on the outline coordinates (Rohlf
al., 2012; Pallottino et al., 2013). and Archie, 1984; Costa et al., 2013). The outline
For the outline extraction and then EFA a Sobel can be approximated by a polygon of x-y coordi-
edging algorithm was performed on each R, G nates. The EFA is based on the separate Fourier
and B channel to obtain three respective binary decompositions of the incremental changes of
images. Each single pixel at the same position in the x and y coordinates as functions of th e cu-
each image was then summed following these mulative chordal length of the outline polygon
criteria: if a pixel value was 0, then the null value (Antonucci et al., 2012). The Fourier series was
was preserved, and if a pixel value was great- truncated at the value of k at which the average
er than 0, then the value was changed to 1. The cumulative power is 99.99% of the average total
resulting images were again rescaled from 0 to power. For every outline, the total power was
255. White objects were then filled (Aguzzi et al., calculated as the sum, from 1 to k, of individual
2011). After segmentation, a total of 100 equally harmonic powers where k is equal to the Nyquist
spaced points (x, y) of the outline were digitized frequency (Crampton, 1995). The harmonic coef-
along the outline with a Matlab routine (rel. ficients describe the size, shape, and orientation
R2013b, Image Analysis Toolbox, PLSToolbox of each harmonic ellipse and form the input to
Eigenvector rel. 4.0) (Mathworks, Natick, MA, multivariate statistics. According to Rohlf and
USA). The starting point of the outline digitiza- Archie (1984), the elliptic Fourier coefficients
tion is the uppermost pixel of the grain outline were normalized to be invariant of size, location,
proceeding clockwise in both cases. rotation, and starting position. Cartesian coordi-
The basic morphometry (BM) data extract- nates were used. The EFA and all further analy-
ed refers to: area, major and minor axis length, ses were performed using the software Matlab.
perimeter (converted from pixel into cm or cm2
through the metric scale inside each image), ec- Multivariate statistical analysis
centricity (the measure of how much the conic In order to better visualize the dataset and to re-
section deviates from being circular), equiv- duce its dimensionality a Principal Component
alent diameter, centroids on X and Y axes (i.e., Analysis (PCA) on the means of EFA coefficients
the square root of the squared distance between (45 variables: see result section), BM (12 varia-
each point and the centroid of the points config- bles) and COL (6 variables) for a total of 63 varia-
urations summed over all points), fractal dimen- bles was performed consider all varieties (Carn-
41La Rivista di Scienza dell’Alimentazione, numero 1, gennaio-aprile 2014, ANNO 43
aroli, Demetra, Ducato, Onice, Opale and Salvo) In this study the loadings of the principal com-
together and the industrial/defected classes ponents were extracted and plotted.
(sound, semi husked, white belly, milky white In order to classify each industrial/defected
and broken) separately. The PCA is one of a fam- classes for both all varieties considered together
ily of techniques for taking high-dimensional (one model) and each varieties separately con-
data, and using the dependencies between the sidered (6 models), seven PLSDA models were
variables to represent it in a more tractable, low- developed. The datasets were constructed con-
er-dimensional form, without losing too much sidering: EFA coefficients (45 coefficients), BM
information. The PCA is one of the simplest and (19 variables) and COL (12 variables) for a total
most robust ways of doing such dimensionality of 76 variables.
reduction (Boas, 2006). The results of a PCA are The multivariate statistical PLSDA was consid-
discussed in terms of component scores, some- ered in order to find out the industrial/defected
times called factor scores (the transformed var- classes classification. The PLSDA consists of a
iable values corresponding to a particular data classical partial least squares (PLS) regression
point), and loadings (the weight by which each analysis where the response variable is categorical
standardized original variable should be multi- (Y-block; industrial/defected classes expressed as
plied to get the component score) (Shaw, 2003). dummy variables; Sabatier et al., 2003). The data-
Figure 3: Principal Component Analysis (PCA): plot of the components 1 and 6 (PC1 and PC6 respectively,
with the relative percentages of explained variances) performed on the means of Elliptic Fourier Analysis
coefficients (EFA), BM (basic morphometry) and COL (colour) variables, considering all varieties (Carnaroli,
Demetra, Ducato, Onice, Opale and Salvo) together and the industrial/defected classes (sound, semi husked,
white belly, milky white and broken) separately. On the bottom and on the right side of the graph, the relati-
ve configurations of the PC1 (mainly expressing the shape; see Figure 4) and of the PC6 (mainly expressing
the colour; see Figure 4).
42A flexible, laboratory scale and image...... F. Antonucci, F. Pallottino, C. Costa, L. Gazza, S. Bellato, P. Menesatti
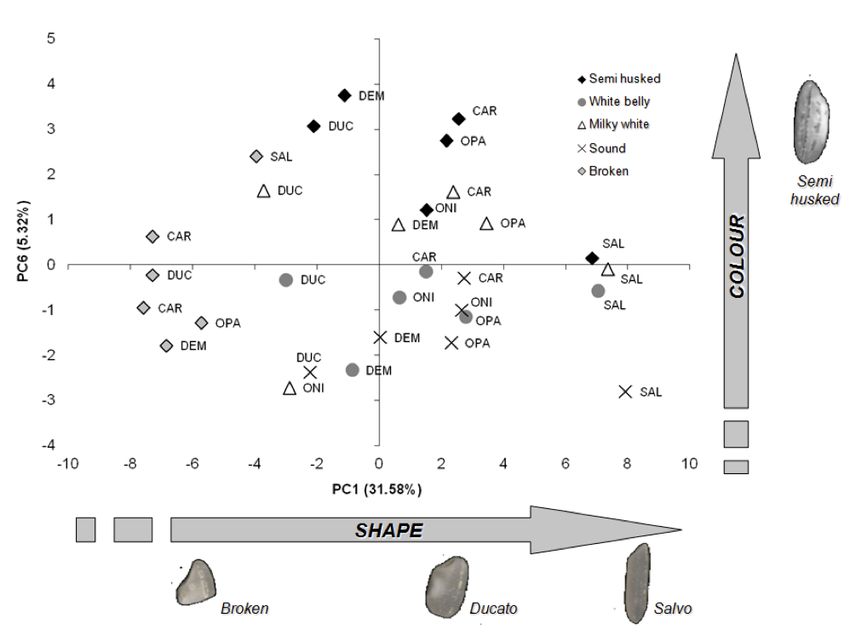
Figure 4: Loadings of the 63 variables (Elliptic Fourier Analysis coefficients – EFA; basic morphometry – BM
and colour – COL) analysed by the Principal Component Analysis (PCA) of the components 1 and 6 (PC1
and PC6 respectively). The gray rectangle highlights the loadings relative to the colour (COL) variables.
set (76 variables) of each of the 7 models has been was mainly based on the efficiencies and robust-
subdivided into two groups: (1) 75% of observa- ness parameters described above. A summary of
tions for the class modelling and validation set, the relative importance of the X-variables for both
and (2) 25% of observations for the independent Y and X model parts is given by Variable Impor-
test set, optimally chosen with the Euclidean dis- tance in the Projection (VIP) (Wold et al., 1984). It
tances based on the Kennard and Stone (1969) al- is a weighted sum of squares of the PLS weights,
gorithm (Papetti et al., 2012). The model includes taking into account the amount of explained
a calibration phase and a cross-validation phase Y-variance in each PLS component (Peolsson and
(Antonucci et al., 2012). All the statistical analy- Peolsson, 2008). A variable with a VIP score close
ses were performed using Matlab. The percent- to or greater than 1 can be considered important
ages of correct classification were calculated for in given model (Chong and Jun, 2005). In this
calibration and validation phases, and then used study, the VIP scores were extracted for all the BM
for model selection. The PLSDA model selection and COL variables (12 and 6 without their ratios
43La Rivista di Scienza dell’Alimentazione, numero 1, gennaio-aprile 2014, ANNO 43
Table 1: Results of Partial Least Squares Discriminant Analysis (PLSDA) for the classification of each indu-
strial/defected classes (sound, semi husked, white belly, milky white and broken) for both all varieties consi-
dered together (all) and each varieties separately considered (Carnaroli, Demetra, Ducato, Onice, Opale and
Salvo) performed on Elliptic Fourier Analysis (EFA) coefficients, BM (basic morphometry) and COL (colour)
variables. Table reports: pre-processing for X-blocks, number X variables, number of units in the Y-blocks,
number of Latent Vector (LV), percentage of cumulated variance of X- and Y-block, of mean specificity, sensi-
tivity, classification error, random probability and finally of the correct classification for model (75% of whole
dataset) and test (25% of whole dataset).
respectively) and for the EFA coefficients in con- Figure 3 shows the plot of the components
tracted form (i.e., sum of the 45 EFA coefficients). 1 and 6 (PC1 and PC6 respectively) relative to
the PCA. The explained variances are equal to
31.58% for the PC1 and to 5.32% for the PC6.
Results From the plot, it is possible to observe as a
The correct number of harmonics to be used trend is evident on PC1 for the variable shape
for the computation of the lateral profile of rice (BM and EFA) because from the negative to the
grains was calculated on the whole samplings positive side the broken rice grains are divided
(“Nyquist frequency”=90). The value selected from all the others industrial/defected class-
for the analysis (i.e., the first value exceeding es which become increasingly narrows (from
the 99.99%) was equal to 45 EFA coefficients of Ducato to Salvo varieties). In details the Sal-
the 12 harmonic equations. vo variety results to be more distant from all
44A flexible, laboratory scale and image...... F. Antonucci, F. Pallottino, C. Costa, L. Gazza, S. Bellato, P. Menesatti
the others. Moreover, a trend on PC6 based on Ducato, Onice, Opale and Salvo) performed on
the variable colour (RGB and HSV) is evident: EFA coefficients, BM and COL variables. The
the semi husked industrial/defected class is percentages of correct classification of the test
divided in the positive side from all the oth- (25% of whole dataset) are very high for all the
ers ones (sound, white belly and milky white models (from 82.85% of “all” model to 93.16%
grains). of “Onice” model). The means of classification
Figure 4 reports the loadings plot of the PC1 error (%) resulted to be very low. Generally,
and PC6 for the 63 variables (BM, EFA and the model “all” is that with lower performance
COL) analysed by the PCA. The variables which with respect the models performed on the vari-
mainly contributes to PC1 are shape based (BM eties separately considered.
and EFA), meanwhile the ones to PC6 are col- Figure 5 reports the VIP scores of the “all”
our based (COL). PLSDA model showing as on both shape (BM
Table 1 shows the results of the 7 PLSDA and EFA) and appearance variables [COL (RGB
models for the classification of each industri- and HSV)] for the classification of each indus-
al/defected classes (sound, semi husked, white trial/defected class considering all varieties to-
belly, milky white and broken) for both all va- gether. It is possible to observe as the scores of
rieties considered together (all) and each vari- colour variables are higher in the semi husked,
ety separately considered (Carnaroli, Demetra, white belly and milky white classes.
Figure 5: Variable Importance in the Projection (VIP) scores extracted from “all” Partial Least Squares Di-
scriminant Analysis (PLSDA) model performed on both shape (basic morphometry – BM and Elliptic Fourier
Analysis – EFA – coefficients in contracted form, i.e., sum of the 45 EFA coefficients) and colour variables
(red, green and blue – RGB and hue, brightness and saturation – HSV) for the classification of each industrial/
defected class (sound, semi husked, white belly, milky white and broken) considering all varieties (Carnaroli,
Demetra, Ducato, Onice, Opale and Salvo) together.
45La Rivista di Scienza dell’Alimentazione, numero 1, gennaio-aprile 2014, ANNO 43
Discussion ic milling loss. This study confirms, besides the
In this study, the accuracy of an integrated ad- control of broken grains, the importance of ap-
vanced image analysis method was tested to pearance (translucency) to monitor the finished
classify five industrial/defected classes (sound, product quality. For all these reasons, the present-
semi husked, white belly, milky white and bro- ed integrated approach could be of aid during
ken) of some different important commercial selection phase with possibility of application on
rice varieties (Carnaroli, Demetra, Ducato, On- grain coulter.
ice, Opale and Salvo) proposing a configurable
equipment adaptable to specific grain charac-
teristics using general classification models. The Acknowledgments
response variables were chosen by a trained spe- This work was funded by the Italian Ministry of
cialist which selected a complex sample in order Agriculture, Food and Forestry Policies (MiPA-
to create a broadened and versatile model able AF), as part of the projects “POLORISO” (D.M.
to classify a wide variety of grain conditions. 5337 of December 5th 2011).
Obviously, in order to obtain high performanc-
es from the model the parameters that you need
to select must be included in the database for a References
correct training phase. This method integrated AGUZZI J., COSTA C., ROBERT K., MATABOS
several set of classification variables (EFA coeffi- M., ANTONUCCI F., JUNIPER K., MENESAT-
cients extracted from outline profiles of each rice TI P., Automated image analysis for the detec-
grains, basic morphometry - BM - and colour - tion of benthic crustaceans and bacterial mat
COL - values) extracted analysing high resolu- coverage using the VENUS undersea cabled
tion images, very rapid to acquire and cost-ef- network, Sensors, 2011, 11: 10534-10556.
fective. Several machine vision systems methods ANTONUCCI F., COSTA C., PALLOTTINO F.,
present in literature have been developed for the PAGLIA G., RIMATORI V., DE GIORGIO D.,
determination of geometrical features of the rice MENESATTI P., Quantitative method for shape
grains (length, perimeter and projected area), description of almond cultivars (Prunus amyg-
the number of broken rice grains (Lloyd et al., dalus Batsch), Food and Bioprocess Technology,
2001; Yadav and Jindal, 2001) and the whiteness 2012, 5: 768-785.
of the rice grains (van Dalen, 2004) but not an BOAS M.L., Mathematical methods in the physi-
integrated system of all these features has been cal sciences, 2006, Wiley.com.
presented. Nowadays, the amount of broken rice BOOKSTEIN F.L., Principal warps: Thin-plate
grains is mainly determined by visual selection splines and the decomposition of deforma-
from a large quantity of rice but this method is tions, IEEE Trans. Pattern Anal. Mach. Intell.
very laborious and not objective. 1989, 11: 567-585.
The classification results for both models of CHONG I., JUN C., Performance of some varia-
all and single varieties, performed on EFA+B- ble selection methods when multicollinearity is
M+COL, show very high performances ranging present, Chemometrics Intell. Lab. Syst., 2005,
from 82.85% (all) to 93.16% (cv Onice). 78: 103-12.
COSTA C., ANTONUCCI F., PALLOTTINO F.,
AGUZZI J., SUN D.W., MENESATTI P., Shape
Conclusions analysis of agricultural products: a review of
Generally, the control of whiteness (degree of recent research advances and potential appli-
milling) and the percentage of broken grains in cation to computer vision, Food and Biopro-
milled rice is required to minimize the econom- cess Technology, 2011, 4: 673-692.
46A flexible, laboratory scale and image...... F. Antonucci, F. Pallottino, C. Costa, L. Gazza, S. Bellato, P. Menesatti
COSTA C., ANTONUCCI F., BOGLIONE C., ME- ation through colourimetric and morphometric
NESATTI P., VANDEPUTTE M., CHATAIN stem analysis: two refrigeration systems com-
B., Automated sorting for size, sex and skele- pared, Acta Alimentaria, 2013, 42(3): 428-436.
tal anomalies of cultured seabass using exter- PAPETTI P., COSTA C., ANTONUCCI F., FIGO-
nal shape analysis, Aquacultural Engineering, RILLI S., SOLAINI S., MENESATTI P., A RFID
2013, 52, 58-64. web-based infotracing system for the artisanal
CRAMPTON J.S., Elliptic Fourier shape analysis Italian cheese quality traceability, Food Con-
of fossil bivalves: some practical considera- trol, 2012, 27: 234-241.
tions, Lethaia, 1995, 28: 179-186. PEOLSSON A., PEOLSSON M., Predictive fac-
IKEHASHI H., KHUSH G.S., Methodology of as- tors for long-term outcome of anterior cervical
sessing appearance of the rice grain, including decompression and fusion: a multivariate data
chalkiness and whiteness, In Proc. of the work- analysis, Eur Spine J. Mar, 2008, 17(3):406-14.
shop on chemical aspects of rice grain quality, ROHLF F.J., ARCHIE, J.W., A comparison of Fou-
1979, pp. 223-229. rier methods for the description of wing shape
ISO 7301, 2011. ISO 7301-2011 Rice – Specification. in mosquitoes (Diptera: Culicidae). Systematic
KAWAMURA S., NATSUGA M., TAKEKURA Zoology, 1984, 3: 302-317.
K., ITOH K., Development of an automatic ROHLF F.J., BOOKSTEIN F.L., Proceedings of the
rice-quality inspection system, Computers and Michigan Morphometrics Workshop. Special
Electronics in Agriculture, 2003, 40(1): 115-126. Publication No. 2. Ann Arbor: The University
KENNARD R.W., STONE L.A., Computer aided of Michigan Museum of Zoology, 1990.
design of experiments. Technometrics, 1969, 11: SABATIER R., VIVEIN M., AMENTA P., Two ap-
137-148. proaches for discriminant partial least square,
LLOYD B.J., CNOSSEN A.G., SIEBENMORGEN In: Schader M., Gaul W., Vichi M. (Eds.) Be-
T.J., Evaluation of two methods for separating tween data science and applied data analysis,
head rice from brokens for head rice yield de- Berlin: Springer, 2003.
termination, Applied Engineering in Agricul- SHAW P.J.A., Multivariate statistics for the Envi-
ture, 2001, 17(5): 643-648. ronmental Sciences, 2003, Hodder-Arnold.
MACROBERT A.L., JONES J., KOSINA P., Weed UNITED STATES DEPARTMENT OF AGRI-
management in maize-based cropping systems CULTURE (USDA), United States Standards
in cereal knowledge bank, 2007. Retrieved from for Grades of Watermelons. Washington, D.C:
http://.knowledgebank.irri.org/ckb/agrono- USDA, 1997.
my-maize/weed-management-in-maize. VAN DALEN G., Determination of the size dis-
MENESATTI P., ANGELINI C., PALLOTTINO F., tribution and percentage of broken kernels of
ANTONUCCI F., AGUZZI J., COSTA C., RGB rice using flatbed scanning and image analysis,
color calibration for quantitative image anal- Food Research International, 2004, 37: 51-58.
ysis: the “3D Thin-Plate Spline” warping ap- WOLD S., RUHE A., WOLD H., DUNN W.J., The
proach, Sensors, 2012, 12: 7063-7079. collinearity problem in linear regression. The
MING S., YUN L., YIMING W., Computer Vision partial least squares approach to generalized in-
Based Rice Chalkiness Detection Using MAT- verses, Siam J Sci Stat Comput., 1984, 5: 735-43.
LAB [J]. Transactions of The Chinese Society of YADAV B.K., JINDAL V.K., Monitoring milling
Agricultural Engineering, 2002, 4: 037. quality of rice by image analysis, Computer
PALLOTTINO F., COSTA C., ANTONUCCI F., and Electronics in Agriculture, 2001, 33(1):
MENESATTI P., Sweet cherry freshness evalu- 19-33.
47You can also read