Diversity and Influence of Environmental Factors on the Spatio-Temporal Distribution of the Ichthyofauna of Malonda Lagoon (Congo Brazzaville) ...
←
→
Page content transcription
If your browser does not render page correctly, please read the page content below
Natural Resources, 2021, 12, 147-163
                                                                                                https://www.scirp.org/journal/nr
                                                                                                         ISSN Online: 2158-7086
                                                                                                           ISSN Print: 2158-706X

Diversity and Influence of Environmental
Factors on the Spatio-Temporal Distribution of
the Ichthyofauna of Malonda Lagoon (Congo
Brazzaville)

Tenda Hélène Dembe Louvinguila1,2, Armel Ibala Zamba1,2* , Victor Mamonekene1,2 ,
Lérège Batiabo Mikembi2, Freedom Honest Poaty Ngot2, Joseph Goma-Tchimbakala1,2
1
 Ecole Nationale Supérieure d’Agronomie et de Foresterie (ENSAF), Université Marien Ngouabi, Brazzaville,
République du Congo
2
 Institut national de Recherche en Sciences Exactes Naturelles, Laboratoire de l’Environnement et Océanographie, Brazzaville,
République du Congo

How to cite this paper: Dembe Louvin-          Abstract
guila, T.H., Zamba, A.I., Mamonekene, V.,
Mikiembi, L.B., Ngot, F.H.P. and Go-           This study was initiated with the aim of studying the diversity and spa-
ma-Tchimbakala, J. (2021) Diversity and        tio-temporal distribution of fish in the Malonda lagoon, one of the coastal
Influence of Environmental Factors on the
                                               ecosystems of the Base Guinea in the Republic of Congo. The fish were sam-
Spatio-Temporal Distribution of the Ichthyo-
fauna of Malonda Lagoon (Congo Brazza-         pled over a period of two years in three zones each including three stations
ville). Natural Resources, 12, 147-163.        known as: Mangrove, Grass and Full water. One station upstream towards the
https://doi.org/10.4236/nr.2021.125011         freshwater zone, one station downstream towards the mouth and one station
                                               in the containment zone. The catches were made using monofilament gillnets
Received: March 1, 2021
Accepted: May 28, 2021
                                               of 8, 10, 20 and 30 mm mesh size. During the rainy season, 1516 specimens
Published: May 31, 2021                        belonging to 29 species, 17 families and 12 orders were collected. In the dry
                                               season, 768 specimens belonging to 20 species, 11 families and 8 orders were
Copyright © 2021 by author(s) and
                                               collected. For both seasons, the family Cichlidae is the most diversified. The
Scientific Research Publishing Inc.
This work is licensed under the Creative
                                               marine forms are the most represented compared to the continental forms.
Commons Attribution International              Redundancy Analysis with forward selection coupled with Monte Carlo per-
License (CC BY 4.0).                           mutation tests showed that in the rainy season four variables influenced the
http://creativecommons.org/licenses/by/4.0/
                                               distribution of species (Depth: 48%, Vase: 16%, Nitrogen: 10% and Transpa-
                Open Access
                                               rency: 10%); in the dry season three variables influenced the distribution of
                                               species (Vase: 38%, Nitrogen: 14% and Oxygen: 11%). Ecological indices
                                               showed that the Malonda lagoon is already undergoing either anthropic or
                                               natural impacts, its state of ecological integrity is disturbed, the values of
                                               Shannon diversity and Equitability indices are not close to maximum values.
                                               The results of this study will serve as an ecological database for the proper

DOI: 10.4236/nr.2021.125011 May 31, 2021                         147                                           Natural Resources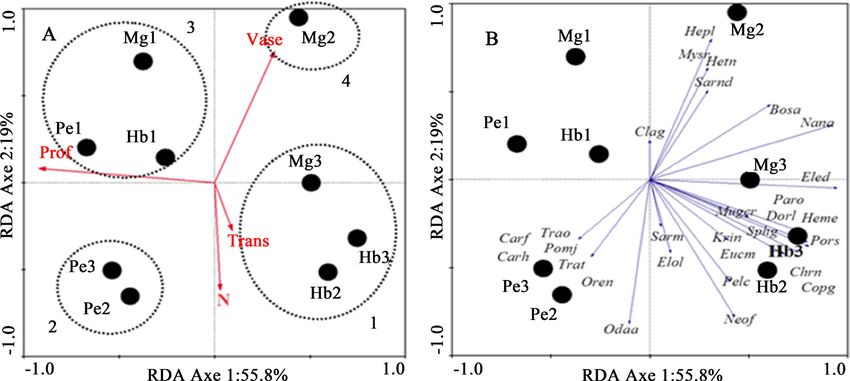
T. H. Dembe Louvinguila et al.

                                   management of these ecosystems.

                                   Keywords
                                   Fish, Ecology, Distribution, Season, Malonda Lagoon, Lower Guinea

                                 1. Introduction
                                 Aquatic ecosystems are highly diversified in terms of their origin, formation and
                                 functioning, as well as in terms of the rich fauna and flora they contain [1].
                                 African ichthyological provinces in general and that of Lower Guinea in partic-
                                 ular, which covers the coastal rivers of Cameroon and Gabon, right up to the
                                 mouth of the Congo, cover a rich and varied fauna [2] [3]. Lagoons which are
                                 part of coastal ecosystems are considered among the most productive aquatic
                                 environments thanks to their high rates primary production [4] [5] [6]. They of-
                                 fer very high biological diversity and constitute a real ecological niche [6]. The
                                 richness of African estuaries and lagoons is higher compared to others on a
                                 global scale. Just like the physical environment, the fauna and flora of these en-
                                 vironments are influenced by the adjacent systems in a balance depending on the
                                 situation [4]. The faunal assemblages that occupy these poorly defined spaces
                                 present more or less random aggregates of opportunistic fish originating either
                                 from the neighboring continental shelf or from continental tributaries [4]. The
                                 specific composition and structure of fish populations in a given place result
                                 from the action of a series of ecological filters [7], including the strength and
                                 duration of floods, the physico-chemical characteristics of the water and their
                                 spatio-temporal variations [8] [9], trophic richness, and the presence and condi-
                                 tion of mangroves [9]. Interactions between migrating species and resident ich-
                                 thyofauna contribute significantly to the structuring of fish populations [10].
                                 The composition of settlements is also modified, sometimes considerably, by
                                 human interventions, such as the construction of works (port facilities, dykes,
                                 dams), the development of communications with the ocean, fishing and aqua-
                                 culture activities, pollution linked to urbanization and industrialization and agricul-
                                 tural activities [11] [12]. These activities can have significant and uncontrolled
                                 consequences on the entire lagoon hydrosystem from the catchment area to the
                                 sea [13]. The hydrodynamics and hydrochemistry resulting from the confronta-
                                 tion of bodies of water of different origin and chemical composition constitute
                                 an essential element of the lagoon ecology, intervening directly on the specific
                                 composition, structure and spatio-temporal distribution of the communities but
                                 also on the dynamics of the various populations: migration, reproduction rate,
                                 growth [14] [15].
                                   In Congo, lagoons are even less studied and require in-depth environmental
                                 studies to better understand and manage them. The present study was con-
                                 ducted in the Malonda lagoon, to contribute to the basic enrichment of data on

DOI: 10.4236/nr.2021.125011                            148                                            Natural Resources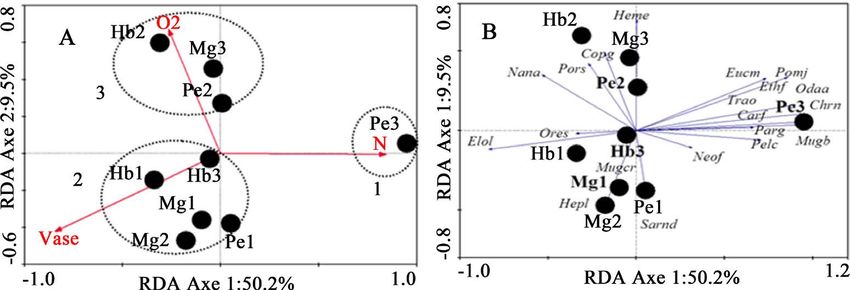
T. H. Dembe Louvinguila et al.

                                    the diversity and ecology of the fish in these waters. In particular, the study pro-
                                    vides data on the inventory of ichthyodiversity, the analysis of the spatio-temporal
                                    distribution and the distribution of fish species in relation to environmental va-
                                    riables.

                                    2. Material and Methods
                                    2.1. Study Area and Fish Sampling
                                    The fish used in this study were collected in the Malonda lagoon, located in the
                                    south of the Republic of Congo, in the Department of Pointe-Noire (Figure 1).
                                    Fed by the waters of the Loémé River, the Malonda lagoon covers about 95 ha. It
                                    communicates temporarily with the ocean. It thus opens up to the ocean natu-
                                    rally in the rainy season and remains closed in the dry season.
                                       A total of three areas were sampled, each including three stations: Mangrove
                                    (Mg), Grass (Hb) and Open Water (Pe) (Figure 1). Zone I (Mg1, Hb1 and Pe1)
                                    is located upstream near the Loémé, Zone II (Mg2, Hb2 and Pe2) is in the con-
                                    tainment zone and Zone III (Mg3, Hb3 and Pe3) towards the lagoon ambushes.
                                    The choice of stations was made as a function of 1) the distance from the mouth
                                    in order to assess the spatial variability of the physicochemical parameters sub-
                                    ject to the hydroclimatic variations of the Loémé River, 2) accessibility and 3)
                                    the presence of the three stations (Figures 2(A)-(C)). Eight data collection
                                    campaigns were carried out between January 2018 and August 2019, including

              Figure 1. Malonda Lagoon and sampled stations.

DOI: 10.4236/nr.2021.125011                              149                                           Natural Resources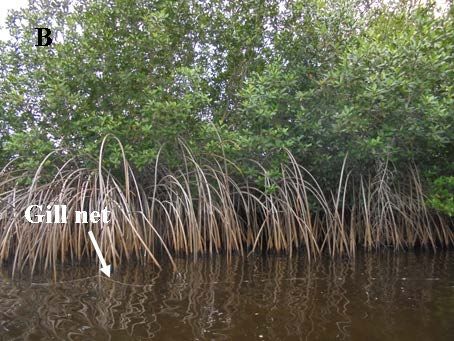
T. H. Dembe Louvinguila et al.

                                         four in the rainy season (January and April) and four in the dry season (July and
                                         August).
                                            At each of the stations, fishing was carried out between 5 pm and 7 am
                                         (Figure 3(A) & (Figure 3(B)), following a standardised catch method using 8,
                                         10, 20 and 30 mm mesh size gillnets see [16] [17]. Harvested fish were identified
                                         in the field. Those whose identifications were uncertain in the field were pre-
                                         served in 10% formalin for identification at the ichtyological laboratory of the
                                         National Institute for Research in Exact and Natural Sciences (IRSEN). Families

                     Figure 2. Sampling stations. (A): Grass station; (B): Mangrove station; (C): Full water station.

                     Figure 3. Removing the nets. (A): Net laying (Mangrove station); (B): Net removal (Grass station).

DOI: 10.4236/nr.2021.125011                                     150                                               Natural Resources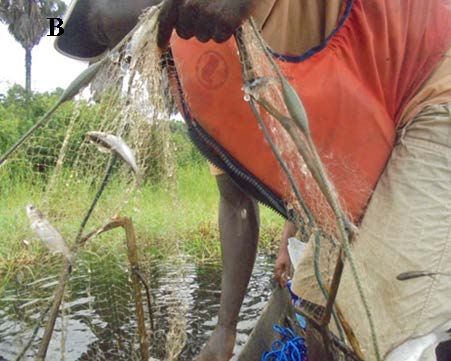
T. H. Dembe Louvinguila et al.

                              were classified according to [18], while genera and species were classified in al-
                              phabetical order.

                              2.2. Measurement of Environmental Variables
                              A total of thirteen environmental variables were measured at each station stu-
                              died for this study (Table 1). Physicochemical parameters (pH, temperature,
                              conductivity, salinity and total dissolved solids) were sampled in situ using a
                              multi-parameter probe (Oakton Pcstestr 35). Transparency was measured using
                              a Secchi disk. Nitrogen (by the Kjeldahl method converts to organic nitrogen),
                              phosphorus (by the Riley and Murphy reagent method) and dissolved oxygen
                              (by the cold potassium permanganate method) were measured at the chemistry
                              laboratory of “Institut national de Recherche en Sciences Exactes et Naturelles
                              (IRSEN)” in Pointe-Noire. The values represented for all the variables are the
                              averages obtained over eight campaigns. In each of the prospected stations, the
                              parameters were taken twice in the rainy season and twice in the dry season, for
                              two years (n = 2 days * 2 seasons * 2 years = 8).
                                The type of substrate was estimated as a percentage of the total substrate.
                              Three types of substrates were determined: sand (Sab), mud (Vase) and rock
                              (Aut).

                              2.3. Data Analysis
                              Based on the significant seasonal differences (P < 0.05) found in 60% of the en-
                              vironmental parameters measured (Table 1), the treatments were made consi-
                              dering the effects of the season. The length of the gradient (LG < 3), provided by

                              Table 1. Means and test of variances of physico-chemical parameters for two days, two
                              seasons and two years (n = 8), in bold are the variables with seasonal differences Signifi-
                              cant. Values SD: Standard deviation.

                                                                                                              T test
                                                                       Rainy season   Dry season
                                 Environmental variables       Codes
                                                                        Mean ± SD     Mean ± SD
                                                                                                      t-value           P

                                    Temperature (˚C)           Temp    30.58 ± 0.29   2 6.57 ± 0.13   37.48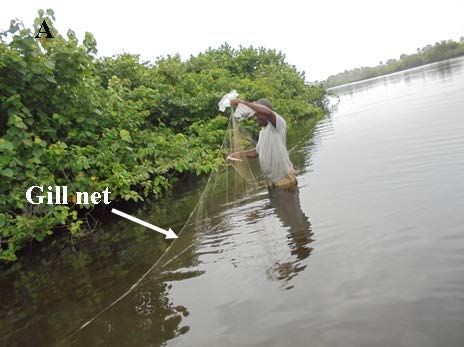
T. H. Dembe Louvinguila et al.

                                 the DCCA, made it possible to opt for the Redundancy Analysis (RDA), to un-
                                 derstand the correlations between species and environmental variables. Two
                                 matrices were simultaneously used, one of the numerical abundances of species
                                 and the other of environmental variables. Before any ordination, species abun-
                                 dances were transformed into log (x+1), while environmental variables were
                                 transformed into ln (x + 1), or arcsin x for percentage data [12] [17] [19] [20]
                                 [21]. The Monte Carlo test (999 permutations, p < 0.05) was carried out to select
                                 the variables that significantly explain the distribution of species. These analyses
                                 were performed using CANOCO 4.5 for Windows [22].
                                       In order to assess the state of ecological health of the lagoon, three diversity
                                 indices, commonly used in ecology [23] [24] were calculated using PRIMER ver-
                                 sion 5 software [25]: species richness (S), Shannon index (H') and Equitability
                                 (R). The species richness (S) corresponds to the number of species present in the
                                 sample. The Shannon diversity index H' [26] calculated according to the formu-
                                 la:
                                                                            S
                                                                    H ′ = −∑ Pi ln Pi                               (1)
                                                                           i =1

                                 with Pi = ni/N; N being the total number of individuals obtained for all species,
                                 ni is the number of individuals of species i and Pi the relative abundance of spe-
                                 cies i in the sample. Shannon index varies between 0 and H' maximum, calcu-
                                                                    ′ = ln S .
                                 lated according to the formula: H max
                                       The Equitability (R) [27] indicates whether individuals are equally distributed
                                 among the species of the target area, and varies between 0 and 1. It tends to-
                                 wards 0 when the totality of catches is almost entirely of one species, and to-
                                 wards 1 when all species have the same abundance within given sample. It is
                                 calculated using the formula:
                                                                       R = H ′ H max
                                                                                 ′ .                                (2)

                                 3. Results
                                 3.1. Species Composition
                                 The composition of the fish diversity of the Malonda Lagoon is recorded in Ta-
                                 ble 2. Overall, a total of 2284 specimens belonging to 33 species, 17 families and
                                 12 orders have been reported. Among the fish families sampled, Cichlidae (n = 7
                                 species), Mugilidae and Eleotridae (n = 4 each), Carangidae (n = 3) and Clupei-
                                 dae (n = 2) are the five most represented. The other twelve families are less
                                 represented with one species each.
                                       Depending on the season, 1516 specimens divided into 29 species, 17 families
                                 and 12 orders were caught during the rainy season. The family Cichlidae is the
                                 most diversified (n = 6 species) followed by Eleotridae (n = 4), Carangidae (n =
                                 3) and Mugilidae (n = 2). The other families are less diversified with one species
                                 each. During the dry season, 768 specimens belonging to 20 species, 11 families
                                 and 8 orders were reported. The family Cichlidae is the most diversified (n = 5

DOI: 10.4236/nr.2021.125011                              152                                          Natural Resources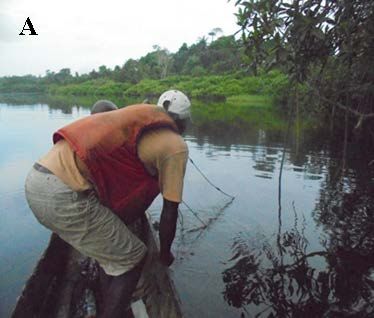
T. H. Dembe Louvinguila et al.

Table 2. List of species collected, their codes and relative abundance. *: species with marine affinity; RS: rainy season; DS: dry
season.

                                                                 Zone I                                   Zone II                                   Zone III

         Families and Species              Codes     Mg1             Hb1           Pe1         Mg2            Hb2            Pe2          Mg3            Hb3           Pe3

                                                   RS     DS     RS    DS      RS    DS      RS     DS   RS     DS      RS     DS       RS     DS   RS     DS      RS    DS

                Elopidae

    Elops lacerta Valanciennes. 1846*      Elol     0     2.56   0     3.23    0     20       0     13    0     3.77     0     1.37      0     3.92 0.32 0.85 2.94           0

             Ophichthidae

         Mystriophis rostellatus
                                           Mysr     0      0     0         0   0         0   0.17    0    0         0    0         0     0      0    0         0   0         0
          (Richardson. 1844)*

               Clupeidae

  Ethmalosa fimbriata (Bowdich. 1825)*     Ethf     0      0     0         0   0     10       0      0    0         0    0     1.37      0      0    0         0   0     17.1

 Odaxothrissa ansorgii Boulenger. 1910     Odaa     0      0     0         0   0         0    0      0   0.82       0   37.9 2.74        0      0   0.97 0.85 17.6 72.3

               Hepsetidae

    Hepsetus lineata (Pellegrin. 1926)     Hepsp 9.09      0     0         0   0     10      0.52 8.7     0         0    0         0    0.37    0    0         0   0         0

                Alestidae

   Nannopetersius ansorgii Poll. 1967      Nana 45.5 38.5 74.4 74.2            0         0   94.3    0   35.8 37.7       0     60.3 84.3 11.8 59.7 62.7 2.94                 0

                Clariidae

   Clarias gariepinus (Burchell. 1822)     Clag    18.2    0     0         0   0         0    0      0   0.41       0    0         0     0      0    0         0   0         0

              Claroteidae

      Chrysichthys nigrodigitatus
                                           Chrn     0      0     0         0   0         0    0      0   0.41       0    0         0     0      0   0.32       0   0     0.29
            (Lacepède. 1803)

              Arapaimidae

    Heterotis niloticus (Cuvier. 1829)     Hetn     0      0     0         0   0         0   0.17    0    0         0    0         0     0      0    0         0   0         0

             Sphyraenidae

  Sphyraena guachancho Cuvier. 1829*       Sphg     0      0     0         0   0         0    0      0    0         0    0         0     0      0   0.32       0   0         0

               Eleotridae

          Bostrychus africanus
                                           Bosa     0      0     0         0   0         0   0.52    0   0.41       0    0         0    0.37    0    0         0   0         0
         (Steindachner. 1880)*

         Dormitator lebretonis
                                           Derl     0      0     0         0   0         0    0      0   1.65       0    0         0    4.87    0   1.3        0   0         0
         (Steindachner. 1870)*

 Eleotris daganensis Steindachner. 1870*   Eled     0      0     0         0   0         0   1.55    0   4.12       0    0         0    2.25    0   17.5       0   0         0

     Kribia nana (Boulenger. 1901)*        Krisp    0      0     0         0   0         0    0      0    0         0    0         0     0      0   0.32       0   0         0

                Gobiidae

 Porogobius schlegelii (Günther. 1861)*    Pors     0      0     0         0   0         0    0      0   3.29 1.89       0         0    2.25    0   1.3 0.85       0         0

               Channidae

  Parachanna obscura (Günther. 1861)       Paro     0      0     0         0   0         0    0      0    0         0    0         0     0      0   0.32       0   0         0

               Cichlidae

  Coptodon guineensis (Günther. 1862)      Copg     0      0     0         0   0         0    0     4.35 0.41 1.89       0         0    0.37 25.5 0.97 0.85        0         0

  Hemichromis elongatus (Guichenot.
                                           Heme 9.09 46.2 2.56 17.7            25    20      2.07    0   24.3 37.7 34.5 28.8 1.5 47.1 9.09 16.1 8.82 2.95
                  1861)

 Oreochromis niloticus (Linnaeus. 1758)    Ores     0      0     0         0   0         0    0      0    0         0   6.9        0     0      0    0         0   0         0

DOI: 10.4236/nr.2021.125011                                                    153                                                                  Natural Resources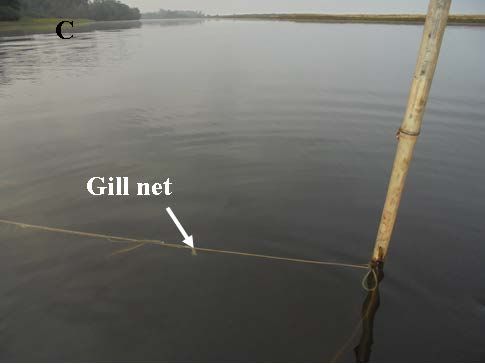
T. H. Dembe Louvinguila et al.
Continued
Oreochromis schwebischi (Sauvage. 1884) Oren 0 0 0 0 0 0 0 65.2 0 13.2 0 0 0 0 0 0 0 0
Pelmatolapia cabrae (Boulenger. 1899) Pelc 0 0 0 0 0 0 0 4.35 0.82 0 0 1.37 0 0 0.97 0 5.88 0.59
Sarotherodon melanotheron Rüppell.
Sarm 9.09 0 2.56 0 50 0 0.52 0 4.12 0 10.3 0 0 0 0.32 0 5.88 0
1852
Sarotherodon nigripinnis dolloi Riippell.
Sarsp 9.09 0 0 0 0 10 0.17 0 0.41 0 0 0 0 0 0 0 0 0
1852
Mugilidae
Mugil bananensis (Pellegrin. 1928)* Mugb 0 0 0 0 0 0 0 0 0 0 0 0 0 0 0 0 0 1.18
Mugil curema Valenciennes. 1836* Mugcr 0 0 0 0 0 0 0 0 0 0 0 0 0 0 0.32 0.85 0 0
Neochelon falcipinnis (Valenciennes.
Neof 0 12.8 20.5 4.84 25 30 0 4.35 16 1.89 10.3 1.37 3.75 9.8 5.84 15.3 38.2 1.77
1836)*
Parachelon grandisquamis (Valenciennes.
Parg 0 0 0 0 0 0 0 0 0 0 0 0 0 0 0 0.85 0 0.29
1836)*
Carangidae
Caranx fischeri Smith-Vaniz & Carpenter.
Carf 0 0 0 0 0 0 0 0 0 0 0 0 0 0 0 0 2.94 0.29
2007*
Caranx hippos (Linnaeus. 1766)* Carh 0 0 0 0 0 0 0 0 0 0 0 0 0 0 0 0 2.94 0
Trachinotus ovatus (Linné. 1758)* Trao 0 0 0 0 0 0 0 0 0 0 0 1.37 0 0 0 0 2.94 1.18
Trachinotus teraia Cuvier. 1832* Trat 0 0 0 0 0 0 0 0 0 0 0 0 0 0 0 0 2.94 0
Gerreidae
Eucinostomus melanopterus (Bleeker.
Eucm 0 0 0 0 0 0 0 0 7 1.89 0 0 0 0 0 0 0 0.88
1863)*
Haemulidae
Pomadasys jubelini (Cuvier. 1830)* Pomj 0 0 0 0 0 0 0 0 0 0 0 1.37 0 1.96 0 0.85 5.88 1.18
species) followed by Mugilidae (n = 4), Carangidae and Clupeidae (n = 2 each).
The other nine families each have one species.
3.2. Fish Community Assemblages in Relationship
to Environmental Variables
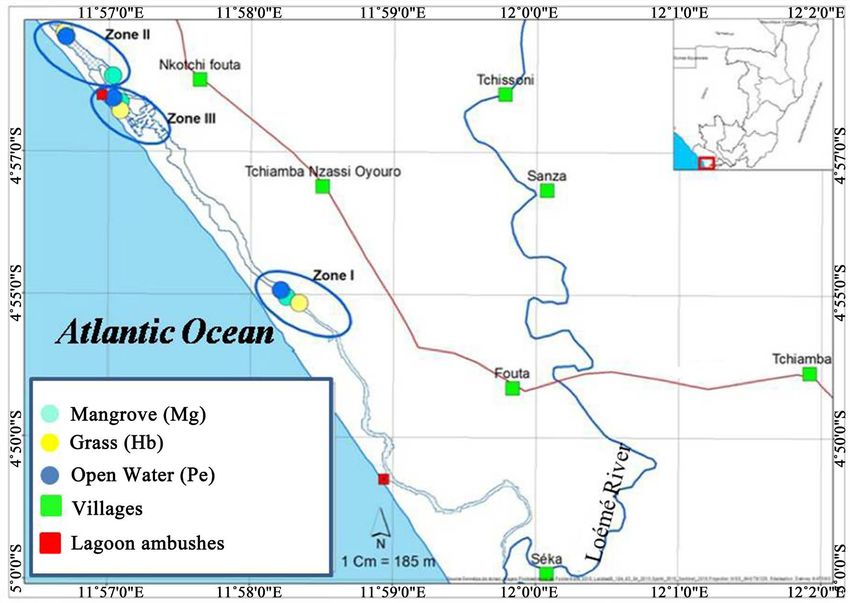
Results of the Redundancy Analysis (RDA) show the different correlations be-
tween species, between environmental variables and stations, between species
and different stations (Figure 4 and Figure 5). In the rainy season, the first two
axes (respectively 55.8 and 19%) express 74% cumulative variance of the species
data (Figure 4), with a very high correlation between species and environmental
variables for both axes (respectively 0.92 and 0.81). The Monte Carlo test (999
permutations) shows that both axes are significant (F = 1.89; P = 0.004). Redun-
dancy Analysis with forward selection identified four variables (P < 0.05), which
together express 84% of the total variance: Depth (Prof: 48%), Vase (Vase: 16%),
Nitrogen (N: 10%) and Transparency (Trans: 10%).
In the dry season, the first two axes (respectively 50.2% and 9.5%) express
59.7% cumulative variance of species data (Figure 5). The correlation between
species and environmental variables is very high for the first axes (respectively
DOI: 10.4236/nr.2021.125011 154 Natural ResourcesT. H. Dembe Louvinguila et al.
0.96 and 0.78.) The Monte Carlo test (999 permutations) shows that both axes
are significant (F = 3.03; P = 0.01). Three significant environmental variables (P
< 0.05) were selected, expressing alone 63% of the total variance in community
structure: Vase (Vase: 38%), Nitrogen (N: 14%) and Oxygen (O2: 11%).
The variables selected for both seasons influence the distribution of fish
communities. The analysis of Figure 4 shows that in the rainy season the sta-
tions are classified into four habitat types in relation to the two axes. Habitat 1
includes three stations (Hb2, Hb3 and Mg3), is positively correlated with Axis 1
but negatively correlated with depth, the characteristic species are: Bostrychus
africanus, Chrysichthys nigrodigitatus, Coptodon guineensis, Dormitator lebre-
tonis, Eleotris daganensis, Elops lacerta, Eucinostomus melanopterus, Hemich-
romis elongatus, Kribia nana, Mugil curema, Nannopetersius ansorgii, Neoche-
lon falcipinnis, Parachanna obscura, Pelmatolapia cabrae, Porogobius schlegelii,
Sarotherodon melanotheron and Sphyraena guachancho. Habitat 2 with two sta-
tions (Pe3 and Pe2) is negatively correlated with axis 1 and with mud there are
species such as Caranx fischeri, C. hippos, Odaxothrissa ansorgii, Oreochromis
schwebischi, Pomadasys jubelini, Trachinotus teraia, and T. ovatus. Habitat 3
Figure 4. RDA Rainy season. Ordering of species, stations and selected environmental variables (A): Biplot of
environmental variables and stations; (B): Biplot of species and stations.
Figure 5. RDA of the dry season. Ordering of species, stations and selected environmental variables
(A): Biplot of environmental variables and stations; (B): Biplot of species and stations.
DOI: 10.4236/nr.2021.125011 155 Natural ResourcesT. H. Dembe Louvinguila et al.
with three stations (Mg1, Hb1 and Pe1,) influenced by depth is negatively corre-
lated with axis 1 and positively correlated with axis 2, a single species Clarias ga-
riepinus. Habitat 4 with only one station (Mg2), influenced by mud is positively
correlated with axis 2, the main species are Hepsetus lineata, Heterotis niloticus,
Mystriophis rostellatus and Sarotherodon nigripinnis.
In the dry season, three types of habitat can be distinguished (Figure 5): Ha-
bitat 1, a single station (Pe3), positively correlated with axis 1 and nitrogen, cha-
racterized by the species Caranx fischeri, Chrysichthys nigrodigitatus, Ethmalosa
fimbriata, Eucinostomus melanopterus, Mugil bananensis, Neochelon falcipin-
nis, Odaxothrissa ansorgii, Parachelon grandisquamis, Pelmatolapia cabrae,
Pomadasys jubelini and Trachinotus ovatus. Habitat 2 (Hb1, Mg1 Pe1, Mg2 and
Hb3) is positively correlated with mud, but negatively correlated with both axes,
we find Elops lacerta, Hepsetus lineata, Mugil curema, Oreochromis schwebischi
and Sarotherodon nigripinnis. Habitat 3 (Hb2, Pe2 and Mg3), is negatively cor-
related with axis 1, but positively correlated with axis 2 and oxygen, as characte-
ristic species Coptodon guineensis, Hemichromis elongatus, Nannopetersius
ansorgii and Porogobius schlegelii.
3.3. Spatial and Temporal Variation of Ecological Diversity Indices
For each of the nine sampled stations, diversity indices including species richness
(S), Shannon index (H'), maximum Shannon index ( H max ′ ) and equitability (R)
were calculated (Table 3). The high values of the S, R and H' indices during the
rainy season, were observed in the stations Hb3 (S = 16 species), Pe1 (R = 0.95)
and Pe3 (H' = 2.01). Low values were observed in the stations Pe1 (S = 3), Mg3 (R
= 0.32) and Mg2 (H' = 0.31). During the dry season, high values were observed in
stations Pe3 (S = 12), Pe1 (R = 0.95) and Pe1 (H' = 1.70). Low values were reported
in the stations Mg1 and Hb1 (S = 4), Pe3 (R = 0.40) and Hb1 (H' = 0.79).
Table 3. Ecological diversity indices. N: number of specimens; S: Species richness; H':
′ : Shannon maximum index; R: Equitability; RS: rainy season; DS:
Shannon index; H max
dry season.
S N H' ′
H max R
Stations Code
RS DS RS DS RS DS RS DS RS DS
Mg1 6 4 11 39 1.54 1.08 1.79 1.39 0.86 0.78
Zone I Hb1 4 4 39 62 0.73 0.79 1.39 1.39 0.53 0.57
Pe1 3 6 4 10 1.04 1.69 1.1 1.79 0.95 0.95
Mg2 9 6 581 17 0.31 1.39 2.19 1.79 0.14 0.78
Zone II Hb2 15 8 243 48 1.83 1.32 2.71 2.08 0.67 0.63
Pe2 5 9 29 73 1.39 1.11 1.61 2.20 0.86 0.51
Mg3 9 6 267 51 0.71 1.39 2.20 1.80 0.32 0.77
Zone III Hb3 16 9 308 117 1.38 1.12 2.77 2.20 0.50 0.51
Pe3 11 11 34 338 1.97 0.98 2.40 2.40 0.82 0.41
DOI: 10.4236/nr.2021.125011 156 Natural ResourcesT. H. Dembe Louvinguila et al.
4. Discussion
4.1. Fish Diversity
The fish species reported in this study are characteristic of the ichthyogeograph-
ic province of Lower Guinea [28] [29], with the exception of Oreochromis nilo-
ticus and Heterotis niloticus, which were introduced into this part through fish
farming [30] [31] [32] [33]. Overall, over 60% of species reported have marine
affinity (Bostrychus africanus, Caranx fischeri, C. hippos, Dormitator lebretonis,
Eleotris daganensis, Elops lacerta, Ethmalosa fimbriata, Eucinostomus melanop-
terus, Kribia nana, Mugil bananensis, Mugil curema, Mystriophis rostellatus,
Neochelon falcipinnis, Parachelon grandisquamis, Pomadasys jubelini, Porogo-
bius schlegelii, Sphyraena guachancho, Trachinotus teraia and T. ovatus). It is
known that lagoons, with their ecotonal roles, host several marine species [4] [9].
According to [10], a significant proportion of the fish species composing neritic
populations of African coasts is likely to enter estuaries and neighboring lagoons
for various durations and at various stages. African continental waters are home
to species of marine origin that have adapted to fresh waters or that migrate
seasonally or sporadically between the sea and inland waters [34].
The species listed in this lagoon (72.41% in the rainy season and 90% in the
dry season) are species which constitute the fundamental lagoon population and
the very base of lagoon populations by their permanence, their abundance and
their essential role that they hold in the ecology and the halieutic economy of
these ecosystems [4]. They are euryhaline species that adapt to any range of sa-
linity.
4.2. Season Effects on Fish Diversity and Distribution
The seasonal variations show that in the rainy season the Malonda lagoon was
more diversified (29 species against 20 in the dry season) and more abundant
(1516 against 768 specimens). This difference in both abundance and specific
richness could be explained by the fact that during the rainy season the Malonda
lagoon opens (artificially by fishermen for 3 years) to the ocean several times.
The opening of the lagoon on the one hand and the desalination of the water by
continental inflows on the other hand allow both marine and continental species
to enter it. This could also be due to the fact that during the rainy season there is
an abundance of food and it is a favorable breeding season for many species. In
this regard, [35] have argued that the period and duration of the ocean opening
phase play an essential role in the diversity and abundance of fish in a lagoon
system. Seasonal variations are very marked both in terms of stand composition
and structure [36]. The hydrological variability resulting from the seasonal dis-
tribution of rainfall or the interannual variability of rainfall has important con-
sequences on the biology and dynamics of fish populations [37].
Continental forms dominate in the rainy season while marine forms dominate
in the dry season. In fact, in the dry season, the lagoon is completely closed and
the exchanges at the mouth are made by infiltration. With the low inflows of
DOI: 10.4236/nr.2021.125011 157 Natural ResourcesT. H. Dembe Louvinguila et al.
continental water and also evaporation during this period, the water remains
saltier, especially towards the mouth (0.67 ± 0.25 ppt in the rainy season against
3.39 ± 0.23 ppt in the dry season). This explains the presence of marine species
in the Pe3 station. According to [10], salinity and temperature are selective va-
riables of the lagoon environment.
The study of the physical parameters of a station and of the species that co-
lonize it makes it possible to determine the relationships between the environ-
ment and the species, and to identify the preferences of a species in terms of
ecological factors [34]. According to the RDA (Figure 4 and Figure 5), four va-
riables in the rainy season in particular, depth, mud, transparency and nitrogen
and three variables in the dry season, namely mud, nitrogen and oxygen influ-
ence the distribution of species. [10] reported that the composition, distribution
and abundance of communities in estuarine and lagoon waters are strongly in-
fluenced by salinity, temperature, turbidity, dissolved oxygen concentration.
Seasonal variations are very marked, both in terms of stand composition and
structure [34]. In the rainy season, the species are concentrated in the shallow
stations, in particular the stations Hb2, Hb3, Mg3 and Mg2. These stations con-
stitute rich habitats favorable to the development of planktonic species adapted
to the nutritional needs of juveniles.
The grasses and stilt roots of Rhizophora sp. provide fish with shelter to es-
cape predators, refuge, nursery and breeding grounds. Mangroves are irreplace-
able habitats for many fish species [15]. Also, these stations have a high silt rate.
The muddy substrate increases the fertility of the water, the abundance of food
[33]. According to [34], an essential reason for a fish to frequent certain types of
environment is the opportunity to find food suitable for its size and physiologi-
cal requirements. The Pe2 and Pe3 stations are negatively correlated with the silt;
they have a sandy-rocky substrate and are colonized by the typically marine spe-
cies (Caranx fischeri, C. hippos, Pomadasys jubelini and Trachinotus ovatus) for
the Pe3 station and the continental species (Oreochromis niloticus and Odax-
othrissa ansorgii) for the Pe2 station.
In the dry season, marine species are concentrated in the Pe3 station, which is
positively correlated with nitrogen. The Elops lacerta, Hepsetus lineata, Mugil
curema, Oreochromis schwebischi, and Sarotherodon nigripinnis dolloi species
more often frequent the muddy sites (Mg1, Hb1, Pe1 and Mg2). The Pe2, Hb2
and Mg3 stations, positively correlated with oxygen, harbor the species Copto-
don guineensis, Hemichromis elongatus, Nannopetersius ansorgii et Porogobius
schlegelii.
A species of fish maintains itself in a hydrosystem in the long term to the ex-
tent that it finds there a set of conditions that allow it, among other things, to
grow and reproduce [38]. These very marked seasonal variations in the popula-
tion are induced by changes in the environment, the abundance and distribution
of freshwater inputs. Lagoons perform an extremely important and sometimes
essential function for the completion of the biological cycle of certain fish [7]
[10]. For both seasons, we observe an increasing gradient of the specific richness
DOI: 10.4236/nr.2021.125011 158 Natural ResourcesT. H. Dembe Louvinguila et al.
from upstream (the freshwater zone) to downstream (towards the mouth). In
this regard, [39] specified that the physical conditions present in a watercourse,
from upstream to downstream, induce a response from biological communities,
with a gradual change depending on the capacities of the species. to adapt to en-
vironmental conditions and available food resources. This longitudinal zoning is
accompanied by an increase in species richness by increasing the heterogeneity
and volume of the habitat [20] [40]. The low diversity of stations in zone I (Pe1
and Mg1 stations) upstream may be due to the action of human activities carried
out in the zone, in particular the sand quarry, fish ponds, excessive fishing by
riparian fishermen. This area is near the village of Fouta and is subject to strong
human pressure.
4.3. Ecological Health of Malonda Lagoon
The diversity indices provide information on the state of health of the lagoon in
space and time. Three indices (S, H ′ and R) were calculated based on the ab-
undances. These indices are of great importance in diagnosing the ecological
health of an aquatic ecosystem [24]. The results show that most stations show
′
indices that do not come close to their maximum values ( H max for H ′ and 1
for R) for both seasons. In the rainy season, four out of nine stations (Mg1, Pe1
and Pe2 and Pe3) have indices which approach the maximum values. These val-
ues show that these stations are not yet disturbed. The cash is distributed in an
equitable manner within these stations. According to [41], H ′ is high when
there is no imbalance in the number of individuals within each species. Accord-
ing to [42], the value of R varies between zero (0) when a single species domi-
nates or one (1) when all species have the same abundance. The values which are
close to 0 in particular for the Mg2 and Mg3 stations could be explained by the
presence of a very abundant species Nannopetersius ansorgii which alone
represents 94% for the Mg2 station and 84% for the Mg3 station of the total ab-
undance. The dominance of a species at a site could mean an increase in the in-
fluence of human activities [43].
In the dry season, only one Pe1 station presented the values of H' and R close
to the maximum values. The other stations have values of R far from 1, especially
the station Pe3. This could be the result of the presence of the species Odaxoth-
rissa ansorgii which alone accounts for 72% of the total abundance. These results
show that this lagoon is already suffering from human imprints. [44] pointed out
that the equatorial ecoregion of the southwest coast in which Malonda is located
has been identified as being highly vulnerable to human impacts. In addition, it
is subject to increased overexploitation of fish stocks. Although far from the city,
it is much frequented by fishermen who engage in artisanal fishing with
non-selective gear. Malonda lagoon is located in an oil zone. Oil exploitation is
one of the main activities identified as polluting the aquatic systems of the
southwest coast of the equatorial ecoregion [12].
The high values of the indices (H' and R) would show an even distribution
DOI: 10.4236/nr.2021.125011 159 Natural ResourcesT. H. Dembe Louvinguila et al.
and a good diversification of species within a station [17]. When the calculated
H’ and R indices approach their maximum values, this proves that all species in
the community constitute an excellent distribution of abundance and that the
environment is in good ecological health [12] [24]. In our case for most stations,
the values show a poor distribution of fish abundance, consequently a poor eco-
logical state of the lagoon.
5. Conclusion
The present study focused on the analysis of the diversity and spatio-temporal
distribution of the ichthyofauna of the Malonda lagoon. The analysis provided a
good knowledge of the diversity of fish in these still poorly known environ-
ments, and an understanding of the relationship that exists between the species
and the environment in which they live. The results showed that the distribution
of fish is a function of environmental parameters. In the rainy season, four en-
vironmental variables influence the distribution in four habitats and in the dry
season, a single variable influences the distribution in four habitats. Analysis of
the diversity indices showed that the Malonda Lagoon is not in good ecological
condition. Monitoring of environmental parameters and the establishment of
biological indicators could make it possible to better monitor the lagoon and
ensure its balance. Other analyzes, in particular on the biology of the harvested
species (food habit, reproduction) should be considered to understand the pre-
ference of certain habitats by the species.
Acknowledgements
We would like to thank Martin Bassafoula and Daniel Bavedila, the technician of
the environment and oceanography laboratory, for help in the field. The field-
work of THDL was provided by IRSEN institution (Republic of the Congo).
Conflicts of Interest
The authors declare no conflicts of interest regarding the publication of this pa-
per.
References
[1] Chabanne, D. (2007) Les Catégories bioécologiques des espèces de poissons des es-
tuaires et lagunes de l’Afrique de l’Ouest. Université des sciences et techniques du
Languedoc Centre International d’Études Supérieures en Sciences Agronomiques,
33 p.
[2] Teugels, G.G., Ozouf-Costaz, C., Legendre, M. and Parrent, M. (1992) A Karyologi-
cal Analysis of the Artificial Hybridization between Clarias gariepinus Burchell,
1822 and Heterobranchus longi Filis Valenciennes, 1840 Pisces, Clariidae. Journal
of Fish Biology, 40, 81-86. https://doi.org/10.1111/j.1095-8649.1992.tb02555.x
[3] Mamoneke, V. and Teugels, G.G. (1993) Faune des poissons d’eaux douces de la
réserve de la Biosphère de Dimonika (Mayombe, Congo). Annale Musée Royal
Afrique Centrale, MRAC (Tervuren) and U.N.E.S.C.O, Vol. 272, 126 p.
[4] Albaret, J.-J. (1994) Les poissons: Biologie et peuplements. In:Durand, J.-R., Dufour,
DOI: 10.4236/nr.2021.125011 160 Natural ResourcesT. H. Dembe Louvinguila et al.
P., Guiral, D. and Zabi, S.G., Eds., Environnement et ressources aquatiques de
Côte-d’Ivoire, Tome 2: Les milieux saumâtres, L’exemple de la lagune Ébrié, Office
de la Recherche Scientifique et Technique Outre-Mer (ORSTOM), Paris, 239-279.
[5] Villanueva, M.C.S. (2004) Biodiversité et relations trophiques dans quelques milieux
estuariens et lagunaires de l’Afrique de l’ouest: Adaptations aux pressions environ-
nementales. Thèse de doctorat (PhD), Toulouse, 278 p.
[6] Mostarih, M.M.M., Faid El Madani, F.E., Yahya, H.S.A., Hachemi, O.E., Abdellaoui,
S. and Chafi, A. (2016) Evaluation physico-chimique de la qualité de l’eau de la la-
gune de Nador—Nord du Maroc oriental après l’ouverture de la nouvelle passe.
Journal of Materials and Environmental Science, 7, 4795-5809.
http://www.jmaterenvironsci.com
[7] Wootton, R.J. (1992) Fish Ecology. Blackie and Son, Glasgow, 212 p.
https://doi.org/10.1007/978-94-011-3832-1
[8] Albaret, J.-J. (1987) Les peuplements de poissons de la Casamance Sénégal en péri-
ode de sécheresse. Revue d’Hydrobiologie tropicale, 20, 291-310.
[9] Diouf, P.S. (1996) Les peuplements de poissons des milieux estuariens de l’Afrique
de l’Ouest: l’exemple de l’estuaire hyperhalin du Siné-Saloum. Office de la Re-
cherche Scientifique et Technique Outre-Mer (ORSTOM), Paris, Thèse et docu-
ments microfichés, Vol. 156, 303 p.
[10] Albaret, J.-J. (2006) Les peuplements des estuaires et des lagunes. In: Lévêque, C.
and Paugy, D., Eds., Les poissons des eaux continentales africaines: Diversité, écolo-
gie, utilisation par l’homme, Institut de Recherches pour le Développement (IRD),
Paris, 355-379.
[11] Albaret, J.-J. and Diouf, P.S. (1994) Diversité des poissons des lagunes et des es-
tuaires ouest-africains. In: Teugels, G.G., Guégan, J.-F. and Albaret, J.-J., Eds., Di-
versité biologique des poissons des eaux douces et saumâtres d’Afrique, Synthèses
géographiques, Annales, Musée Royal Afrique Centrale, Zoologie, Tervuren, Vol.
275, 165-177.
[12] Ibala Zamba, A., Boungou, M., Louvinguila, T.H.D., Mamonekene, V., Kombo, R.,
Kamba, E., Boukou, G., Mikembi, L.B., Ngot, F.H.P. and Akouango, P. (2020)
Anthropogenic Impacts on Fish Populations in Lake Cayo (Republic of Congo,
Central Africa). Open Journal of Ecology, 10, 757-767.
https://doi.org/10.4236/oje.2020.1012046
[13] Barré, N. (2011) Lagunes et marais littoraux: Fonctionnement, valeurs, enjeux et
menaces. Pôle relais lagunes méditerranéennes, 59 p.
[14] Kouassi, A. M. (2005) Hydrochimie et qualité des eaux de deux lagunes tropicales
de Côte d’Ivoire (Ebrié, Grand Lahou). Thèse de doctorat (PhD), Université de Co-
cody, Abidjan, 147 p.
[15] Issola, Y., Kouassi, A.M., Dongui, B.K. and Biemi, J. (2008) Caractéristiques physi-
co-chimiques d’une lagune côtière tropicale: Lagune de Fresco (Côte d’Ivoire).
Afrique Science, 4, 368-393. https://doi.org/10.4314/afsci.v4i3.61696
[16] Baran, E. (2015) Dynamique spatio-temporel le des peuplements de poissons estua-
riens en Guinée Relations avec le milieu abiotique. Thèses et documents microfichés
No.142 Office de la Recherche Scientifique et Technique Outre-Mer (ORSTOM),
Paris, 245 p.
[17] Ibala Zamba, A., Vreven, E., Mamonekene, V. and Snoeks, J., (2019) Fish Commu-
nity Assemblages in Relation to Environmental Variables in the Lefini River, Middle
Congo River Basin (Republic of Congo). Cybium, 43, 83-95.
[18] Fricke, R., Eschmer, W.N. and Fong, J.D. (2020) Eschmeyer’s Catalog of Fishes.
DOI: 10.4236/nr.2021.125011 161 Natural ResourcesT. H. Dembe Louvinguila et al.
http://researcharchive.calacademy.org/research/ichthyology/catalog/SpeciesByFamil
y.asp
[19] Kamdem Toham, A. and Teugels, G.G. (1999) First Data on an Index of Biotic In-
tegrity (IBI) Based on First Assemblages for the Assessment of the Impact of the
Deforestation in a Tropical West African River System. Hydrobiologia, 397, 29-38.
https://doi.org/10.1023/A:1003605801875
[20] Batiabo Mikembi, A.L, Ibala Zamb, A., Mamonekene, V., Poaty Ngot,.H.F., Dembe
Louvinguila, T.H. and Vouidibio J. (2019) Diversity and Distribution of Fish Species
along the Loua River, Lower Congo River Basin (Republic of the Congo, Central
Africa). International Journal of Fisheries and Aquatic Studies, 7, 171-176.
[21] Liyandja, T.L.D., Ibala Zamba, A., Sefu, C.A., Dianzuangani, D.L., Konda, R.K.,
Monsembula Iyaba, R.J.C. and Mbimbi, J.J.M.N. (2019) Environmental Influences
on Fish Species Distribution in the Musolo River System, Congo River Basin
(Democratic Republic of the Congo, Central Africa). European Scientific Journal,
15, 192-209. https://doi.org/10.19044/esj.2019.v15n33p192
[22] Ter Braak, C.J.F. and Šmilauer, P. (2003) Canoco 4. Cambridge University Press,
Cambridge, 242 p.
[23] Lande, R. (1996) Statistcs and Partitioning of Species Diversity, and Similarity
among Multiple Communities. Oikos, 76, 5-13. https://doi.org/10.2307/3545743
[24] Lobry, J., Gascuel, D. and Domain, F. (2003) La biodiversité spécifique des res-
sources démersales du plateau continental guinéen: Utilisation d’indice classique
pour un diagnostic sur l’évolution des écosystèmes. Aquatic Living Resources, 16,
59-68. https://doi.org/10.1016/S0990-7440(03)00010-X
[25] Clarke, K.R. and Gorley, R.N. (2001) Primer v5: User Manual/Tutorial. Primer-E
Ltd., Plymouth, 91 p.
[26] Shannon, C.E. (1948) A Mathematical Theory for Communication. Bell System
Technical Journal, 27, 623-656. https://doi.org/10.1002/j.1538-7305.1948.tb00917.x
[27] Pielou, E.C. (1966) The Measurement of Diversity in Different Types of Biological
Collections. Journal of Theoretical Biology, 13, 131-144.
https://doi.org/10.1016/0022-5193(66)90013-0
[28] Stiassny, M.L.J., Teugels, G.G. and Hopkins, C.D. (2007) Poissons d’eaux douces et
saumâtres de basse Guinée, ouest de l’Afrique centrale. Vol. 1, IRD (Paris), MNHN
(Paris), MRAC (Tervuren), collection faune et flores tropicales, Vol. 42, 800 p.
[29] Stiassny, M.L.J., Teugels, G.G. and Hopkins, C.D. (2007) Poissons d’eaux douces et
Saumâtres de basse Guinée, Ouest de l’Afrique Centrale. Vol. 2, Institut De Re-
cherche Pour Le Développement, Muséum National d’Histoire Naturelle, Musée
Royal de l’Afrique Central, Paris, Tervuren, Vol. 42, 603 p.
[30] Welcomme, R.L. (1988) International Introductions of Inland Aquatic Species. Fi-
sheries Technical Paper, Vol. 294, FAO, Rome, 318 p.
[31] Moreau, J., Arrignon, J. and Jubb, R.A. (1988) Les introductions d’espèces étrangères
dans les eaux continentales africaines. Intérêt et limites. In: Lévêque, C., Bruton,
M.N. and Ssentongo, G.W., Eds., Biologie et écologie des poissons d’eau douce afri-
cains, Office de la Recherche Scientifique et Technique Outre-Mer (ORSTOM),
Travaux et documents, Paris, Vol. 216, 395-425.
[32] Lévêque, C. (1997) Introductions de nouvelles espèces de poissons dans les eaux
douces tropicales: Objectifs et conséquences. Bulletin Français de la Pêche et de la
Pisciculture, 344-345, 79-91. https://doi.org/10.1051/kmae:1997012
[33] Lacroix, E. (2004) Pisciculture en milieu tropical. GFA terra systems. 225 p.
[34] Lévêque, C. and Paugy, D., (2006) Les poissons des eaux continentales africaines
DOI: 10.4236/nr.2021.125011 162 Natural ResourcesT. H. Dembe Louvinguila et al.
Diversité, écologie, utilisation par l’homme. Institut de Recherches pour le Déve-
loppement (IRD), Paris, 573 p.
[35] Whitfield, A.K. and Kok, H.M. (1992) Recruitment of Juvenile Marine Fishes into
Permanently Open and Seasonally Open Estuarine Systems on the Southern Coast
of South Africa. Ichthyology Bulletin, 57, 1-39.
http://hdl.handle.net/10962/d1019801
[36] Albaret, J.-J. and Ecoutin, J.M. (1990) Influence des saisons et des variations clima-
tiques sur les peuplements de poissons d’une lagune tropicale en Afrique de l’Ouest.
Acta Oecologica, 11, 577-583.
[37] Lévêque, C. (2017) Variability of Climate and Hydrobiological Systems. In: Paugy,
D., Leveque, C. and Otero, O., Eds., The Inland Water Fishes of Africa: Diversity,
Ecology and Human Use, Institut de recherche pour le développement (IRD), Royal
Museum for Central Africa (RMCA), 33-50.
[38] Lemoalle, J. (2006) La diversité des milieux aquatiques. In: Levêque, C. and Paugy,
D., Eds., Les poissons des eaux continentales africains: Diversité, écologie, utilisa-
tion par l’homme, Institut de Recherches pour le Développement (IRD), Paris,
11-30.
[39] Lévêque, C. and Paugy, D. (2017) Fish Communities in River Systems and Asso-
ciated Stations. In: Paugy, D., Leveque, C. and Otero, O., Eds., The Inland Water
Fishes of Africa: Diversity, Ecology and Human Use, Institut De Recherche Pour Le
Développement, Musée Royal de l’Afrique Central, Paris, Tervuren, 349-360.
https://doi.org/10.4000/books.irdeditions.25241
[40] Hugueny, B. (1990) Richesse des peuplements de poissons dans le Niandan (haut
Niger, Afrique) en fonction de la taille de la rivière. Revue d’Hydrobiologie Tropi-
cale, 23, 351-364.
[41] Ibala Zamba, A. (2010) Faune des poissons des rivières Luki et Léfini (Bassin du
Congo): Diversité et écologie. Thèse de doctorat (PhD), KU Leuven, Leuven, Belgi-
que, 452 p.
[42] Barbault, R. (1992) Écologie des populations et des peuplements. Des théories aux
faits. Masson, Paris, 200 p.
[43] Barbour, M.T., Stribling, J.B. and Karr, J.R. (1999) Multimetric Approach for Estab-
lishing Biocriteria and Measuring Biological Condition. In: Davis, W. and Simon,
T.P., Eds., Biological and Criteria: Tools for Water Resource Planning and Decision
Making, CRC Press, Boca Raton, 63-77.
[44] Thieme, M.L., Abell, R., Stiassny, M.L.J. and Skelton, P. (2005) Freshwater Ecore-
gions of Africa and Madagascar. A Conservation Assessment. Wold Wildlife Fund,
Gland, 431 p.
DOI: 10.4236/nr.2021.125011 163 Natural ResourcesYou can also read