Spatial and Temporal Variations in the Incidence of Dust Storms in Saudi Arabia Revealed from In Situ Observations
←
→
Page content transcription
If your browser does not render page correctly, please read the page content below
geosciences
Article
Spatial and Temporal Variations in the Incidence of
Dust Storms in Saudi Arabia Revealed from In
Situ Observations
Sarah Albugami 1, *, Steven Palmer 1 , Jonathan Cinnamon 1             and Jeroen Meersmans 2
 1   College of Life and Environmental Sciences, University of Exeter, Exeter EX4 4QL, UK;
     S.J.Palmer@exeter.ac.uk (S.P.); J.Cinnamon@exeter.ac.uk (J.C.)
 2   Soil and Agrifood Institute, Cranfield University, Cranfield MK43 0AL, UK;
     Jeroen.Meersmans@cranfield.ac.uk
 *   Correspondence: sarahalbugami@gmail.com

 Received: 15 March 2019; Accepted: 3 April 2019; Published: 8 April 2019

 Abstract: Monthly meteorological data from 27 observation stations provided by the Presidency of
 Meteorology and Environment (PME) of Saudi Arabia were used to analyze the spatial and temporal
 distribution of atmospheric dust in Saudi Arabia between 2000 and 2016. These data were used to
 analyze the effects of environmental forcing on the occurrence of dust storms across Saudi Arabia by
 considering the relationships between dust storm frequency and temperature, precipitation, and wind
 variables. We reveal a clear seasonality in the reported incidence of dust storms, with the highest
 frequency of events during the spring. Our results show significant positive relationships (p < 0.005)
 between dust storm occurrence and wind speed, wind direction, and precipitation. However, we did
 not detect a significant relationship with temperature. Our results reveal important spatial patterns,
 as well as seasonal and inter-annual variations, in the occurrence of dust storms in Saudi Arabia.
 For instance, the eastern part of the study area experienced an increase in dust storm events over
 time, especially in the region near Al-Ahsa. Similarly, an increasing trend in dust storms was also
 observed in the west of the study area near Jeddah. However, the occurrence of dust storm events is
 decreasing over time in the north, in areas such as Hail and Qaisumah. Overall, the eastern part of
 Saudi Arabia experiences the highest number of dust storms per year (i.e., 10 to 60 events), followed
 by the northern region, with the south and the west having fewer dust storm events (i.e., five to
 15 events per year). In addition, our results showed that the wind speeds during a dust storm are
 15–20 m/s and above, while, on a non-dust day, the wind speeds are approximately 10–15 m/s or
 lower. Findings of this study provide insight into the relationship between environmental conditions
 and dust storm occurrence across Saudi Arabia, and a basis for future research into the drivers behind
 these observed spatio-temporal trends.

 Keywords: dust storm; Saudi Arabia; spatio-temporal

1. Introduction
     Dust storms are natural phenomena which usually occur in desert areas [1–3]. These events
happen as a result of strong winds which raise dust and sand from deserts and surrounding areas
and carry it over large distances. The African and Asian deserts are the major sources of dust
worldwide [4–6]. In addition to the African Sahara region, the Middle East is the world region most
affected by dust storms [3,7–9], and within the Middle East, it is well known that the Arabian Peninsula
is one of the largest source areas of dust storms [10,11]. The vast dunes and deserts on the Arabian
Peninsula and surrounding topographically complex terrain, characterized by very low amounts of
precipitation and sparse vegetation cover, are the essential ingredients to rouse dust into the air [12–15].

Geosciences 2019, 9, 162; doi:10.3390/geosciences9040162                    www.mdpi.com/journal/geosciences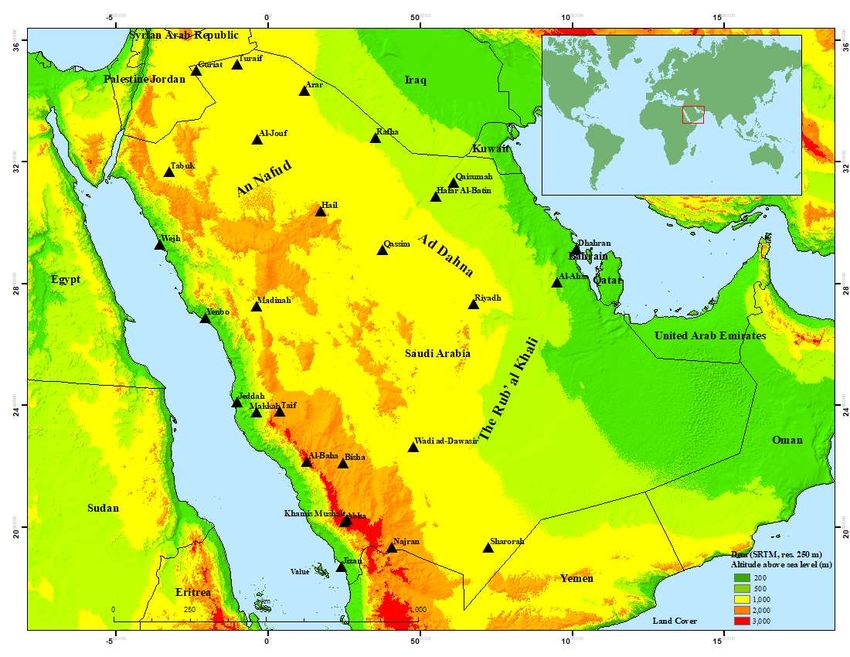
Geosciences 2019, 9, 162                                                                            2 of 20

Furthermore, the dominant northwesterly winds contribute to the extensive mobilization of dust
across the peninsula (e.g., the Al Shamaal winds) [16–19].
     Recent studies showed that dust storm outbreaks are associated with high wind speeds in the
regions of Saudi Arabia and Iraq [3], as well as in Southwest Asia [20]. Overall, the highest frequency
of dust storms is recorded in the spring, mostly originating from the Karakum desert, located in in
the west of Turkmenistan and considered as one of the main sources of dust within Asia [21]. Also,
the Sistan Basin in Iran is an important dust storm source area in southwest Asia [20]. Awad et
al. [22] and Mashat et al. [23] illustrated that the characteristics of synoptic weather conditions (i.e.,
the configuration of high-pressure and low-pressure systems) are associated with dust storm activity
over the north and southwest of Saudi Arabia. Furthermore, Rashki et al. [24] highlighted that the
Jazmurian basin, located in the southeast of Iran, produces dust storms which affect the northern part
of the Arabian Sea and the surrounding areas. Recent evidence suggests that the occurrence of dust
storm events is correlated with the Asian summer monsoon system, as well as the activity of both the
Shamal and Levar winds over the Arabian Sea during the summer season [25].
     Anthropogenic activities such as the construction of dams are likely to be associated with
increasing dust storm incidence [26,27]. For instance, research showed that the construction of the Ilisu
Dam in Turkey reduced the downstream discharge of the Tigris and Euphrates River, which resulted
in more periods of extensive drought, triggering dust storms in the wider region [28–31]. Moreover,
overgrazing by cattle and off-road driving, which can lead to serious soil degradation, are considered
as important additional contributing factors in mobilizing sand and dust [1,32–34]. Finally, recent
and ongoing conflicts in the Middle East region (e.g., Syrian civil war) and associated failures in land
management, such as the abandonment of cultivated land, should also be considered as important
factors contributing to the occurrence of dust storms in the region.
     Although dust storms can occur throughout the entire year in Saudi Arabia [10,31,35–37], on the
local scale, these phenomena are known to be variable in space and time. Previous studies showed
that the peak in dust storm activity occurs at different times of year in different regions; for instance,
in the southern region near the Red Sea coast, dust storms mostly occur during the middle of the
winter season (December–January–February); whereas in the Northern region around the An Nafud
desert it peaks in the spring season (March–April–May) [38]. However, there is limited systematic
understanding of how variations in environmental drivers lead to spatial and temporal variations
in the occurrence of dust storms across the entire Arabian Peninsula. Hence, this study aims to
improve our understanding of how climate variables—specifically temperature, precipitation, wind
speed, and wind direction—influence the incidence of dust storms in Saudi Arabia. This study also
seeks to provide a comprehensive characterization of the seasonal variation in the frequency and the
distribution of dust storms over different regions in the study area.

2. Materials and Methods

2.1. Study Area
     Saudi Arabia is located in the southwest of the Asian continent. Most of its territory is covered by
vast arid deserts, with the exception of the southwestern part of the country [39]. The largest desert is
the Empty Quarter (or Rub’ al Khali), which dominates the southern part of the Arabian Peninsula
and covers more than 650,000 km2 . Other important deserts are found in the north, including the An
Nafud desert with an area of 57,000 km2 , and in the east of Saudi Arabia, including the Ad Dahna
desert, with an area of 1450 km2 [13,40,41] (see Figure 1).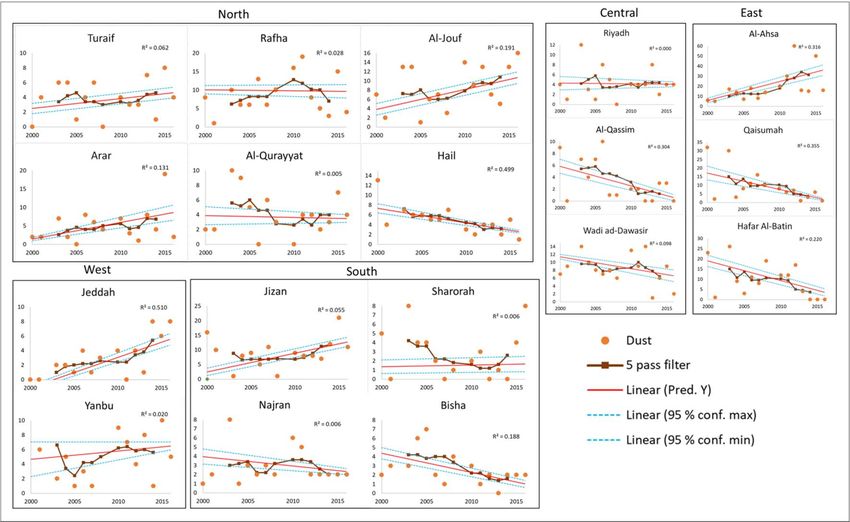
Geosciences 2019, 9, 162                                                                                     3 of 20
Geosciences 2019, 9, x FOR PEER REVIEW                                                                       3 of 20

      Figure 1.
      Figure  1. Elevation
                 Elevation map
                           map ofof the
                                    the Arabian
                                        Arabian Peninsula
                                                Peninsula with
                                                          with annotation
                                                               annotation of
                                                                          of major
                                                                             major cities
                                                                                   cities and deserts, as
                                                                                          and deserts, as well
                                                                                                          well
      as the
      as the location
             location of
                      of the
                         the in
                             in situ
                                situ dust
                                     dust storm
                                          storm measurement
                                                measurement stations.
                                                             stations.

     Climatologically, Saudi
     Climatologically,    Saudi Arabia
                                Arabia is    known to
                                          is known       be one
                                                      to be  one of
                                                                  of the
                                                                     the driest
                                                                          driest places
                                                                                 places in
                                                                                        in the
                                                                                           the world,
                                                                                                world, with
                                                                                                        with an
                                                                                                              an
average annual
average  annual precipitation
                  precipitationofofless
                                    lessthan
                                         than100
                                               100mmmmperper  year
                                                           year    [43].
                                                                 [42]. TheThe temperatures
                                                                            temperatures  areare in excess
                                                                                              in excess    of ◦50
                                                                                                        of 50   C
°C in the summer season. On the other hand, in the winter season, the average maximum temperature
in the summer    season.  On  the other   hand,  in the winter  season,   the average maximum      temperature
drops to
drops     8–17 ◦°C
       to 8–17   C [44],
                   [43], at
                         at which
                            which time
                                   time most
                                         most ofof the annual rainfall
                                                   the annual  rainfall occurs,
                                                                         occurs, especially
                                                                                 especially in
                                                                                            in the western and
                                                                                               the western  and
southern regions.
southern   regions. Central  regions are
                    Central regions   are relatively
                                           relatively cold
                                                       cold and
                                                            and dry
                                                                 dry in
                                                                      in the
                                                                         the winter.
                                                                             winter.

2.2. Dust Storm
2.2. Dust Storm and
                and Climate
                    Climate Variable
                            Variable Data
                                     Data
2.2.1. Monthly Dust Storm Observations
2.2.1. Monthly Dust Storm Observations
      Monthly dust storm data for 27 in situ stations were obtained from the Presidency of Meteorology
      Monthly dust storm data for 27 in situ stations were obtained from the Presidency of
and Environment (PME) of Saudi Arabia, which is the official governmental climate agency in Saudi
Meteorology and Environment (PME) of Saudi Arabia, which is the official governmental climate
Arabia [44] for the period 2000–2016 (Figure 1). Incomplete observational records were available
agency in Saudi Arabia [45] for the period 2000–2016 (Figure 1). Incomplete observational records
for two years in this period (2002 and 2009); thus, these records were omitted from the analysis.
were available for two years in this period (2002 and 2009); thus, these records were omitted from the
This dataset was used to analyze the spatio-temporal distribution of dust storm events across Saudi
analysis. This dataset was used to analyze the spatio-temporal distribution of dust storm events
Arabia, including seasonal and inter-annual variations. The raw data for each station were analyzed
across Saudi Arabia, including seasonal and inter-annual variations. The raw data for each station
in Microsoft Excel, including temporal linear trend fitting and five-pass filtering. The stations are
were analyzed in Microsoft Excel, including temporal linear trend fitting and five-pass filtering. The
situated across all of the 13 regions of Saudi Arabia (i.e., Riyadh, Makkah, Madinah, Al-Qassim, Eastern
stations are situated across all of the 13 regions of Saudi Arabia (i.e., Riyadh, Makkah, Madinah, Al-
Province, Asir, Tabuk, Hail, Northern Borders, Jizan, Najran, Baha, and Al-Jouf). Moreover, the Pandas
Qassim, Eastern Province, Asir, Tabuk, Hail, Northern Borders, Jizan, Najran, Baha, and Al-Jouf).
package for Python (WinPython-64bit-3.5.2.3) [45] was used to analyze the seasonal variation in the
Moreover, the Pandas package for Python (WinPython-64bit-3.5.2.3) [46] was used to analyze the
frequency of dust storms, as well as meteorological conditions (precipitation, temperature, and wind).
seasonal variation in the frequency of dust storms, as well as meteorological conditions (precipitation,
      Vector dust storm data from all 27 stations were spatially interpolated by using the “spline with
temperature, and wind).
barrier” tool in ArcGIS 10.5.1, producing continuous raster layers representing the spatio-temporal
      Vector dust storm data from all 27 stations were spatially interpolated by using the “spline with
variability of dust storms across the entire study area. The spline with barrier interpolation method
barrier” tool in ArcGIS 10.5.1, producing continuous raster layers representing the spatio-temporal
estimates values using a mathematical algorithm which minimizes the surface curvature with a barrier
variability of dust storms across the entire study area. The spline with barrier interpolation method
of a chosen area, producing a smooth surface based on the input points [46]. The interpolation was
estimates values using a mathematical algorithm which minimizes the surface curvature with a
applied to provide the rate of the change of the frequency of dust storms over the study period.
barrier of a chosen area, producing a smooth surface based on the input points [47].The interpolation
was applied to provide the rate of the change of the frequency of dust storms over the study period.

2.2.2. Climate Variable Data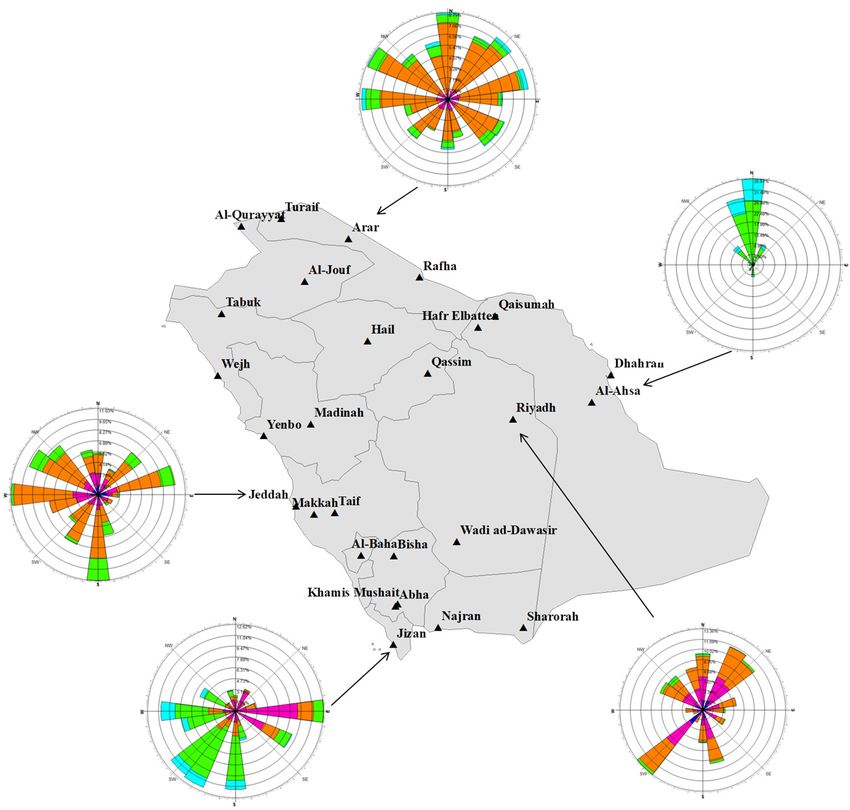
Geosciences 2019, 9, 162 4 of 20
2.2.2. Climate
Geosciences 2019,Variable DataREVIEW
9, x FOR PEER 4 of 20
WeWe also
also usedusedmonthly
monthlyaveraged
averaged climate
climate data provided by
data provided byPME
PMEfor for2727ininsitu
situmeteorological
meteorological
stations, covering the period 2000–2016, in order to determine the correlation
stations, covering the period 2000–2016, in order to determine the correlation between specific climate between specific
climate variables
variables and the andoccurrence
the occurrence frequency
frequency of dust
of dust storms.
storms. These
These climate
climate variables
variables were
were average
average
temperature ( ◦ C) and average numbers of rain events per station. To investigate the wind speed and
temperature (°C) and average numbers of rain events per station. To investigate the wind speed and
direction
directionat at
eacheach ininsitu
situstation,
station,weweused
useddaily
daily data from the
data from the METAR/TAF
METAR/TAF(Meteorological
(Meteorological Terminal
Terminal
Aviation
Aviation Routine
Routineand andTerminal
TerminalAerodrome
Aerodrome Forecast) aviation routine
Forecast) aviation routineweather
weatherreport
report at at hourly
hourly or or
half-hourly
half-hourly intervals.
intervals.These
Thesedatadatacontain
contain observations
observations of of the
themeteorological
meteorologicalelements
elements such
such as as surface
surface
wind,
wind, visibility,and
visibility, andpresent
presentweather
weather (e.g.,
(e.g., dust
dust storm,
storm, haze,
haze, mist,
mist,and
andthunderstorm),
thunderstorm),clouds clouds of of
operational
operational significance,air
significance, airtemperature,
temperature, dew-point
dew-point temperature,
temperature,and andatmospheric
atmosphericpressure.
pressure. These
These
reports
reports areare
basedbasedon onthethe coding
coding of the
of the present
present weather,
weather, whichwhich is observed
is observed and and forecasted
forecasted by theby World
the
World Meteorological Organization
Meteorological Organization [47–49]. [48–50].
In order
In order to understand
to understand thethe relationship
relationship between
between thethe wind
wind velocity
velocity andandthethe occurrence
occurrence of of
thethe
dust
dust storms at each of the five monitoring stations, we compared wind
storms at each of the five monitoring stations, we compared wind patterns under dust-free weatherpatterns under dust-free
weather conditions
conditions versus dust versus
stormdust storm conditions
conditions for the for the period
period 2005–2017.
2005–2017. To do Toso,
dowe so, created
we created windwindrose
rose diagrams to compare the prevailing wind directions and wind speed under these two conditions
diagrams to compare the prevailing wind directions and wind speed under these two conditions across
across different regions within Saudi Arabia.
different regions within Saudi Arabia.
2.3.2.3. Statistical Analysis
Statistical Analysis
To gain a stronger understanding of the variability in the observed occurrence of dust storms,
To gain a stronger understanding of the variability in the observed occurrence of dust storms,
we analyzed the possible existence of temporal trends across several Saudi Arabia stations between
we analyzed the possible existence of temporal trends across several Saudi Arabia stations between
2000 and 2016 by conducting regression analyses [51]. The associated coefficients of determination
20002and 2016 by conducting regression analyses [50]. The associated coefficients of determination
(R ) and model uncertainty were considered to evaluate the goodness of these fits. Moreover, a
(R2Pearson
) and model uncertainty were considered to evaluate the goodness of these fits. Moreover,
correlation coefficient (r) analysis was used to investigate the potential existence of
a Pearson correlation
significant coefficient
relationships (r) analysis
between was variables
the weather used to investigate the potential
and the frequency existence
of dust of significant
storm occurrence
relationships
(Figure 2). between the weather variables and the frequency of dust storm occurrence (Figure 2).
Figure
Figure 2. 2. Methodologicalflowchart
Methodological flowchartof
of spatio-temporal
spatio-temporal variability
variabilityinindust
duststorms
stormsover
overSaudi Arabia.
Saudi Arabia.
3. Results
3. Results
3.1.3.1.
Inter-Annual
Inter-AnnualVariation
VariationofofDust
DustStorms
Storms
Figure 3 presents
Figure 3 presentsa amoving
movingaverage
average (five-pass) filter applied
(five-pass) filter appliedtotothe
thetotal
totalnumber
numberofof dust
dust storms
storms
recorded across all in situ stations within the study
recorded across all in situ stations within the study area between the years 2000 and 2016. This figure
between the years 2000 and 2016. This figure
highlights the temporal trend of the annual number of dust events as recorded over all the in situ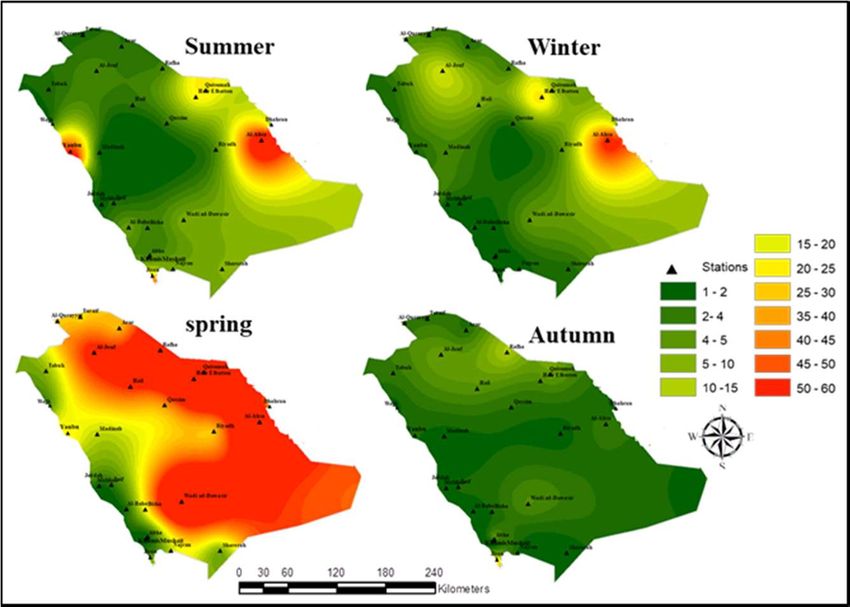
Geosciences 2019, 9, 162 5 of 20
Geosciences 2019, 9, x FOR PEER REVIEW 5 of 20
highlights
stations the2019,
across
Geosciences temporal
entire trend
9, x FOR Saudi
PEER of theby
Arabia
REVIEW annual
usingnumber
the linear ofregression
dust events lineaswith
recorded over model
associated all the in situ
5 oferror
20
stations across entire Saudi Arabia by using the linear regression line
bounds (at 95% confidence interval) method. Figure 4 shows the linear regression analysis with with associated model error
stations across entire Saudi Arabia by using the linear regression line with associated model error
associated
bounds (at 95% model error bounds
confidence (at 95%
interval) confidence
method. interval)
Figure 4 showswhich the was applied
linear to the dataset
regression analysis of the
with
bounds (at 95% confidence interval) method. Figure 4 shows the linear regression analysis with
total dust events per PME station between the years 2000 and 2016, including the five-pass filter. Thisthe
associated model error bounds (at 95% confidence interval) which was applied to the dataset of
associated model error bounds (at 95% confidence interval) which was applied to the dataset of the
figure
total
totalillustrates
dust eventsthe
dust events per
pertemporal
PME station
PME stationtrend in thethe
between
between frequency
years 2000ofand
the years 2000 dustandevents
2016,
2016,inincluding
including each
the station.
five-passFurthermore,
the five-pass filter.
filter. This
Table
This 1 shows
figure
figure the slope
illustrates
illustrates the coefficient
thetemporal
temporal values
trend
trend inin of
the
the the temporal
frequency
frequency oflinear
of dust dust regression
events
events analysis
in each
in each (annual
station.
station. change
Furthermore,
Furthermore,
in the
Table 1 number
shows theof dust
slope storms) with
coefficient associated
values of the standard
temporal error value
linear (and
regression level of confidence)
analysis
Table 1 shows the slope coefficient values of the temporal linear regression analysis (annual change (annual for each in
change
station
the number over
in the number the
of dust study
of storms) area. Figure
withwith
dust storms) 5
associated shows
associated the
standard results
standarderror of the
value(and
error value spatial
(andlevel
levelinterpolation
of of confidence)
confidence) analysis,
for each
for each
highlighting
station over the
station inter-annual
overstudy
the study variability
area. Figure
area. Figure in 5dust
5 shows the storms
shows the and
results of their
the
results ofspatial
spatial distribution
theinterpolation
spatial between
analysis,
interpolation the years
highlighting
analysis,
2000 and 2016.
highlighting
inter-annual inter-annual
variability in dustvariability
storms and in dust storms
their anddistribution
spatial their spatialbetween
distribution
thebetween the and
years 2000 years2016.
2000 and 2016.
Figure
Figure 3. 3.
Figure Temporal
Temporal
3. Temporal trend
trendtrend analysis
analysis
analysisofof
the
of the total
total
the annual
annual
total numberof
annualnumber
number ofdust
of duststorm
dust stormevents
storm events
events as
asas recorded
recorded
recorded overall
over
over
theall the
inall
situ instations
the situ
in stations
situ across
stations across
entireentire
across Saudi
entire Saudi
Arabia
Saudi Arabia between
between
Arabia the
thethe
between years
years 2000
years 2000
2000and and
and 2016,
2016,
2016, including
including
including a five-
aa five-
five-pass
pass
filter pass
and filter and
filter
linear andlinear
linearregression
regression regression line
line with with
with associated
lineassociated
associated
modelmodel
model error
errorerror bounds
bounds
bounds (at95%
(at(at
95% 95% confidence
confidence
confidence interval).
interval).
interval).
Figure Figure 4. Scatter
4. Scatter plots
plots showingthe
showing thetotal
total annual
annual number
numberofofdustduststorm
stormevents per per
events Presidency of of
Presidency
Figure 4.
MeteorologyScatter
andplots showing
Environment the
(PME) total annual
station number
between the of
yearsdust
2000 storm
and events
2016, per
including
Meteorology and Environment (PME) station between the years 2000 and 2016, including a five-pass Presidency
a five-pass of
Meteorology and
filter and linear Environment
regression line(PME) station
with associated between the
model erroryears
bounds2000
(at and
95% 2016, including
confidence
filter and linear regression line with associated model error bounds (at 95% confidence interval). a five-pass
interval).
filter and linear regression line with associated model error bounds (at 95% confidence interval).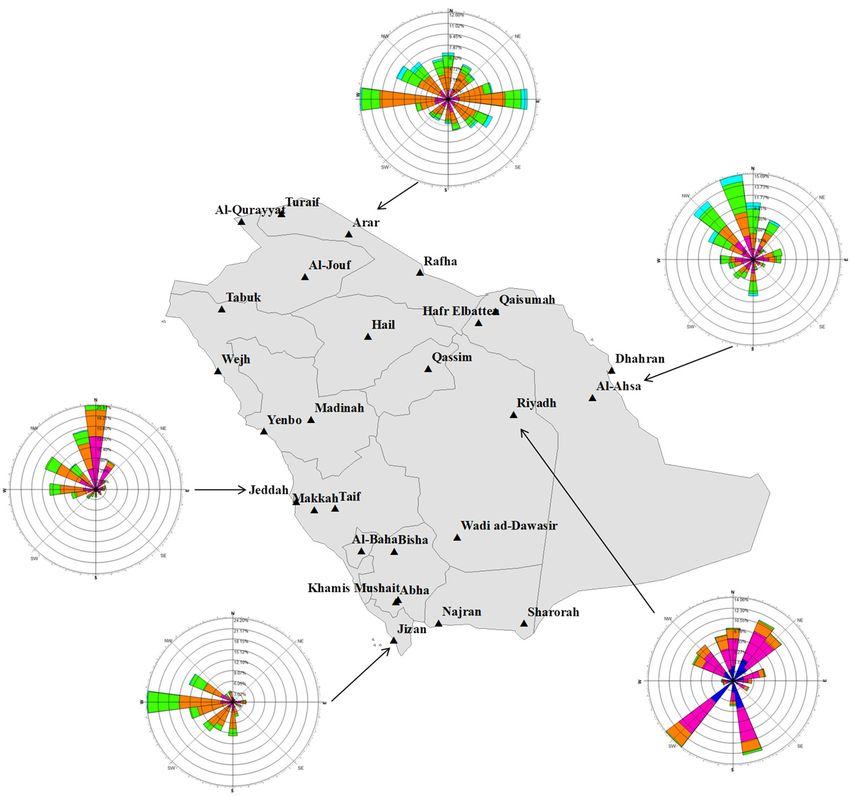
Geosciences 2019, 9, 162                                                                                     6 of 20

      Table 1. Slope coefficient values of the temporal linear regression analysis (annual change in number
      of dust storms) with associated standard error value (and level of confidence). Rows are colored by
      the sign of the trend (yellow for positive, blue for negative) and significance of trend (darker is more
      significant).

                                                Parameter
                     Station                                                  Significance Level
                                        Value         Uncertainty
                     Turaif            0.1083               0.1323
                      Arar             0.3249               0.2358
                 Al-Qurayyat            0.055               0.1579
                    Al Jouf            0.3763               0.2368
                     Rafha             0.1696                0.274
                      Hail             −0.3944              0.1094                    ***
                  Qaisumah             −1.1019               0.419                    ***
                Hafar Al-Batin         −0.8023               0.407                     **
                   Al-Ahsa             1.7066               0.7068                     **
                   Riyadh              0.0225               0.1675
                  Al Qassim            −0.3583              0.1551                    **
               Wadi ad-Dawasir         −0.2355              0.1924
                    Jeddah             0.3745               0.1031                    ***
                    Yanbu              0.0237               0.2589
                     Jizan             0.2364               0.2665
                  Sharorah             0.0823               0.1455
                    Najran             −0.0252              0.1055
                     Bisha             −0.1525              0.0898
                                                                     Level of Significance
                  Color Code                            p < 0.10           p < 0.05          p < 0.01
               Increase over time     Positive              *                 **                ***
               Decrease over time     Negative              *                 **                ***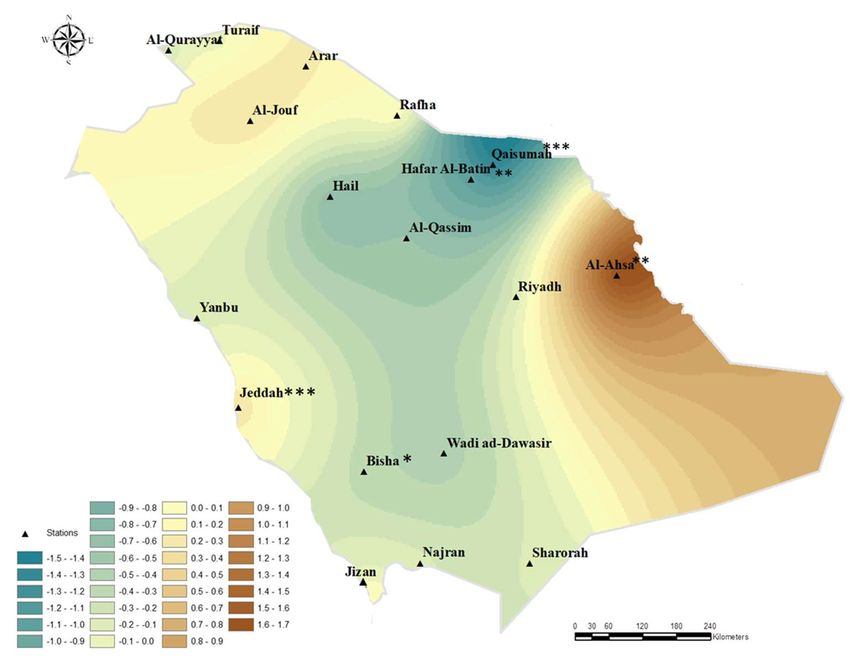
Geosciences 2019, 9, 162                                                                                        7 of 20
   Geosciences 2019, 9, x FOR PEER REVIEW                                                                          7 of 20

        Figure
      Figure  5. 5.Spatially
                    Spatiallyinterpolated
                              interpolated dust
                                             dust storm
                                                  storm frequency
                                                          frequencyper
                                                                     peryear
                                                                         yearover
                                                                              overSaudi Arabia
                                                                                    Saudi      forfor
                                                                                           Arabia  thethe
                                                                                                       period 2000–
                                                                                                           period
        2016. Note
      2000–2016.      thatthat
                    Note   the the
                               highest  frequency
                                   highest          of total
                                            frequency        dustdust
                                                        of total  event occurrences
                                                                      event         varies
                                                                            occurrences    fromfrom
                                                                                        varies   yearyear
                                                                                                      to year with a
                                                                                                          to year
        concentration
      with               mostly
           a concentration       in the
                              mostly  in east region.
                                         the east region.

3.2.3.2.
      Spatio-Temporal Variability
         Spatio-Temporal          Analysis
                         Variability       of Dust
                                     Analysis      Storms
                                              of Dust     in Saudi
                                                      Storms       Arabia
                                                             in Saudi Arabia
      Figure
        Figure6 presents thethe
                6 presents   inter-annual  trend
                                inter-annual      in in
                                              trend  dust storm
                                                        dust stormevent occurrence
                                                                    event          over
                                                                          occurrence    entire
                                                                                     over      Saudi
                                                                                          entire     Arabia
                                                                                                 Saudi Arabia
after interpolating  the associated  slope parameter    value  from  each station.
   after interpolating the associated slope parameter value from each station.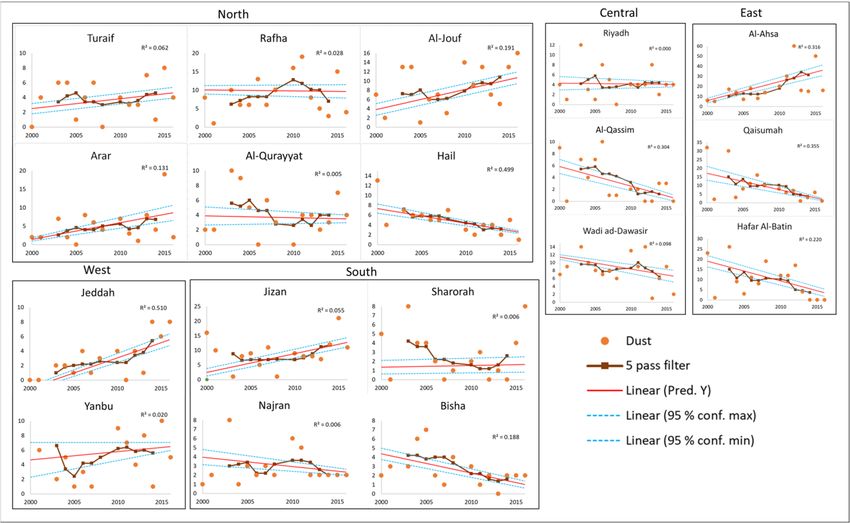
Geosciences 2019, 9, 162 8 of 20
Geosciences
Geosciences 2019,
2019, 9, x9,FOR
x FOR PEER
PEER REVIEW
REVIEW 8 of8 20
of 20
Figure
Figure
Figure 6.
6. 6. Annual
Annual
Annual change
change in in
change in dust
dust storm
storm
dust frequency
frequency
storm (number
(number
frequency (number of of events/year)
events/year)
of events/year) over
over Saudi
Saudi
over Saudi Arabia.
Arabia.
Arabia.
Increasing
Increasing
Increasing trends
trends
trends are
areare shown
shown
shown in
in in brown,
brown, while
while
brown, decreasing
decreasing
while trends
trends
decreasing are
areare
trends shown
shown
shown in
inin blue
blue (Table
(Table
blue 1).
1).1).
(Table
3.3.
3.3.
3.3. Regional
Regional
Regional Differences
Differences
Differences in
in in Seasonality
Seasonality
Seasonality of Dust
of Dust
of Dust Storms
Storms
Storms
Figure
Figure
Figure 77 indicates
indicates
7 indicates the
thethe spatial
spatial
spatial distribution
distribution
distribution of
of of the
thethe total
total
total number
number
number of
of of dust
dust
dust storms
storms
storms per
perper season
season
season as
as as being
being
being
recorded
recorded
recorded over
over
over the
thethe entire
entire
entire period
period
period 2000–2016.
2000–2016.
2000–2016.
Figure
Figure
Figure 7.
7. Map
7. Map of of
Map of the
thethe total
total amount
amount
total of of
amount of dust
dust storms
storms
dust perper
storms season
season
per recorded
recorded
season over
over
recorded thethe
over period
period
the 2000–2016.
2000–2016.
period 2000–2016.
3.4.
3.4. Seasonal
Seasonal Variations
Variations across
across AllAll Stations
Stations
The
The graphs
graphs below
below show
show thethe seasonal
seasonal variation
variation in in
thethe frequency
frequency of of
dustdust storms,
storms, temperature,
temperature,
frequency
frequency of of precipitation,
precipitation, andand wind
wind speed
speed forfor
allall
PMEPME stations
stations and
and forfor
eacheach station
station (Figures
(Figures 8 and
8 and
9).9).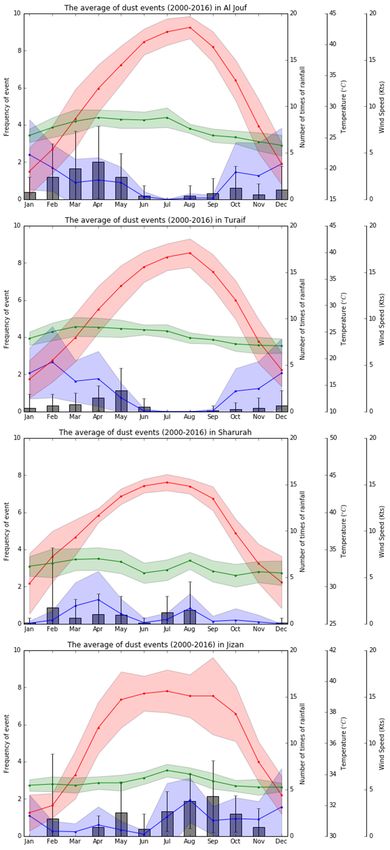
Geosciences 2019, 9, 162                                                                                                            9 of 20

3.4. Seasonal Variations across All Stations
     The graphs below show the seasonal variation in the frequency of dust storms, temperature,
frequency    of precipitation,
      Geosciences                  and
                  2019, 9, x FOR PEER   wind speed for all PME stations and for each station (Figures
                                      REVIEW
     Geosciences 2019, 9, x FOR PEER REVIEW
                                                                                                     98of and
                                                                                                          20
                                                                                                    9 of 20
                                                                                                              9).

             Figure 8. Seasonal variation in (i) the frequency of dust storms in gray, (ii) temperature in red, (iii)
             Figure 8. Seasonalvariation
                8. Seasonal       variation in (i)
                                                 (i)the frequency of dust     storms  in gray,
                                                                                            in (ii) temperature    in red, (iii) red,
      Figure  frequency   of precipitation ininblue, the
                                                      andfrequency       of dust
                                                            (iv) wind speed        storms
                                                                               in green for all gray,
                                                                                                PME     (ii) temperature
                                                                                                      stations.  The values in in
             frequency
      (iii) frequency   of  precipitation in  blue,  and  (iv) wind   speed  in  green for all PME   stations.  The  values  in
              the graphofrepresent
                            precipitation  in blue,and
                                     the average      andthe (iv)associated
                                                                   wind speed    in green
                                                                            standard       for all (by
                                                                                       deviation    PME   stations.
                                                                                                       error         The
                                                                                                               bars or     values
                                                                                                                        shaded     in
             the graph represent the average and the associated standard deviation (by error bars or shaded
      the graph    represent   the average    and
              surface) for the period 2000–2016.    the associated     standard   deviation   (by  error  bars  or shaded    surface)
             surface) for the period 2000–2016.
      for the period 2000–2016.

                                                            Figure 9. Cont.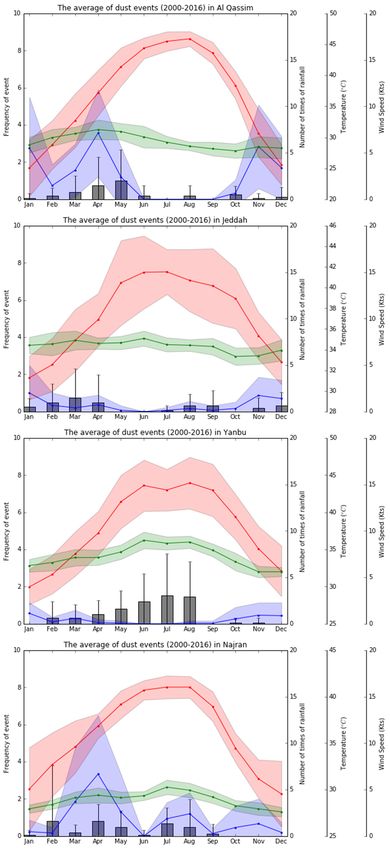
Geosciences 2019, 9, 162                                                                                               10 of 20
       Geosciences 2019, 9, x FOR PEER REVIEW                                                                     10 of 20

      FigureFigure  9. Scatter
              9. Scatter  plotsplots showing
                                 showing   thethe total
                                               total    annualnumber
                                                      annual   number of of dust
                                                                            duststorm
                                                                                 stormevents
                                                                                        events per PME
                                                                                                 per   station
                                                                                                     PME       between
                                                                                                          station between
            the  years 2000  and  2016, including  a five-pass filter and linear regression line with
      the years 2000 and 2016, including a five-pass filter and linear regression line with associatedassociated model
                                                                                                                    model
            error bounds
      error bounds         (at 95%
                     (at 95%         confidence
                                confidence      interval).
                                             interval).
Rafha 0.223 0.109 0.756 **
Najran 0.805 ** 0.140 0.173
Al Qurrayat 0.277 −0.110 −0.023
Sharurah 0.506 ** 0.317 0.705 **
Al-Ahsa 0.300 0.003 0.772 **
Geosciences 2019, 9, 162 Wadi ad-Dawasir 0.894 ** 0.096 0.461 11 of 20
Al-Qaysumah −0.038 0.284 0.697 **
° p < 0.10; * p < 0.05; ** p < 0.005.
3.5. Spatio-Temporal Variations in Wind Speed and Direction
3.5. Spatio-Temporal Variations in Wind Speed and Direction
Figure 10 illustrates the wind speed and direction for two dust presence conditions, dust free
Figure 10 illustrates the wind speed and direction for two dust presence conditions, dust free
and dust
and storms for the
dust storms period
for the 2005–2017.
period 2005–2017.ToTo make thiscomparison
make this comparison across
across entire
entire Saudi
Saudi Arabia,
Arabia, we we
chose chose
the following fivefive
the following main cities,
main Riyadh
cities, Riyadhrepresenting thecentral
representing the central region,
region, Al-Ahsa
Al-Ahsa representing
representing the the
eastern region,
eastern Jeddah
region, representing
Jeddah representingthe thewestern
western region, Ararrepresenting
region, Arar representingthe the northern
northern region,
region, and and
Jizan representing
Jizan representing the northern
the northern region.
region.
a) Dust storm
Geosciences 2019, 9, x FOR PEER REVIEW 12 of 20
b) Dust free
Figure 10.
Figure 10. Wind
Windroses
rosesrepresenting wind
representing direction
wind and wind
direction andspeed
windcovering the periodthe
speed covering 2005–2017
periodunder
2005–2017
dust storm conditions (a) and dust-free conditions (b).
under dust storm conditions (a) and dust-free conditions (b).
4. Discussion
4.1. Inter-Annual Variation of Dust Storms
Figure 3 shows that, when considering all the dust storms recorded in the 27 in situ stations
across Saudi Arabia, 2013 had the highest five-pass filter value. However, when looking at theGeosciences 2019, 9, 162 12 of 20
4. Discussion
4.1. Inter-Annual Variation of Dust Storms
Figure 3 shows that, when considering all the dust storms recorded in the 27 in situ stations across
Saudi Arabia, 2013 had the highest five-pass filter value. However, when looking at the unfiltered
data, the highest annual total number of dust storm events was recorded in 2003 with 203 events
(Figure 3). From the temporal analysis of each station (i.e., graphs in Figure 4), both the frequency of
occurrence of dust storms and the long-term trends varied to a large extent depending on the location.
A gradual increase in dust events with an associated significant linear regression slope was noted
in Al-Ahsa (1.71 ± 0.71 y−1 ) and Jeddah (0.37 ± 0.10 y−1 ). Furthermore, our analysis revealed a
considerable increase in the frequency of dust storms in Arar (0.32 ± 0.24 y−1 ), Turaif (0.11 ± 0.13 y−1 ),
Al-Jouf (0.38 ± 0.24 y−1 ), Rafha (0.17 ± 0.27 y−1 ), and Jizan (0.24 ± 0.27 y−1 ); however, the analysis
did not show a significant linear regression slope parameter in these cases (Table 1). Moreover Figure 4
suggests a decrease in the number of dust storms over more recent years with fewer dust storms in 2013,
2015, and 2016, resulting in a long-term decreasing trend of dust storm occurrences across multiple
stations, as indicated by significant negative regression slope parameters in Hail (−0.39 ± 0.11 y-1 ),
Qaisumah (−1.10 ± 0.42 y−1 ), Hafar Al-Batin (−0.80 ± 0.41 y−1 ), Al Qassim (−0.36 ± 0.16 y−1 ), and
Bisha (−0.15 ± 0.09 y−1 ) (Table 1).
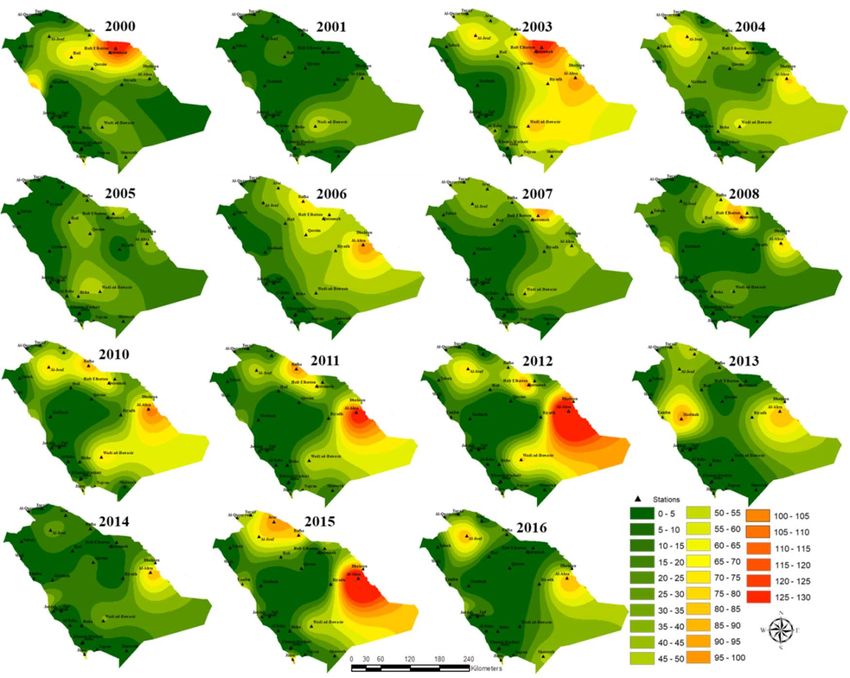
From Figure 5, it is evident that the highest annual frequency of dust events varies in space
and, depending on the year, may occur either in the east (i.e., near Qaisumah, Hafar Al-Batin, and
Al-Ahsa), north (i.e., near Turaif, Arar, Al-Qurayyat, Al-Jouf, and Rafha), and the center (i.e., near Wadi
ad-Dawasir, Riyadh, and Al-Qassim). The highest frequency of dust storms in Saudi Arabia occurred
in 2003, which accounted for 10.74% of the total events recorded between 2000 and 2016. Notably,
in 2003, dust storms were concentrated in the eastern region with 30, 26, and 17 events recorded in
Qaisumah, Hafar Al-Batin, and Al-Ahsa, respectively. The second highest frequency was recorded
in 2015 which accounted for 9.99% of the total dust storm events during the study period, which
were particularly concentrated in the region around Al-Ahsa. Figure 5 also highlights that the lowest
number of dust storm events were recorded in the years 2005, 2014, and 2016, which is in line with the
observations made for Figures 3 and 4.
4.2. Spatio-Temporal Variability Analysis of Dust Storms in Saudi Arabia
In general, our results showed that, despite the rather high inter-annual variability of dust events
across entire Saudi Arabia, there exist some remarkable long-term trends in total annual number of
dust storms, i.e., (i) an increasing trend in the east toward southeastern, and (ii) a decreasing trend
in the northeast toward central and southern parts of the country, as illustrated in Figure 6. More
precisely, Al-Ahsa in the east and Jeddah in the west were marked by a significant increases (p < 0.05)
in dust storms over the past 16 years, whereas, for the same period of time, significant decreases
in dust storm occurrence were recorded in Hail, Qaisumah, Hafar Al-Batin, and Al-Qassim in the
northeast–center (p < 0.05) and Bisha in the south (p < 0.1).
4.3. Regional Differences in Seasonality of Dust Storms
Findings of this study demonstrated a strong spatial variability in dust storm occurrence in Saudi
Arabia, with the highest frequency of dust storm events in the eastern region, especially in Hafr
Al-Batin, Qaisumah, and Al-Ahsa, which is in line with other findings in the literature (e.g., [35,51,52]).
In addition to the eastern region, the north part of the study area was also characterized by a high
frequency of dust storm events, in particular, Al-Jouf and Rafha. Furthermore, it can be seen that the
dust storm frequency reduced from the center to the southwest and increased slightly to the west (e.g.,
Yanbu) (Figure 7). However, Figure 7 reveals some remarkable seasonal differences. In general, when
considering the entire country, our results emphasized that the highest frequency of dust occurs during
the spring and summer (i.e., March–August), whereas the lowest number of dust storms events tookGeosciences 2019, 9, 162 13 of 20
place in the autumn and winter (i.e., September–November). More precisely, Figure 7 highlights that,
in most regions, except the west, the dust storm frequency reached its maximum during the spring (i.e.,
March–May). However, during the summer the very high frequency of dust storm occurrence was
restricted to the areas around Al-Ahsa in the east and Yanbu in the west [53]. Furthermore, we also
identified a high frequency of dust events during the winter season in the eastern and northern parts
of the study area (i.e., near Al-Ahsa, Hafar Al-Batin, and Al-Jouf), as well as two regions characterized
by a slightly higher frequency of dust storms over the autumn, of which one is located in the north of
the Arabian Peninsula (i.e., near Rafha) and the other is located in the southern region (i.e., near Jizan)
(Figure 7).
4.4. Seasonal Variations across All Stations
According to our analysis of the seasonality of dust storms for the entire study site, dust storm
events across Saudi Arabia occur throughout the entire year; however, similar to observations at the
regional scale, there is a clear seasonal variability, with a maximum peak in dust storm occurrence
(30 ± 11) in April (Figure 8). The monthly incidence of dust storms remains high (25 ± 10) during May,
then drops significantly to less than 10 per month for the remainder of the calendar year. The period
with the fewest dust storms is November to January (~4 ± 3). Between January and April, there is a
steady increase in dust storm frequency, rising to the peak in April.
Considering the bar graphs for the individual stations in Figure 9, the most noticeable feature is
that the mean dust storm frequency reaches its maximum peak in April in most of the regions (e.g.,
Riyadh, Jeddah, Hail, Al-Jouf, Bisha, Hafr Al-Batin, Arar, Rafha, and Al-Ahsa). Moreover, it is evident
that, in Al-Ahsa, there is a longer period of high-frequency dust storm occurrence, i.e., between the
months of February and June, after which the frequency of dust storms dramatically declines to fewer
than two per month in August–October. Furthermore, the plots for Yanbu and Jizan, both located
on the west coast, do not follow the general intra-annual distribution of dust storms, but have the
highest frequency in dust storms around September for Jizan and for the period July–August for Yanbu.
However, their frequency of dust storms is low overall (Figure 9).
4.4.1. The Relationship between Dust Storms and Temperature
There is a clear and robust seasonal variation in air temperature across the peninsula, with a
peak of 42 ± 2 ◦ C in August, decreasing steadily to a minimum around 26 ± 4 ◦ C in December
(Figure 8). Pearson correlation coefficient analysis (Table 2) was used to investigate the relationship
between air temperature and dust storm occurrence. Our results (Table 1) indicated that, although
there was a positive correlation (i.e., value of 0.24) between the two variables, it was not statistically
significant. However, Figure 8 shows that the seasonal maximum temperature occurs in a period (July
to September) characterized by a relatively small number of dust storms.
A very similar intra-annual trend in temperature can be observed across all individual stations
(Figure 9). Hence, the relationship between dust storms and temperature was not significant in most
of the regions, except for the three stations located along the western coast of Saudi Arabia. However,
across these locations, no consistent pattern could be identified, because Jeddah was characterized
by a significant negative correlation (i.e., r = −0.55), whereas Yanbu and Jizan were characterized by
significant positive correlations (i.e., r = 0.69 in both cases) (Table 2).Geosciences 2019, 9, 162 14 of 20
Table 2. The Pearson correlation coefficient (r) of the frequency of dust storms versus temperature,
precipitation and wind speed considering each Presidency of Meteorology and Environment (PME)
station from 2000 until 2016.
Stations Precipitation Temperature Wind Speed
Overall 0.490 0.236 0.686 **
Riyadh 0.529 ** 0.195 0.490
Jeddah 0.195 −0.548 ** 0.262
Hail 0.511 ** 0.066 0.751 **
Al-Qassem 0.298 0.128 0.748 **
Jizan 0.236 0.693 ** 0.546 **
Yanbu −0.696 ** 0.686 ** 0.842 **
Al-Jouf 0.257 −0.280 0.408
Bisha 0.740 ** 0.189 0.338
Turaif 0.276 −0.125 0.499 **
Hafr Al-Batin 0.104 0.018 0.799 **
Arar 0.314 0.094 0.322
Rafha 0.223 0.109 0.756 **
Najran 0.805 ** 0.140 0.173
Al Qurrayat 0.277 −0.110 −0.023
Sharurah 0.506 ** 0.317 0.705 **
Al-Ahsa 0.300 0.003 0.772 **
Wadi ad-Dawasir 0.894 ** 0.096 0.461
Al-Qaysumah −0.038 0.284 0.697 **
** p < 0.005.
4.4.2. The Relationship between Dust Storms and Precipitation
In general, the rainy season in Saudi Arabia runs from November to April, and the dry season is
primarily during the months of June to September [54]. The overall highest frequency of precipitation
events occurs in April (i.e., an average monthly number of rain cases of 20), which coincides with the
highest dust storm frequency. Moreover, our results illustrated that the peak in dust storms is clearly
related to the peak in frequency of precipitation events in the period March–May. There is notably less
precipitation in the period June–October, with an average of five rainfall occurrences per month, as
well as a lower frequency in dust storm events as compared to the antecedent wetter period. A second
peak in rainfall is situated in November, with an average frequency of 10 rainfall events per month,
which does not coincide with a higher frequency in dust storm events; however, it is important to note
that the average frequency of precipitation events for this particular month has greater variability.
Previous research highlighted a negative correlation between precipitation and dust
storms [55–57]. Furthermore, it was demonstrated that dust events tend to suppress rainfall [58,59].
Also, Middleton [60] claimed that the correlation between annual numbers of dust events and the
total annual amount of precipitation is weak. Nevertheless, our results showed a positive correlation
between dust storms and precipitation, because the occurrence of dust storms was mostly followed
by rainfall [61,62]. Moreover, Zender and Kwon [63] suggested that there is a significant positive
correlation between precipitation and the increase of dust emissions in the same month, especially in
Saudi Arabia, Oman, and the Thar Desert (in India) [64]. Yang et al. [65] also found that the relationship
of dust storm event occurrence with precipitation is stronger than with temperature. Moreover, it
is known that, in Central Asia, the seasonality of precipitation is strongly linked to intra-annual
variability in the frequency of dust storms [66].
Furthermore, the associated correlation coefficient between dust storm frequency and average
frequency of precipitation events was found to be positive and statistically significant at p < 0.005 in
Riyadh, Hail, Bisha, Najran, Sharurah, and Wadi ad-Dawasir (i.e., r = 0.53, 0.51, 0.74, 0.81, 0.51, and
0.89, respectively) (Table 1). In addition, in many stations, a second peak can be observed in November
with a figure approximately above 10 rainfall events per month (e.g., Riyadh, Hail, Al-Qassem, Arar,Geosciences 2019, 9, 162 15 of 20
Rafha, Jeddah, Rafha, and Hafr Al-Batin). However, the correlation between dust occurrence and
precipitation was negative and statistically significant at p < 0.005 in Yanbu, located along the western
coast of Saudi Arabia, with an r-value of −0.696. Hence, this result showed that there is an inverse
relationship between annual dust storms and the frequency of precipitation events in Yanbu, which
is a clear difference as compared to other regions. However, it should be noted that this station is
characterized by remarkably low precipitation throughout the year, with typically fewer than five
events per month (Figure 9).
4.4.3. The Relationship between Dust Storms and Wind Speed
As highlighted in Figure 8, the average wind speed remained fairly constant below 10 m/s across
all months with slightly higher values in the period March–July and slightly lower values in the period
October–December. However, despite this limited variation in wind speed, Table 2 illustrates that
there was a significant positive correlation (p < 0.005) between the frequency of dust events and wind
speed (i.e., r = 0.69), which is in accordance with other studies (e.g., [3,67]). Moreover, it can be seen
that the months with the highest frequency in dust storms, i.e., March–May accounted for more than
50% of the total annual number of dust storms, and they were characterized by both high wind speeds
and high precipitation amounts [38,60]. In contrast, the lower frequency of dust storm events in the
period November–January coincided with lower wind speeds [35]. The average wind speed remained
fairly steady between 6 and 8 knots across all months in Riyadh, Jeddah, Hail, Al-Qassem, Jizan, and
Al-Qaysumah, with slightly higher values between the period March–July and slightly lower values
between the period October–December. On the other hand, in some other regions, the variability in
average wind speed was larger, with monthly average values between 6 and 12 knots (e.g., Al Qurrayat
and Al-Ahsa) (Figure 9). We found a significant positive correlation (p < 0.005) in Hail, Al-Qassem,
Jizan, Yanbu, Turaif, Hafr Al-Batin, Rafha, Sharurah, Al-Ahsa, and Al-Qaysumah (r = 0.751, 0.748,
0.546, 0.842, 0.499, 0.799, 0.7051, 0.772, and 0.697, respectively) (Table 2).
Overall, the two meteorological variables of precipitation and wind speed were positively
correlated with the occurrence of dust storms. Moreover, we found no correlation between temperature
and dust events. However, the most surprising positive correlation was with the precipitation; few
studies were published on the relationship between dust events and precipitation, and they found that
dust storms are negatively correlated with precipitation, which means that dust storms are reduced
due to precipitation [55–57,59]. A possible explanation for this result is that our analysis was based
on the frequency of rainfall events, while other studies considered the amount of the precipitation. A
further explanation is that rainfall might be caused or followed by the dust storms.
4.5. Spatio-Temporal Variations in Wind Speed and Direction
In order to understand the spatial changes in dust storm frequency, we investigated wind speed
and direction at each in situ station for dust-free conditions and during dust storms (Figure 10). To
make this comparison across entire Saudi Arabia, we chose the following five main cities: Riyadh
representing the central region, Al-Ahsa representing the eastern region, Jeddah representing the
western region, Arar representing the northern region, and Jizan representing the northern region. It
can be seen that, while the prevailing wind direction in Riyadh is from the southwest regardless of the
conditions, the mean windspeed is between 5–10 m/s during dust-free days and 10–15 m/s during
dust storm events (Figure 10). In the eastern part of Saudi Arabia (i.e., Al-Ahsa), the prevailing winds
are from the north and the northwest with a mean speed of 10–15 m/s under dust-free conditions,
whereas, during dust storms, the wind directions are the same with a mean speed above 20 m/s. Hence,
the dust storms in this region are often linked to the Al Shamal wind, which has a predominately
north-to-northwest wind direction, transporting dust from the Tigris and Euphrates plain over Syria
and Iraq toward the northern and eastern part of the Arabian Peninsula [18,68–71]. However, Al Senafi
and Anis [72] concluded that dust storm events in the east of Saudi Arabia are not always associated
with the Al Shamal wind, but might also be a result of local unsettled weather systems. This mayGeosciences 2019, 9, 162 16 of 20
explain the high frequency of dust storm incidents in the eastern part of Saudi Arabia (Figure 5). In
addition, Figure 10 shows that, in Arar, the prevailing winds are from all directions with a mean speed
of 10–15 m/s and during both dust-free and dust storm conditions. This station is located on the
border with the Syrian Desert, which is one of the dust storm source areas in the north [38]. Finally, the
wind rose (Figure 10) revealed that the prevailing wind in Jeddah, located in the west, is from the north
with a mean wind speed of 15–20 m/s during dust storm conditions and 10–15 m/s during dust-free
conditions. The Sahara Desert can be considered as an important source area for the dust storms in the
western and northwestern part of Saudi Arabia. This also may apply to Jizan, which is located along
the southwestern coast of the Red Sea, and the prevailing wind is from the west during the dust storms
with a mean speed above 20 m/s, while, for the dust-free days, the mean wind speed is between
10–15 m/s. In addition, as Doronzo et al. [73] concluded that buildings have a significant impact on
dust storms with velocities between 10–20 m/s, an interesting future research avenue could be to
investigate the potential of residential areas to function as dust storm corridors across Saudi Arabia.
4.6. Large-Scale Trends and Drivers
The observed temporal trends might be a result of large-scale land-use change dynamics
within Saudi Arabia (e.g., urbanization and variability in vegetation coverage) [74,75], as well as
in neighboring military conflict areas, such as Syria and Iraq, where a widespread abandonment of
fields resulted in an enhanced dust erodibility of the soil [76]. As these regions are located on the most
important dust trajectories reaching the northeastern part of the Arabian Peninsula [77], it is likely to
result in a locally increased dust supply. Furthermore, climate change might also have an impact on the
frequency of dust storms, as drier and hotter conditions may reduce the overall vegetation coverage
and, therefore, intensify the desertification process [38,78]. This is particularly important, as recent
studies showed that long-term drought conditions linked to synoptic weather conditions (i.e., the
configuration of high-pressure and low-pressure systems) control dust storm activities over large areas
(e.g., [22,23,79]). This underlines the urgent need for future research investigating the spatio-temporal
trends of dust storms across the Arabian Peninsula taking into account large-scale influencing factors
such as land-use change and climate change.
5. Conclusions
Our analysis shows that dust storms in Saudi Arabia occur most frequently in the eastern and
northern regions of the country. These two regions are located near two major deserts in the study
area, Ad-Dahna desert in the east and An Nafud in the north. The analysis illustrated that the dust
storm frequency reached its maximum during the spring, whereas the lowest number of dust storms
events took place in autumn. As dust storms are positively correlated with precipitation and wind
speed p < 0.005, these two meteorological factors have an impact on the frequency of dust storms,
although there is a negative correlation between dust events and temperature. The most notable result
is that dust storms for the period 2000–2016 increased in the eastern part of the country, especially in
the area around Al-Ahsa by 13.87%. Moreover, there was also a constant increase in the frequency of
dust storms over time in Jeddah by 2.81%, which is located on the west coast. In contrast, dust storm
frequency decreased over time in Hail, Qaisumah, Hafar Al-Batin, Al-Qassim, and Bisha. Also, our
results showed a shift in dust storms from the northeast, possibly caused by the wind between the
high pressure over the Mediterranean Sea and the low pressure in Saudi Arabia [80] to the southeast.
The prevailing wind direction during dust-free and dust storm days varied across different parts of
the country. The mean wind speeds during a dust storm are between 15 and 20 m/s, while, during
non-dust days, they are around 10–15 m/s. Future research should seek to identify the drivers behind
the observed spatio-temporal trends in dust storm event occurrence across Saudi Arabia, and aim
to further explain the significant correlations with climatological factors such as the frequency of
precipitation events.Geosciences 2019, 9, 162 17 of 20
Author Contributions: S.P. and J.M. designed the research and revised this manuscript. S.A. analyzed the data
and wrote the manuscript. S.P., J.M., and J.C. provided comments and suggestions for the manuscript.
Funding: This research was funded by a Jeddah University Scholarship and the University of Exeter.
Acknowledgments: I would like to express my deepest appreciation to all those who provided me the possibility
to complete this paper. I am also grateful to the funding received through the Jeddah University Scholarship.
Conflicts of Interest: The authors declare no conflicts of interest.
References
1. Goudie, A.S.; Middleton, N.J. Saharan dust storms: Nature and consequences. Earth-Sci. Rev. 2001, 56,
179–204. [CrossRef]
2. Yang, Y.Q.; Hou, Q.; Zhou, C.H.; Liu, H.L.; Wang, Y.Q.; Niu, T. Sand/dust storm processes in Northeast Asia
and associated large-scale circulations. Atmos. Chem. Phys. 2008, 8, 25–33. [CrossRef]
3. Rezazadeh, M.; Irannejad, P.; Shao, Y. Climatology of the Middle East dust events. Aeolian Res. 2013, 10,
103–109. [CrossRef]
4. Knippertz, P.; Deutscher, C.; Kandler, K.; Müller, T.; Schulz, O.; Schütz, L. Dust mobilization due to density
currents in the Atlas region: Observations from the Saharan Mineral Dust Experiment 2006 field campaign.
J. Geophys. Res. 2007, 112. [CrossRef]
5. Miller, S.D.; Kuciauskas, A.P.; Liu, M.; Ji, Q.; Reid, J.S.; Breed, D.W.; Walker, A.L.; Mandoos, A.A. Haboob
dust storms of the southern Arabian Peninsula. J. Geophys. Res. Atmos. 2008, 113. [CrossRef]
6. Pye, K. Aeolian Dust and Dust Deposits; Elsevier, Academic Press: London, UK, 2015; p. 334.
7. Furman, H.K.H. Dust storms in the Middle East: Sources of origin and their temporal characteristics. Indoor
Built Environ. 2003, 12, 419–426. [CrossRef]
8. Washington, R.; Todd, M.; Middleton, N.J.; Goudie, A.S. Dust-storm source areas determined by the total
ozone monitoring spectrometer and surface observations. Ann. Assoc. Am. Geogr. 2003, 93, 297–313.
[CrossRef]
9. Barnum, B.H.; Winstead, N.S.; Wesely, J.; Hakola, A.; Colarco, P.R.; Toon, O.B.; Ginoux, P.; Brooks, G.;
Hasselbarth, L.; Toth, B. Forecasting dust storms using the CARMA-dust model and MM5 weather data.
Environ. Model. Softw. 2004, 19, 129–140. [CrossRef]
10. Prospero, J.M.; Bullard, J.E.; Hodgkins, R. High-latitude dust over the North Atlantic: Inputs from Icelandic
proglacial dust storms. Science 2012, 335, 1078–1082. [CrossRef]
11. Luo, C.; Mahowald, N.; Jones, C. Temporal variability of dust mobilization and concentration in source
regions. J. Geophys. Res. Atmos. 2004, 109. [CrossRef]
12. Al-Sanad, H.A.; Ismael, N.F.; Nayfeh, A.J. Geotechnical properties of dune sands in Kuwait. Eng. Geol. 1993,
34, 45–52. [CrossRef]
13. Edgell, H.S. Arabian Deserts: Nature, Origin and Evolution; Springer Science & Business Media: Dordrecht,
The Netherlands, 2006; pp. 201–238.
14. Al-Bassam, A.M.; Zaidi, F.K.; Hussein, M.T. Natural hazards in Saudi Arabia: Extreme Natural Events,
Disaster Risks and Societal Implications. In An Introduction to Signal Detection and Estimation; Poor, H., Ed.;
Springer: New York, NY, USA, 2014; Chapter 4; pp. 243–251.
15. Shepherd, G.; Terradellas, E.; Baklanov, A.; Kang, U.; Sprigg, W.; Nickovic, S.; Boloorani, A.D.; Al-Dousari, A.;
Basart, S.; Benedetti, A.; et al. Global Assessment of Sand and Dust Storms; United Nations Environment
Programme: Nairobi, Kenya, 2016.
16. Glennie, K.W.; Singhvi, A.K. Event stratigraphy, paleoenvironment and chronology of SE Arabian deserts.
Quat. Sci. Rev. 2002, 21, 853–869. [CrossRef]
17. Rao, P.G.; Hatwar, H.R.; Al-Sulaiti, M.H.; Al-Mulla, A.H. Summer shamals over the Arabian Gulf. Weather
2003, 58, 471–478. [CrossRef]
18. Bartlett, K.S. Dust Storm Forecasting for Al Udeid AB, Qatar: An Empirical Analysis. Master’s
Thesis, Department of Engineering Physics, Air Force Institute of Technology, Air University, Islamabad,
Pakistan, 2004.
19. Babikir, A.A.A. Some aspects of climate and economic activities in the Arab Gulf States. GeoJournal 1986, 13,
211–222. [CrossRef]Geosciences 2019, 9, 162 18 of 20
20. Rashki, A.; Kaskaoutis, D.G.; Sepehr, A. Statistical evaluation of the dust events at selected stations in
Southwest Asia: From the Caspian Sea to the Arabian Sea. Catena 2018, 165, 590–603. [CrossRef]
21. Orlovsky, L.; Orlovsky, N.; Durdyev, A. Dust storms in Turkmenistan. J. Arid Environ. 2005, 60, 83–97.
[CrossRef]
22. Awad, A.M.; Mashat, A.W.S. Synoptic characteristics of spring dust days over northern Saudi Arabia.
Air Qual. Atmos. Health 2016, 9, 41–50. [CrossRef]
23. Mashat, A.W.S.; Alamoudi, A.O.; Awad, A.M.; Assiri, M.E. Seasonal variability and synoptic characteristics
of dust cases over southwestern Saudi Arabia. Int. J. Climatol. 2018, 38, 105–124. [CrossRef]
24. Rashki, A.; Arjmand, M.; Kaskaoutis, D.G. Assessment of dust activity and dust-plume pathways over
Jazmurian Basin, southeast Iran. Aeolian Res. 2017, 24, 145–160. [CrossRef]
25. Rashki, A.; Kaskaoutis, D.G.; Mofidi, A.; Minvielle, F.; Chiapello, I.; Legrand, M.; Dumka, U.C.; Francois, P.
Effects of Monsoon, Shamal and Levar winds on dust accumulation over the Arabian Sea during
summer—The July 2016 case. Aeolian Res. 2019, 36, 27–44. [CrossRef]
26. Goudie, A.S.; Middleton, N.J. The changing frequency of dust storms through time. Clim. Chang. 1992, 20,
197–225. [CrossRef]
27. Goudie, A.S. Dust storms: Recent developments. J. Environ. Manag. 2009, 90, 89–94. [CrossRef]
28. Bastan, M.; Abdollahi, F.; Shokoufi, K. Analysis of Iran’s dust emission with system dynamics methodology.
Tech. J. Eng. Appl. Sci. 2013, 3, 3515–3524.
29. Pirsaheb, M.; Zinatizadeh, A.; Khosravi, T.; Atafar, Z.; Dezfulinezhad, S. Natural Airborne Dust and Heavy
Metals: A Case Study for Kermanshah, Western Iran (2005–2011). Iran. J. Public Health 2014, 43, 460.
30. Cao, H.; Amiraslani, F.; Liu, J.; Zhou, N. Identification of dust storm source areas in West Asia using multiple
environmental datasets. Sci. Total Environ. 2015, 502, 224–235. [CrossRef]
31. Notaro, M.; Yu, Y.; Kalashnikova, O.V. Regime shift in Arabian dust activity, triggered by persistent Fertile
Crescent drought. J. Geophys. Res. Atmos. 2015, 120. [CrossRef]
32. Mohammad, M.S.A. Dust Storm Phenomena and Their Environmental Impacts in Kuwait. Ph.D. Thesis,
University of Glasgow, Glasgow, UK, 1989.
33. Zhang, X.Y.; Gong, S.L.; Zhao, T.L.; Arimoto, R.; Wang, Y.Q.; Zhou, Z.J. Sources of Asian dust and role of
climate change versus desertification in Asian dust emission. Geophys. Res. Lett. 2003, 30. [CrossRef]
34. Akbary, M.; Farahbakhshi, M. Analyzing and Tracing of Dust Hazard in Recent Years in Kermanshah
Province. Int. J. Environ. Res. 2015, 9, 673–682.
35. Notaro, M.; Alkolibi, F.; Fadda, E.; Bakhrjy, F. Trajectory analysis of Saudi Arabian dust storms. J. Geophys.
Res. Atmos. 2013, 118, 6028–6043. [CrossRef]
36. Yu, Y.; Notaro, M.; Liu, Z.; Kalashnikova, O.; Alkolibi, F.; Fadda, E.; Bakhrjy, F. Assessing temporal and
spatial variations in atmospheric dust over Saudi Arabia through satellite, radiometric, and station data.
J. Geophys. Res. Atmos. 2013, 118. [CrossRef]
37. Albugami, S.; Palmer, S.; Meersmans, J.; Waine, T. Evaluating MODIS Dust-Detection Indices over the
Arabian Peninsula. Remote Sens. 2018, 10, 1993. [CrossRef]
38. Yu, Y.; Notaro, M.; Liu, Z.; Wang, F.; Alkolibi, F.; Fadda, E.; Bakhrjy, F. Climatic controls on the interannual to
decadal variability in Saudi Arabian dust activity: Toward the development of a seasonal dust prediction
model. J. Geophys. Res. Atmos. 2015, 120, 1739–1758. [CrossRef]
39. Zahran, M.A. Introduction to Plant Ecology and Vegetation Types of Saudi Arabia; King Abdul Aziz University
Press: Jeddah, Saudi Arabia, 1983.
40. Alaamer, A.S. Measurement of natural radioactivity in sand samples collected from Ad-Dahna desert in
Saudi Arabia. World J. Nuclear Sci. Technol. 2012, 2, 187. [CrossRef]
41. Puthan Purakkal, J.; Kalenderski, S.; Stenchikov, G.L. Simulation of the Radiative Impact of High Dust
Loading during a Dust Storm in March 2012. In AGU Fall Meeting Abstracts; American Geophysical Union:
Washington, DC, USA, 2013.
42. De Pauw, E. An Agroecological Exploration of the Arabian Peninsula; ICARDA: Aleppo, Syria, 2002.
43. Kamel, M.; Böer, B.; Michael, C.; Brook, Z.A.; Clüsener-Godt, M.; Wadid, S. Policy Perspectives for Ecosystem
and Water Management in the Arabia Peninsula; UNESCO, Doha & United Nations University: Hamilton, ON,
USA, 2006; Chapter 1; pp. 1–16.
44. Goyal, M.R.; Harmsen, E.W. (Eds.) Evapotranspiration: Principles and Applications for Water Management; CRC
Press: Boca Raton, FL, USA, 2013.You can also read


