THE 1999 SYDNEY HAILSTORM: 10-YEAR RETROSPECTIVE - RMS Special Report
←
→
Page content transcription
If your browser does not render page correctly, please read the page content below
THE 1999 SYDNEY HAILSTORM:
10-YEAR RETROSPECTIVE
RMS Special Report
INTRODUCTION
On April 14, 1999, a supercell thunderstorm developed south of the New South Wales (NSW) capital city of
Sydney, Australia. As the storm moved through the densely populated eastern part of the city, lightning, high
winds, heavy rain, and large hailstones were observed. According to Emergency Management Australia (EMA),
the winds, rains, and in particular, the large hail associated with storm damaged 24,000 homes and 70,000
automobiles along its path (EMA, 2007; Figure 1). At the time of the 1999 Sydney Hail storm, the insured loss
totaled AUD$1.7 billion (US$1.04 billion), and this cost remains the largest absolute insured loss in Australian
history (Insurance Council of Australia, 2009). If one considers population, inflation, and wealth adjustments, it
still ranks third behind 1989’s Newcastle Earthquake and 1974’s Cyclone Tracy (Crompton and McAneney,
2006). The hailstorm affected an approximate 130,000 individuals and caused one death, when a fisherman’s
boat was struck by lightning.
The event was remarkable in a number of ways, including the timing of its occurrence, the track of the storm,
and the size of the hailstones. Occurring in mid-April, outside the conventional hail season lasting from
September to March, the 1999 storm also occurred late in the day, hitting the Sydney area just before 8 p.m.
local time. This is an unusual time to strike, as hailstorms most commonly occur in the late afternoon between
2:00 pm and 6:00 pm due to atmospheric conditions (Schuster et al., 2005a). The storm dropped the largest
hailstones ever recorded in the region, described as the size of ―grapefruit,‖ ―melons,‖ or ―cricket balls‖, with
the largest official hailstone measuring 9 cm (3.5 in).
Ten years later, Risk Management Solutions (RMS) revisits the 1999 Sydney Hailstorm, investigating the storm’s
origins, its development over the region, and the resulting damage and property loss. The report discusses the
vulnerability of Australia’s building stock to hail damage, as well as the recurrence probability of similar-sized
events in the future. Finally, the impacts of the 1999 storm on risk modeling and management are highlighted.
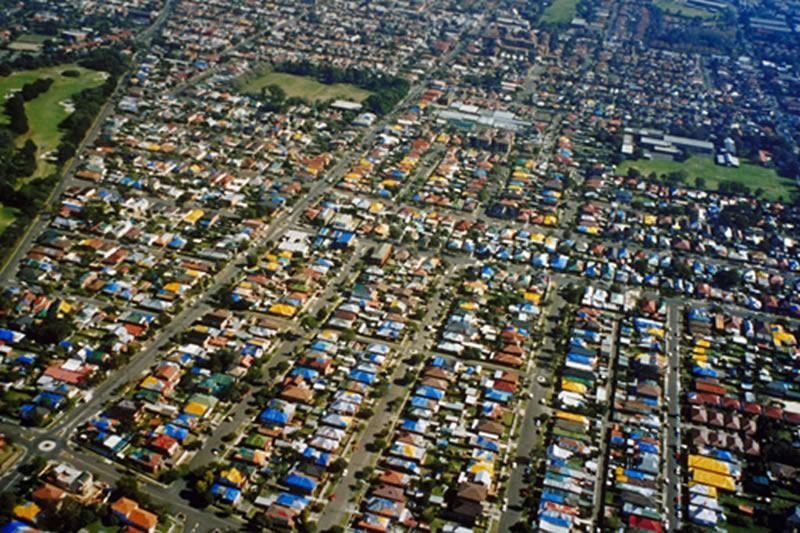
Figure 1: Blue covers on roofs damaged by hail during the 1999 Sydney Hailstorm (Source:
Emergency Management Australia)
© 2009 Risk Management Solutions, Inc. 1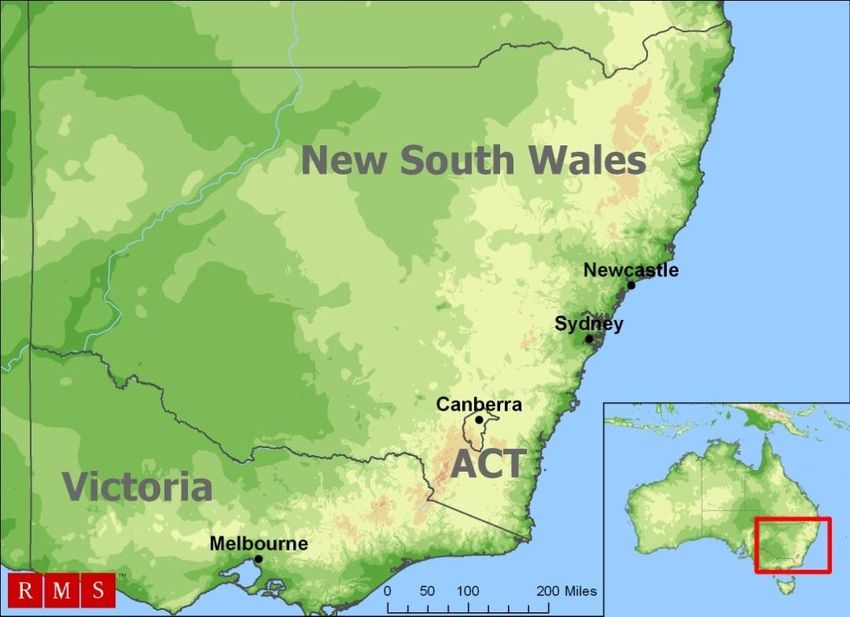
SEVERE CONVECTIVE STORM RISK IN AUSTRALIA

Severe convective storms are a common occurrence in Australia and can produce damage from large hailstones,
straight-line wind gusts, lighting strikes, flash floods, and tornadoes. Convective out breaks can range from the
local development of a single thunderstorm to large multi-day, multi-state events that can cause billions of
dollars in insured losses. The Australian Bureau of Meteorology (BoM) defines a severe convective storm as a
thunderstorm which produces any of the following: hailstones greater than or equal to 2 cm (0.8 in) in
diameter; wind gusts equal to or greater than 90 km/hr (56 mph); flash flooding; or one or more tornadoes.
While there are thousands of thunderstorms each year, only 10% are classified as severe. Furthermore these
severe thunderstorms are responsible for 90% of the convective storm damage to people and property in
Australia (Bureau of Meteorology, 2009a).

As the different convective storm perils (i.e., hail, wind, flood, lightning, and tornado) vary considerably, the
type and scope of damage in each individual event varies as well. For instance, the January 21, 1991 storm that
impacted Sydney was predominantly a straight-line wind event, while the 1990 and 1999 events were
dominated by hail.

Large hailstones, defined as 2 cm (0.8 in) in diameter or greater, are common in the state of New South Wales
(NSW) and the Australian Capital Territory (ACT) located within the boundaries of NSW (Figure 2). From 1990 –
2003, an average of 45 reports of large hailstones were reported each year across the districts within NSW —
with the largest confirmed hailstone reported in 1991 in the district of Northern Rivers and measuring 14 cm
(5.5 in). According to Schuster and others (2005a), from 1968 to 2005, the damage from hailstorms (i.e., hail
producing severe convective storms) was responsible for over one -third of total insured loss from all natural
hazards across Australia, which includes bushfire, cyclone, earthquake, flood, landslide , severe weather,
tsunami and volcano. Moreover, 75% of these insured losses occurred in the state of NSW.

                Figure 2: Location map of the state of New South Wales (NSW) and the Australian Capital
                Territory (ACT) in Australia

                                               © 2009 Risk Management Solutions, Inc.                           2
Comparison to U.S. Severe Convective Storm Risk
While the perils associated with severe convective storms in Australia and the United States are the same —hail,
tornado, flash flood, lightning, and straight-line winds—there are some marked differences in the risk from the
various perils.

Straight-line winds in the U.S. and Australia are caused by downbursts from individual storm cells. However, in
the U.S., bands of thunderstorms can become organized to produce large -scale, long-lived, straight-line
windstorms, called derechos. In contrast, no derechos have ever been reported in Australia.

While Australia does experience tornadoes, it is rare that there is a tornado event on the scale of outbreaks in
the U.S., such as the ―Super Tuesday‖ outbreak of February 5 –6, 2008 in the Southeast U.S. (For more
information, see Risk Management Solutions, 2009). According to the U.S. National Oceanic and Atmospheric
Administration (NOAA), 75% of worldwide tornadoes occur in the U.S. In Tornado Alley 1 of the U.S., 42% of the
average 40 tornadoes per year (for every 100,000 km 2 or 38,600 mi 2 ) reach F2 strength or higher on the Fujita
Scale 2. Australia experiences, on average, 8 tornadoes per year for every 100,000 km 2 , with approximately 20%
to 30% of these tornadoes reaching F2 strength or above on the Fujita Scale (Geerts and Linacre, 1998).

Hail climatology varies enormously across the U.S., as evidenced by research compiled at NOAA’s National
Severe Storm Laboratory (NSSL) (Brooks, 2009). Therefore, a straightforward comparison between hail risk in
the U.S. and Australia cannot be made. Moreover, historical hail data sets suffer from biases toward populated
areas and biases in reported hail sizes, due to comparisons with common objects, such as coins (Schuster et
al., 2005b) that vary from country to country.

A simple analysis of the Australian Bureau of Meteorology (BoM) severe storm database against the NSSL
research indicates that the frequency of large hail (≥ 2 cm or 0.8 in diameter) and the frequency of giant hail
(≥ 5 cm or 2 in diameter) in the Sydney region, in the lee of the Great Dividing Range, is comparable to that of
Hail Alley, located in the lee of the Rocky Mountains of the U.S., where the states of Colorado, Wyoming, and
Nebraska meet. In addition, Sydney's hail activity is comparable to that of Kansas, but not as frequent as hail
events occurring in Oklahoma and northern Texas.

1
  Tornado Alley is the general area of the Central U.S. between the Rocky Mountains and Appalachian Mountains; in this reference, the
states of Oklahoma and Kansas are considered within the 100,000 km 2.
2
  The Fujita Scale or Fujita-Pearson Scale, first developed by Ted Fujita and Allen Pearson in the early 1970s, measures the strength of
a tornado based on the damage it causes. Notably, the Enhanced Fujita (EF) Scale was implemented in the U.S. in 2007 to replace the
Fujita Scale.

                                                        © 2009 Risk Management Solutions, Inc.                                        3
THE 1999 SYDNEY HAILSTORM

Development and Characterization of the Storm
There are three basic meteorological conditions needed to develop and sustain a severe convective storm:
instability, a trigger, and wind shear. First and foremost is instability —warm, moist air near the Earth’s surface
trapped beneath cooler, dryer air at higher levels by an inversion. For the storm to develop, however, a trigger
such as a front, a sea breeze or flow over a mountain range is needed to provide localized lifting strong enough
to carry surface air above the inversion. Once this happens, free convection can produce storm clouds with tops
10 to 15 km (6.2 to 9.3 mi) or higher. Finally, wind shear is needed to organize the updrafts and downdrafts to
prevent the storm from collapsing onto itself. When conditions are favorable, many individual storm cells can
form.

Several storm cells formed on April 14, 1999. The strongest of these was classified as a ―high precipitation
supercell‖ by the Australian Bureau of Meteorology (BoM). Supercell thunderstorms are characteristically quite
different from other types of thunderstorms; they are the largest, longest-lasting type of thunderstorms, which
are capable of producing very large hailstones. The 1999 Sydney Hailstorm lasted over 5 hours, traveling over
160 km (100 mi) from Berry to the east of Gosford in New South Wale s. The storm dropped an estimated
500,000 tons of hailstones (Steingold and Walker, 1999), with measurements as large as 9 cm (3.5 in) in
diameter in Sydney’s eastern suburbs (Figure 3), the largest ever recorded in the Sydney area. Reports of
hailstones up to 13 cm (5.1 in) in diameter were reported, though unconfirmed. Giant hailstones (≥ 5 cm in
diameter) were reported as far south as Port Hacking and as far north as McMasters Beach. At its widest point,
the hail swath producing giant hail was 7 km (4.3 mi) wide, and was at least 28 km (17.4 mi) long. The hail
swath dropping large hailstones (≥ 2 cm in diameter) was 10 km (6.2 mi) wide at its broadest point and at
least 58 km (36 mi) in length. While the storm was primarily a hail event, it also brought w ith it strong winds
and rain.

                  Figure 3: Hailstones from the 1999 Sydney Hailstorm, alongside a tennis ball, illustrating the large
                  size of the hailstones (Source: Australian Science and Technology Heritage Centre)

Synopsis of the Storm 3
The storm developed around 4:25 p.m. local time on April 14, 1999, over land near Berry, approximately 115
km (71.5 mi) south-southwest of Sydney. Following the steering winds, the storm tracked northeast (NE )

3
 This synopsis is derived from the Australian Bureau of Meteorology’s report on their forecasting and warning performance during the
1999 Sydney Hailstorm (Bureau of Meteorology, 2009b).

                                                      © 2009 Risk Management Solutions, Inc.                                       4
toward the coast. Approximately 50 minutes later, at 5:05 p.m., the storm matured into a severe thunderstorm
as it tracked just west of Kiama, traveling at 26 km/hr (16 mph) and dropping significant amounts of hail. Ten
minutes later, at approximately 5:25 p.m., the storm reached the NSW coast, gaining speed as it moved farther
from the coast. The storm was expected to continue tracking northeast out to sea, where it was forecast to
dissipate.

However, at 5:45 p.m., the storm, which was still largely offshore, changed direction to a north -northeast
(NNE) track, re-intensifying as it tracked parallel to the coast. The storm’s western edge reached Wollongong
around 6:05 p.m. as a severe thunderstorm. The storm then tracked parallel to the coast in a NNE direction for
the next 70 minutes, until the storm’s center neared land again around 7:15 p.m. just to the east of Bundeena,
traveling at a speed of 37 km/hr (23 mph). Over the next hour and thirty minutes, the severe thunderstorm
tracked across the coastal and eastern suburbs of Sydney, tracking east of the Sydney Airport around 7:45 p.m.
(Figure 4), weakening briefly after crossing the Sydney Harbour and shifted to track due north. The storm re -
intensified just south of Mona Vale around 8:35 p.m., changing back to its more prominent direction of NNE.

Finally, the storm started to move offshore around 9:05 p.m. as it passed to the east of Pittwater, weakening
as it moved over the water. The storm continued to weaken as it traveled along a NE track farther out to sea.
At 9:55 p.m. local time, the storm began to collapse and had dissipated by 10:00 p.m.

The first storm cell was followed by a second system, which developed in a similar location. This system tracked
northeast—a path slightly to the east of the first storm. This storm was significantly weaker than the first,
never reaching severe classification or acquiring supercell characteristics like its predecessor.

Rainfall
Analysis of the rainfall that fell over Sydney on the evening of April 14, 1999, shows three distinct heavy rainfall
events. The rainfall associated with the first, supercell storm, between 7:30 p.m. and 9:00 p.m., was relatively
light as the storm entered the Sydney metropolitan area, with 1.5 cm (0.6 in) of rain in 20 minutes at
Caringbah, NSW, south of Sydney. The rainfall intensified as it crossed the city, dropping 3 .9 cm (1.5 in) in 20
minutes by the time the storm reached Warriewood to the north. The heaviest rainfall, which occurred just after
9:30 p.m., was associated with the second storm system; the reported flash flooding in Bondi, a suburb of
Sydney along the coastline, was likely due to this second storm. L astly, the third and smallest rainfall event was
from less intense storms which moved across Sydney just before midnight.

                                                © 2009 Risk Management Solutions, Inc.                             5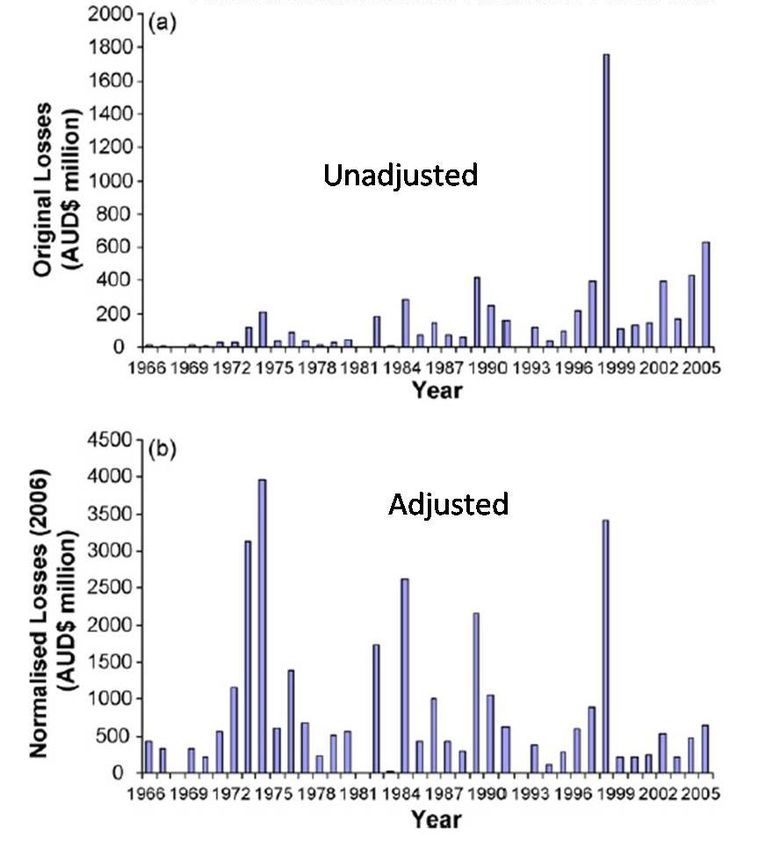
Figure 4: Track of the 1999 Sydney Hailstorm, derived from radar data; location, speed, and
               direction of the storm are shown at 10-minute intervals, starting at 4:45 p.m. and ending at 9:55
               p.m. local time on April 14, 1999 (Source: Bureau of Meteorology, 2009b)

Unique Characteristics of the 1999 Sydney Hailstorm
While it is possible for severe convective storms in New South Wales to occur at any time of year, the required
meteorological conditions and favorable weather patterns for severe convective storm development occur more
frequently in the warmer spring and summer months. An analysis of severe thunderstorm days in New South
Wales from 1989 to 2006 illustrates this seasonality, showing a tendency for severe thunderstorms to occur
during the months September through to March (Figure 5(a)). There is also a tendency for severe
thunderstorms to occur in the afternoon, when the daily heating of the Earth’s surface by the sun is at a
maximum (Figure 5(b)).

                                                 © 2009 Risk Management Solutions, Inc.                            6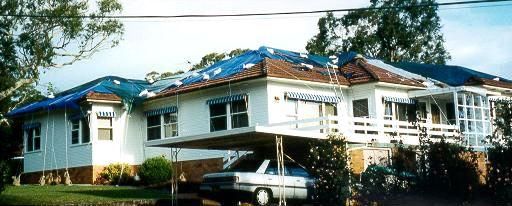
(a)                                                       (b)

               Figure 5: Distribution of severe convective storms in NSW: (a) on a monthly basis (i.e., average
               storm days per month) and (b) on an hourly basis (i.e., as a proportion of all records). Note that
               the spike at midnight is associated with a default for an uncertain, overnight time in the BoM
               severe storm database.

The 1999 Sydney Hailstorm was a highly unusual—though not unprecedented—severe storm, occurring outside
the typical time of year (April) and time of day (4:25 p.m. to 10:00 p.m.). The 1999 storm was only the fifth
recorded hailstorm to hit Sydney during April over the past 200 years with hail larger than 2 cm (0.8 in) in
diameter. Moreover, the atmospheric conditions present early on April 14, 1999 gave few clues as to what was
to happen later in the day. While conditions could not be considered unfavorable for storm development, they
were not so favorable as to warrant major concern. As a result, the Sydney Regional Forecasting Centre (RFC)
of the Australian BoM did not issue Severe Weather Warnings during the development of the storm (Bureau of
Meteorology, 2009b).

The track the storm followed was also rather unusual. Most severe storms in the Sydney region track in a
roughly west-to-east direction. The 1999 storm tracked predominantly south-to-north, as evidenced by the hail
footprint.

                                                 © 2009 Risk Management Solutions, Inc.                             7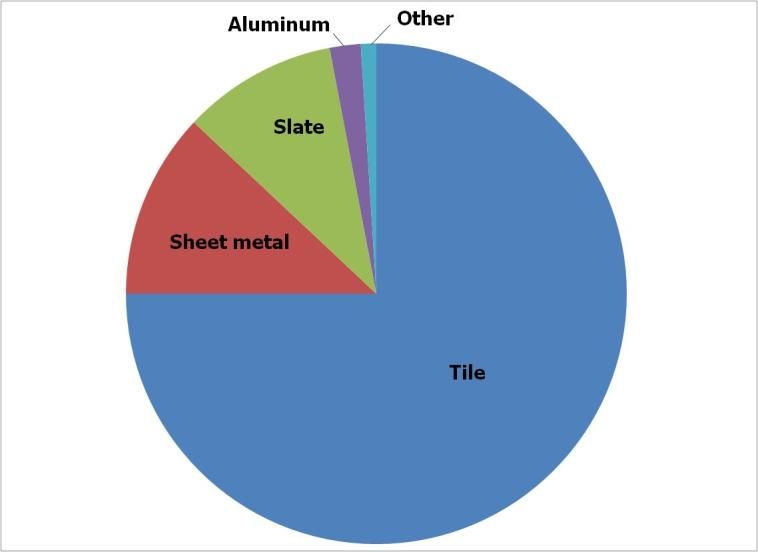
DAMAGE AND LOSS FROM THE 1999 SYDNEY HAILSTORM
The 1999 Sydney Hailstorm resulted in an estimated AUD$2.2 billion in damage ( EMA, 1999; in 1999 dollars),
making it Australia’s most costly severe convective storm to date. With insured losses reaching AUD$1.7 billion,
it is additionally the largest absolute insured loss in Australian history.
According to Emergency Management Australia (EMA), 130,000 people were affected by the 1999 Sydney
Hailstorm, with 500 left homeless (EMA, 2007). A total of 50 people were injured and th ere was one fatality,
which was attributed to lightning. Approximately 24,000 homes, 70,000 vehicles , and 2,800 commercial and
industrial buildings were damaged by the storm, with over 90% of the damaged homes and vehicles insured.
Additionally, 23 aircraft and several hangers at Sydney Airport were damaged due to the storm, resulting in
severe air transport delays. At the peak of disruption, approximately 15,000 homes were without power along
the Sydney coast from Engadine to Narrabeen, NSW.
Drivers of Damage
The severe convective storms of April 14, 1999, produced giant hail, strong winds and rain. One of the main
reasons the 1999 Sydney Hailstorm caused so much property damage is the high concentration of exposure
affected by the storm. Sydney, the state capital of New South Wales, is the most populous city in Australia.
According to the Australian Bureau of Statistics, the 2007 metropolitan area population (the latest figure
available) was approximately 4.3 million people. In 1999, at the time of the even t, the population was
approximately 4 million people. The area principally affected by the storm has a mixture of commercial,
industrial, and residential properties. The commercial and industrial facilities were highly concentrated toward
the inland side of the hail swath, and older, relatively affluent housing was concentrated toward the coast. The
roofs on these residential structures were predominantly terra -cotta tiles, which are easily damaged by large
hailstones. As a result, many of these buildings suffered serious damage to their roofs, and subsequent rain
damage to the building interiors and contents. Similarly, many of the industrial buildings had asbestos fiber
cement roofs, which also perform poorly under the impact of large hail (Steingold and Walker, 1999).
However, the impact from the storm could have been significantly worse. The storm’s path tracked over several
large open areas, such as parks, golf courses, and a race course, resulting in gaps between areas with major
damage. Had the storm tracked a few kilometers to the east or west, the resulting damages would have been
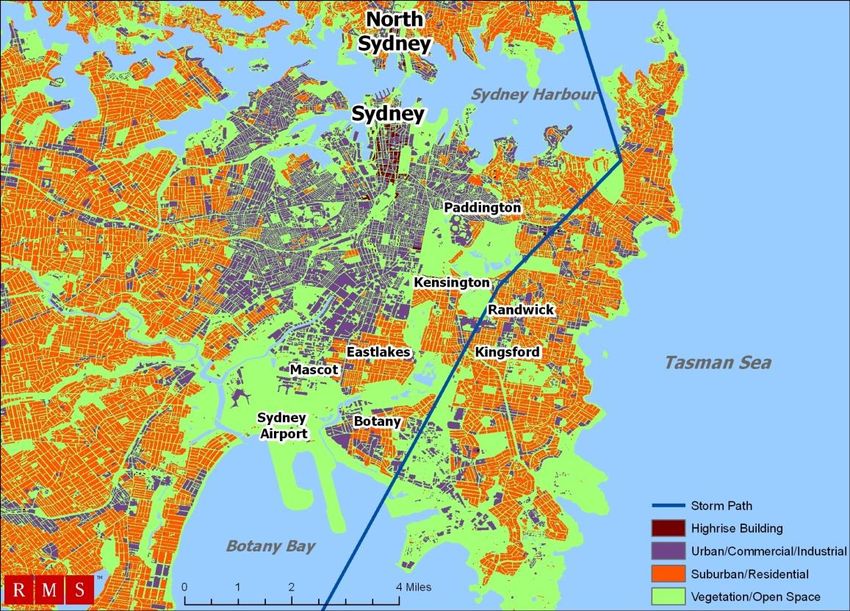
far greater, with many more impacted properties (Figure 6). Moreover, if the 1999 storm had struck earlier in
the afternoon, more injuries could have potentially occurred, as happened during the 1947 Sydney Hailstorm on
New Year’s Day. On New Year’s Day 1947, large hail from the storm caused hundreds of injuries at Bondi Beach
from hailstone impacts and flying debris, particularly broken glass, hospitalizing many individuals who were
enjoying the holiday (Whitaker, 2005).
© 2009 Risk Management Solutions, Inc. 8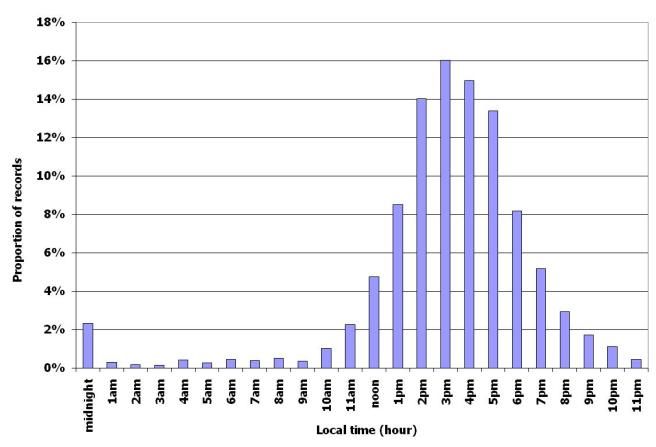
C BD

               Figure 6: Map illustrating the concentration of exposure in Sydney and the worst-affected
               suburbs, with the path of the 1999 Sydney Hailstorm highlighted

Property Damage
Major hail damage to buildings and vehicles was experienced in 85 Sydney suburbs. The areas experiencing
severe hail extended from the Sydney Airport to the central business district (CBD). The worst affected regions
included the southeastern and eastern suburbs of Kensington, Eastlakes, Kingsford, Botany, Mascot, Randwick,
and Paddington (Figure 6). The Eastlakes and Kensington areas experienced the heaviest concentration of
damage, with some streets experiencing damage to every home.

The hail from the 1999 event broke roof tiles, skylights, and solar panels, as well as damaging antennas and
gutters. Windows were also broken by hailstones, and some external walls were dented. Many houses suffered
water damage, as rain poured through the holes in the roofing caused by the hail, causing damage to the
homes’ interiors, saturating carpets and walls, and destroying the contents. Some ceilings completely collapsed
under the weight of the broken tiles and water-saturated insulation. Much of the water damage to homes was
due to the second, smaller storm which passed over Sydney two hours after the main event, as this storm was
primarily a heavy rainfall event.

Many vehicles suffered broken windshields and dents to the bodywork (Figure 7), and several motorists became
trapped by floodwaters.

                                              © 2009 Risk Management Solutions, Inc.                          9
Figure 7: Damage to a car roof as a result of the 1999 Sydney Hailstorm (Source:
http://ozthunder.com/chase/chase13.htm)
It took up to 2 weeks to cover every damaged roof with tarpaulins to protect the buildings from the elements
(Figure 8 and Figure 1). However, further damage was experienced in the subsequent weeks as more strong
winds and heavy rains tore away the tarpaulins, allowing more water into the buildings. Many tarpaulins had to
be refitted each time they were blown loose by strong winds, multiplying the workload of the emergency
responders.
Figure 8: Tarpaulins covering the roof of a residential structure in the eastern suburbs of Sydney
following the 1999 Sydney Hailstorm (Source: http://willoughby.ses.nsw.gov.au/Hail.html)
Insured Loss
Approximately 60% of the AUD$1.7 billion insured loss was paid out for damage to residential, commerc ial, and
industrial properties, with an additional 29% for damage to motor vehicles. The 23 aircraft that were damaged
at the Sydney Airport as a result of the storm accounted for close to $100 million dollars of damage, or another
6% of the total insured payout. The remaining insurance payments were losses due to business interruption
(Schuster et al, 2005a).
Full recovery from the storm took many months and in some cases years, due to delays with insurance claims
and rebuilding efforts. According the Emergency Management Australia (EMA, 2007), the extraordinary amount
of roofing materials needed to repair the damaged properties led to a shortage of supplies as well as skilled
tradesman, leaving thousands of homes protected from the elements only by tarpaulins. Terra-cotta tile roofs
accounted for over 70% of roofs in need of repair after the storm. The stockpiles of terra -cotta tiles maintained
© 2009 Risk Management Solutions, Inc. 10by the major suppliers were quickly exhausted, leading to severe delays in repairs as new tiles were produced
or imported from elsewhere. Similarly, an abnormally large quantity of slate tiles were needed to repair the
damaged slate roofs, which had to be sourced and then imported from overseas, primarily from Wales, again
leading to long lead times on roof repairs (Henri, 2000).
© 2009 Risk Management Solutions, Inc. 11THE 1999 SYDNEY HAILSTORM IN PERSPECTIVE
For the 10 th anniversary of the 1999 Sydney Hailstorm, RMS worked with Professor Alan Jeary of the School of
Engineering of University of Western Sydney 4 to investigate the vulnerability of the roofing of Sydney’s building
stock to future hail damage, based on the existing Australian building design code, construction practices, and
roofing materials. In addition, the probability of such a future event is explored in the context of climate
change and increased knowledge of storm generation and impacts over the past 10 years.
Susceptibility of Roofing Material to Hail Damage
Size, density, kinetic energy, and the number of stones per unit area have all been used for a possible
correlation with damage to roofing elements. The ambient air temperature at the time of impact has also been
identified as having a small modifying effect. However, Changdon (1977) established that the diameter of a hail
stone is a better predictor of probable damage than any other parameter, and this has therefore been used as
the prime predictor of damage to roofs.
The parts of a building most susceptible to damage from hailstones are, not unexpectedly, those parts facing
the sky. Hailstones are not moved significantly in a horizontal direction ( TORRO, 2006), and so windows on the
sides of houses are less affected by hailstones, whereas roofs, skylights, antennas, and coverings incur the
most damage. Of course, other flying debris during a storm can cause damage to windows and walls, as seen
during the 1999 Sydney Hailstorm. TORRO—the TORnado and storm Research Organisation—also reported that
smaller hailstones have been observed to affect glazing on side walls, but that there are no r eports of damage
associated with this mechanism.
TORRO’s work (2006) in the U.K. has been correlated with work performed in Australia by SGIO, a subsidiary of
Insurance Australia Group (IAG) (SGIO, 2004), to produce Table 1. This table suggests that the threshold for
significant damage to the predominant roof types in Sydney are hailstones that are in the region of 5 cm (1.9
in) in diameter. At or above this level, tiled roofs can be broken, and as a result, the weather-tightness of the
roofing system is compromised.
Currently available information also suggests that, irrespective of the materials used for roof construction, once
the roof tiles are cracked, water penetration will result, even when sarking (i.e., a flexible membrane installed
under the tile battens) is present. Stronger (or more resistant) sarking is available, but is not currently
commonly used, and no research has yet been conducted to show whether this extra resistance would alter the
risk.
4
Professor Alan Jeary is consulting with Risk Management Solutions as part of its developmen t of the RMS® Australia Severe
Convective Storm Model, scheduled for future release.
© 2009 Risk Management Solutions, Inc. 12Table 1. Effects of hail of different size diameters on roof building materials
Hail Diameter Damage (TORRO, 2006) Damage (SGIO, 2004)
(cm)
0–1.5 Slight crop damage —
1.5–2.0 Significant crop damage —
2.0–3.0 Glass and plastic damaged —
3.0–4.0 Vehicle and widespread glass and Glass and plastic roofing broken
plastic roofing broken
4.0–5.0 Tiled roofs damaged, slate broken Old slate 100+ years old, Old tiles
50+ years old, cracked
5.0–6.0 Tiled roofs broken, metal roofs dented Old slate tiles broken, new tiles crack
6.0–7.5 Severe roof damage, tiles broken, slate New concrete tiles and terra-cotta tiles
shattered break
7.5–8.5 Severe damage to aircraft bodywork, Sheet metal dented – all other roofing
tiles shattered, slate destroyed broken
8.5–9.0 Severe damage to aircraft bodywork, Sheet metal dented – all other roofing
tiles shattered, slate destroyed smashed
>9.0 Extensive structural damage & sheet Sheer metal roofing penetrated/
metal penetrated cracked
During the 1999 Sydney Hailstorm, 70% of damaged roofs were constructed of terra-cotta tiles, with another
5% constructed of slate tiles and the remainder constructed with other types of roofing materials (e.g.,
concrete tiles, metal roofs). At the time of the storm, the majority of damaged homes were built before the
1930s with the predominant roofing material being terra-cotta tiles. Since this time, the majority of residential
structures in NSW have continued to be built with terra-cotta roofing tiles (Housing Industry Australia, 2006).
As illustrated in Figure 9, approximately 75% of new homes in 2006 were constructed with tiled roofs, with an
additional 12% of the roofs constructed using sheet metal and 10% of roofing using slate tile.
As the materials damaged in 1999 are the same as the ones being used to build homes in NSW today, the
damage patterns in future events will be the same as those seen in the past.
© 2009 Risk Management Solutions, Inc. 13Figure 9: Distribution of roof type for new construction in New South Wales, based on 2006 data
(Source: Housing Industry Australia, 2006)
Recurrence of Hailstone by Diameter Size
The Australian Bureau of Meteorology (BoM) collects data on severe storms in NSW, including maximum hail
size. Although the database’s first hail entry is 1795, the early part of the record is far from complete. It is only
since the introduction of BoM’s network of storm spotters in 1989 that the database’s consistency has
stabilized. The short reliable record makes it difficult to discuss return periods of extreme events. Therefore, a
rigorous statistical analysis of the recurrence of hailstones by diameter size is not attempted here. Instead,
some simple observations are noted.
In the Sydney metropolitan weather forecast district, storm days with maximum recorded hail 4 cm (1.6 in) in
diameter or larger have occurred, on average, more than once per year since 1989. Storm days with hail 6 cm
(2.4 in) in diameter or larger have occurred on average every two years and storm days with hail 8 cm (3.15 in)
in diameter or larger have occurred, somewhere in the Sydney Metropolitan district , every 5 to 10 years.
The massive 9 cm (3.5 in) hailstones recorded during the 1999 Sydney Hailstorm, therefore, cannot be
considered a ―once-in-a-lifetime‖ occurrence. Indeed, reports from the 1947 Sydney Hailstorm on New Year’s
Day suggest hailstones of this size fell in that event (Newman, 1947). Modeling work by Blong and others
(2001) indicate that the combination of location, track and hail size of the 1999 event has a return period of 25
to 30 years. This figure is supported by the more recent numerical simulations of Leslie and others (2008).
It is clear that the return period of hailstones of a size sufficient to cause damage to tiled roofs somewhere in
Sydney, is very short. Arguably, the return period of large hail at a location could be used for the design of
roofs to withstand hail damage, in much the same way that the Building Code of Australia (BCA) establishes
return periods for wind storm and earthquake risk for construction purposes. In Australia, the design return
period used for earthquake risk is 500 years and for wind risk, it is approximately 1,000 years. For an individual
location in Sydney, winds at this return period are driven by downburst winds from thunderstorms (Holmes,
2002). In addition, the BCA is primarily designed to meet life safety standards. Although there are some
provisions to minimize loss of amenity associated with lateral loading due to wind or earthquake perils, there
are currently no provisions specifically targeted to minimizing damage fro m hail.
Loss Recurrence of the 1999 Sydney Hailstorm
The return period of loss is very different to the return period of hailstone size , as the damage and subsequent
loss depends upon where and when a storm strikes. One analysis, performed by Blong and others (2001),
© 2009 Risk Management Solutions, Inc. 14estimate that the return period associated with the residential loss from the 1999 Sydney Hailstorm is less than
100 years.
Historical loss data in Australia, with which most researchers based their analyses, have only a few decades of
reliable data. Moreover, the population of Australia is concentrated into a small number of cities and large
towns with vast, almost empty areas. Any future trends that one can determine through analysis of the
historical loss data are fraught with uncertainty. Moreover, one big loss event will significantly change the
characteristics of the historical data set (Blong et al., 2001).
As the historical record is so short, there is even more uncertainty associated with the return period for the
largest losses, as these are associated with lower probabilities (or higher return periods) . However, if one
considers the Insurance Council of Australia’s (ICA) historical disaster statistics from 1967 through 2006 (ICA,
2009), adjusted to current values by Crompton and McAneney (2008), a severe convective storm loss in the
Sydney metropolitan area on the order the 1999 event has a return period of several decades—and not more
than 100 years.
Climate Change
There is a lot of concern in Australia about the impacts of cli mate change on future event occurrence—and
hence, future losses. Moreover, large losses have become more frequent. For example, the 2007 winter storm
in New South Wales caused AUD$1.48 billion of insured loss and the latest insured estimate from the 2009
Victorian brushfires stand at AUD$1.12 billion, with losses still being reported ( See Table 2).
However, Crompton and McAneney (2008) thoroughly re-examined historical events to update the ICA’s
historical loss data set. They conclude that the strong upward trend in losses is due predominantly to increases
in population and wealth. A climate change signal is not yet visible in the available loss data , although it may
emerge over time. From high resolution numerical simulation work, Leslie and others (2008) conclude that
severe hailstorm events are likely to become more frequent and severe in New South Wales although it may be
a few decades until climate change can be differentiated from natural inter -decadal variability.
© 2009 Risk Management Solutions, Inc. 15INSURANCE MARKET IMPLICATIONS
In New South Wales, hail and wind storms are frequent events, accounting for approximately one-third of all
severe weather events (Natural Hazards Research Centre, 2000). While the majority of these events result in
relatively minor losses, large-scale events that impact an urban area can, and do occur.
Top 10 Insured Losses: Absolute versus Adjusted
As Table 2 illustrates, five of the top 10 absolute insured losses dating back to 1967 are from hail or wind storm
events. Moreover, five of the top 10 insured losses were from events in NSW. The 1999 Sydney Hailstorm was
the most costly of these storms, with AUD$1.7 billion in insured damage, the single largest insured loss in
Australia’s insurance history.
Table 2. Top ten insured losses in Australia from 1967 through 2009 (Source: Insurance Council of Australia, 2009)
Insured Loss
Natural Disaster Event Date Location
(AUD$ millions)
Hailstorm April 14, 1999 Sydney, NSW 1,700
Newcastle & Hunter
Severe Storm June 6-8, 2007 Valley, NSW 1,480
Victorian Bushfires February 2, 2009 VIC 1,120*
Earthquake December 28, 1989 Newcastle, NSW 862
Cyclone Larry March 20, 2006 North QLD 540
Western Sydney,
Severe Hailstorms December 9, 2007 Blacktown, NSW 415
Bushfire January 18, 2003 Canberra, ACT 350
Flood storm February 14, 2008 Mackay, QLD 342
Hail March 18, 1990 Sydney, NSW 319
Hail, Storm February 2, 2005 NSW/TAS/VIC 216.7
* AUD$ millions in 2009 dollars, as losses are on-going. This estimate is accurate as of 03/13/2009. See:
http://www.insurancecouncil.com.au/Default.aspx?tabid=1684
If one considers population, inflation and wealth adjustments, the insured loss from the 1999 Sydney Hailstorm
is AUD$3.3 billion, ranking third behind a normalized loss of AUD$3.65 for Cyclone Tracy in 1974 and AUD$4.3
billion for the 1989 Newcastle Earthquake (Table 3). The top 10 adjusted losses from 1967 through 2006, based
on the work by Crompton and McAneney (2006) are illustrated in Figure 10.
© 2009 Risk Management Solutions, Inc. 16Table 3. Top Ten normalized insured losses in Australia from 1967 through 2006 (Source: Crompton and McAneney,
2008)
Normalized
Natural Disaster Event Date Location Loss in 2006
AUD$ millions
Newcastle Earthquake December 28, 1989 Newcastle, NSW 4,300
Tropical Cyclone Tracy December 24, 1974 Darwin, NT 3,650
Hailstorm April 14, 1999 Sydney, NSW 3,300
Cyclone Wanda, Flood January 25, 1974 Brisbane, QLD 2,090
Hailstorm January 18, 1985 Brisbane, QLD 1,710
Ash Wednesday Bushfires February 16, 1983 VIC/SA 1,630
Hailstorm March 18, 1990 Sydney, NSW 1,470
Cyclone Madge March 4, 1973 QLD/NT/WA 1,150
Hailstorm November 10, 1976 Sydney, NSW 730
Hailstorm October 3, 1986 Sydney, NSW 710
Figure 10: Australian insured losses from meteorological hazards (1967–2006) at the time of
occurrence (above) and normalized to 2006 dollars (below) (Source: Crompton and McAneney,
2006)
© 2009 Risk Management Solutions, Inc. 17Challenges for Insurers
Losses from recent large events in Australia are driving insurance prices up, making affordable insurance in
Australia an issue. While there is no evidence that these recent losses are a result of climat e change, climate
change is now widely accepted by the scientific community, and the Intergovernmental Panel on Climate
Change (IPCC) believes that it will lead to more frequent and more extreme weather events in the future
(Garnaut Climate Change Review, 2008). An increase in the frequency and severity of weather events will have
an impact on the global reinsurance market. Extreme weather events which hit urban areas, such as Sydney
and Brisbane, can incur large insurance losses well beyond an insurer ’s retention layer, triggering reinsurance
placements. For example, a substantial portion of the AUD$1.7 billion loss from the 1999 Sydney Hailstorm was
borne by the reinsurance market.
How a severe convective storm event is defined can also impact reinsurers. Large losses from severe storms are
not necessarily due to one large hailstorm event impacting a densely populated area. A large loss could result
from a series of severe storm days. Defining a loss event from a severe storm as one event or multiple events
can be difficult, as conditions favorable to the formation of severe storms can persist for several days and cover
large areas. Additionally, there are competing definitions in the insurance market on the definition of an event.
For instance, the storms which hit southeast Queensland from November 16–20, 2008 were defined as one loss
event by some companies, while others defined the storms as two loss events. Depending on a company’s
reinsurance arrangement and the cumulative losses from weather-related events in that year, the definition of
such events could determine whether or not a reinsurance layer is triggered.
Extreme weather events also impact the cost and duration of recovery, driving up the costs to insurers. The
1999 Sydney Hailstorm triggered shortages in roofing materials and the availability of skilled laborers, causing
severe delays in repairing damaged roofs on the order of months in some circumstances. In addition, almost
$100 million of the AUD$1.7 billion was paid out for time element coverages (e.g., business interruption).
While it is expected that, at very long return periods, earthquakes in NSW will drive the tail of the loss
exceedance curve, at shorter return periods, flood, windstorm and severe convective storm risk must be
managed.
Severe Convective Storm Modeling
The 1999 Sydney Hailstorm is a clear example of the damaging impacts of a severe convective storm on an
urban area. If the storm had taken a slightly different path through the Sydney area, the damage would have
been much greater. At the time of the 1999 storm, no previous severe convective storm event had ever
produced that much damage. It caught the insurance industry off guard, leading many to believe that the
hailstorm was an anomaly. However, research shows that the probability of a similar event occurring is much
higher—it was not a once-in-a-lifetime storm.
The frequency of severe convective storms in Australia, and their ability to cause a significant amount of
damage, highlights the importance of severe convective storm risk assessment and management. Catastrophe
models are valuable tools for risk management purposes, providing a probabilistic view of the risk from various
perspectives.
In 2009, RMS is actively developing a fully probabilistic severe convective storm model for the Sydney region to
assist companies in the Australian insurance market to manage and prepare for the pervasive threat from
severe convective storms in Australia. Initially developed only for the Sydney region, the RMS ® Australia Severe
Convective Storm Model will complement the existing RMS ® Australia Earthquake and Australia Cyclone models,
allowing (re)insurers a more comprehensive view of the risks to their portfolios.
© 2009 Risk Management Solutions, Inc. 18REFERENCES
Australian Bureau of Statistics. Population Statistics . Retrieved from the ABS website:
http://www.abs.gov.au/AUSSTATS/abs@.nsf/webpages/statistics?opendocument
Blong, R., Leigh, R., Hunter, L., and Chen, K. (2001). Hail and Flood Hazards – Modelling to Understand the
Risk. Proceedings of the 2001 Aon Re Australia Limited Conference on Enhancing Shareholder Value through
Capital Risk Management . Aon Re Australia Limited.
Brooks, H. (2009). Severe Thunderstorm Climatology . NOAA's National Severe Storms Laboratory. Retrieved
from http://www.nssl.noaa.gov/hazard/totalthreat.html
Bureau of Meteorology (2009a). About Graphical Severe Thunderstorm Warnings in New South Wales . Retrieved
from the BoM website: http://www.bom.gov.au/catalogue/warnings/GSTW/graphicalproductsnsw.shtml
Bureau of Meteorology (2009b). Report by the Direction of Meteorology on the Bureau of Meteorology’s
Forecasting and Warning Performance for the Sydney Hailstorm of 14 April 1999 . Retrieved from the BoM
website: http://www.bom.gov.au/inside/services_policy/storms/sydney_hail/hail_report.shtml
Changdon, S. (1977). The scales of hail. Journal of Applied Meteorology , 16, 626-648.
Crompton, R.P. and McAnenev, K.J. (2006). Normalised Australian insured losses from mete orological hazards:
1967–2006. Environmental Science & Policy, 11(5), 371-378.
Crompton, R.P. and McAnenev, K.J. (2008). The cost of natural disasters in Australia: the case for disaster risk
reduction. The Australian Journal of Emergency Management , 23, 4.
EMA (1999). Final Report of Australia’s Coordination Committee for IDNDR: 1999-2000 . Emergency
Management Australia.
EMA (2007). Sydney, NSW: Severe Hailstorm (incl Lightning) . Available from Emergency Management Australia
Disasters Database.
Garnaut Climate Change Review (2008). Issues paper 2 - Financial Services for Managing Risk: Climate Change
and Carbon Trading . Retrieved from Garnaut Climate Change Review website:
http://www.garnautreview.org.au/
Geerts, B. and Linacre, E. (1998). Tornado frequency worldwide . Retrieved from University of Wyoming, College
of Engineering and Applied Science, Department of Atmospheric Sciences website: http://www -
das.uwyo.edu/~geerts/cwx/notes/chap07/tornado_clim.html
Henri, C. (2000). The Sydney hailstorm: the insurance perspective. Australian Journal of Emergency
Management, 14, 16-18.
Holmes, J.D. (2002). A Re-analysis of Recorded Extreme Wind Speeds in Region A. Aus J Struct Eng , 4(1), 29-
40.
Housing Industry Australia (2006). State Outlook – NSW, September Quarter, 2006. Campbell, ACT.
Insurance Council of Australia (2009). Insurance Council of Australia: Historical Disaster Statistics . Retrieved
from Catastrophe Disaster Statistics section of Insurance Council of Australia website:
http://www.insurancecouncil.com.au/IndustryStatisticsData/CatastropheDisasterStatistics/tabid/1572/Default.as
px
© 2009 Risk Management Solutions, Inc. 19Leslie, L.M., Leplastrier, M., and Buckley, B.W. (2008). Estimating future trends in severe hail storms over the
Sydney basin: A climate modelling study. Atmospheric Research, 87(1), 37-51.
Natural Hazards Research Centre (2000). Pricing hail losses: extrapolation of past losses versus stochastic
modeling. Natural Hazards Quarterly , 6(1).
Newman, B.W. (1947). Phenomenal hailstorm with thunderstorm Sydney, 1st January 1947. Weather Research
and Development Bulletin , 8, 23-41, Bureau of Meteorology.
Risk Management Solutions (2009). The 2008 U.S. Severe Convective Storm Season: RMS Special Report .
Available at Risk Management Solutions website: http://www.rms.com/Publications/
Schuster, S.S., Blong, R.J., Leigh, R.J., and McAneney, K.J. (2005 a). Characteristics of the 14 April 1999 Sydney
hailstorm based on ground observations, weather radar, insurance data and emergency calls. Natural Hazards
and Earth System Sciences , 5, 613-620.
Schuster, S.S., Blong, R.J., and Speer, M.S. (2005b). A Hail Climatology of the Greater Sydney Area and New
South Wales, Australia. International Journal of Climatology , 25, 1633–1650.
State Emergency Service (2008). The Western Sydney Hailstorm 2007. Available from SES website:
http://www.ses.nsw.gov.au/multiversions/11097/FileName/Dec07_Hail_Report_for_web.pdf
SGIO (2004). Steel roofs guard against hail study . SGIO Insurance. Available at: www.sgio.com.au/pub
Steingold, M. and Walker, G. (1999). Sydney Hailstorm 14 April 1999: Impact on Insurance and Reinsurance .
Retrieved from Aon Australia website: http://www.aon.com.au/pdf/reinsurance/Aon_Sydney_Hailstorm.pdf
TORRO (2006). TORRO Hail intensity scale . Retrieved from the Tornado and Storm Research Organisation
website: http://www.torro.org.uk/TORRO/severeweather/hailscale.php
Whitaker, R. (2005). Australia’s Natural Disasters . Australia: Reed New Holland.
© 2009 Risk Management Solutions, Inc. 20You can also read