ECONOMIC PROSPECTS AND THE COST OF DOING BUSINESS IN THE PILBARA - AN EXECUTIVE UPDATE - FEBRUARY 2020
←
→
Page content transcription
If your browser does not render page correctly, please read the page content below
ECONOMIC PROSPECTS AND THE
COST OF DOING BUSINESS IN THE PILBARA

AN EXECUTIVE UPDATE

                                 FEBRUARY 2020

                                P I L B A R A
Acknowledgements

The consultants would like to thank all those persons and
organisations for their important contributions
to this study, and in particular the staff of Regional
Development Australia (RDA) Pilbara, Western Australian
(WA) local and state government agencies, Pilbara-based
Business Representative Associations, NGOs, SMEs and the
resources industry for their support and assistance.

The Report and the information contained therein are
expressly for the use of the Client. Written permission is
required from the Client for any subsequent distribution
or publication.

Disclaimer

Any statement or finding expressed or implied in
this document is provided in good faith based on the
information available to the consultants. No warranty
expressed or implied is given for accuracy of the
information provided by others. The authors accept no
liability for any loss or damages arising from or relating to
the use of the report by any other party.
Forward

Regional Development Australia (RDA) Pilbara has been reporting on the economic and
business environment through annual Cost of Doing Business studies since 2013. This
report provides an executive update on this theme.

The Pilbara contributes to the economic development of the State and Australia more than
any other region in Australia. It now has a broader and deeper extractive industries sector
and opportunities afforded by the abundance of renewable energy and marine resources
are increasingly being recognised as providing enhanced prospects for a greater degree
of diversification.

The focus is on understanding the drivers and constraints to economic development in the
Pilbara. Policies that seek to alleviate the constraints and enhance further development
need the ongoing attention of government agencies at all levels.

The findings of this research report will be used to:

• Inform businesses about the business environment, the prevailing cost structure and future
  costs, to improve planning and operations;
• Inform government agencies so that policy formulation can be adjusted to take the
  prevailing constraints into account.

RDA Pilbara is a strong advocate of economic diversification and a supporter of the Small
and Medium Enterprises (SME) and Non-Government Organisations (NGO) sectors as
key pillars for the sustainable future of the Pilbara. Clearly it is in the best interests of
all businesses that costs are controlled and the enabling environment for investment is
sustained and enhanced.

The Pilbara is entering another exciting phase in its growth and development. It is
imperative that joint action by the public and private sectors ensure that the benefits flow
to the community.

                                                        THE COST OF DOING BUSINESS IN THE PILBARA   1
CONTENTS
FORWARD 1
1. RECENT DEVELOPMENTS IN THE PILBARA ECONOMY 4
2. RECOMMENDATIONS 5
3. THE VALUE OF THE PILBARA ECONOMY 6
4. POPULATION AND EMPLOYMENT TRENDS IN THE PILBARA 8
5. CONSTRAINTS TO ECONOMIC DEVELOPMENT AND THE COST
OF DOING BUSINESS IN THE PILBARA 10
5.1 International Risks 10
5.2 Cost of Living 10
5.3 Labour Costs in the Pilbara 11
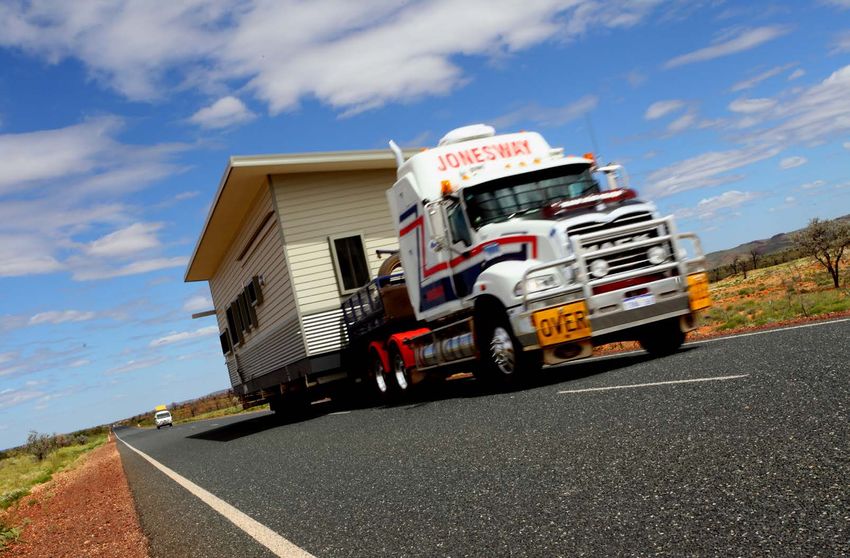
5.4 Residential Availability and Accommodation Costs 15
5.5 Insurance Costs 17
5.6 Utility Costs 18
5.7 Transport Costs 19
6. CONCLUSIONS 20
REFERENCES 20
THE COST OF DOING BUSINESS IN THE PILBARA 3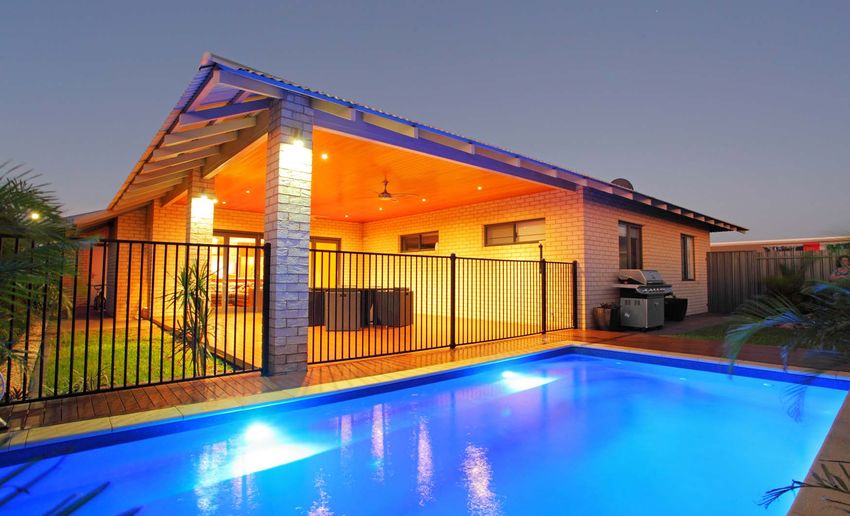
1. Recent Developments in the
    Pilbara Economy

    The economy of the Pilbara has strengthened markedly and            • Accommodation Costs: The property market has improved
    contributes significantly to the economic growth of Australia,        significantly and rising purchase and rental costs are of concern,
    and Western Australia in particular. This is the result of            particularly in Karratha. SMEs cannot compete with large resource
    anticipated investments by the resources sector in the order of       companies and lack of accommodation is a major constraint to
    $120 billion between 2019 and 2025. However, costs are rising         business survival let alone expansion.
    for most goods and services and accommodation, and labour           • Diversification: Although there has been increased diversification
    availability are becoming significant constraints to businesses,      of the resources industry, which in turn can supply the raw
    particularly for SMEs.                                                materials for further diversification, such as natural gas to the
                                                                          proposed major fertiliser projects near Karratha, there are
    Key recent trends in the Pilbara economy that reflect both the        limitations for industries not related to the resources sector.
    opportunities and constraints are as follows:                         This is primarily due to high operating costs, distance and access
                                                                          to markets.
    • Business Environment: There are increased opportunities for       • Local Market: Although the population has started to rise slightly
      SMEs with an improved business environment and a greater            following the recent downturn, it is relatively small and the
      demand for a wide range of goods and services.                      limited local market is a constraint to the further development of
    • Labour Force: The local labour force is too small to supply all     the non-resource related sectors of the economy.
      of the skills and the number of workers required for business
      expansion, and the availability and cost of labour are emerging
      as major constraints to business.

4   THE COST OF DOING BUSINESS IN THE PILBARA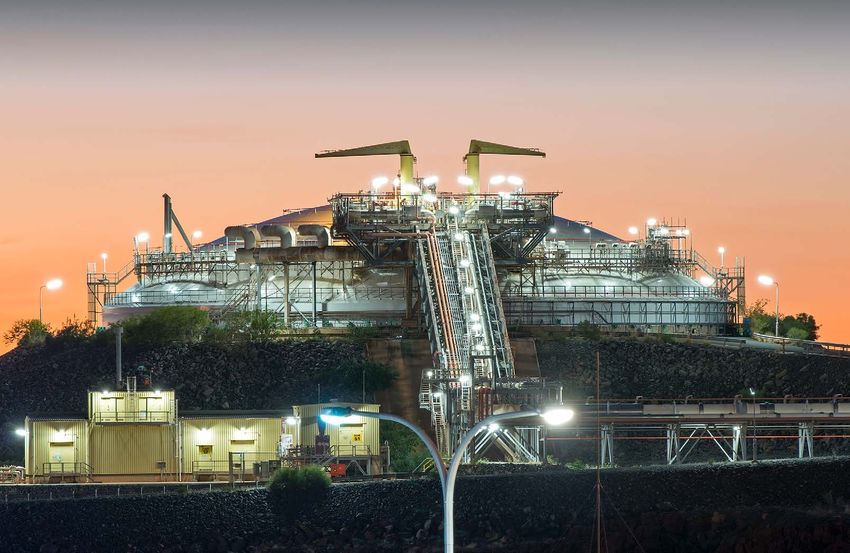
2. Recommendations
The remarkably high value of the economy of the Pilbara to                  organisations in other Australian States and overseas to foster
the State and the nation needs to be supported by appropriate               innovation and to link enterprises using a value chain approach.
policies.                                                               •   Insurance: Rapid implementation by policymakers of the
                                                                            Australian Competition and Consumer Commission (ACCC)
• Labour: Although avenues exist for businesses to employ                   recommendations from their report on Northern Australia
  workers from outside Australia in regional areas the high and still       Insurance Inquiryi aimed at reducing the cost of insurance, across
  rising cost of labour requires enhanced flexibility in regulations        the community as a whole, and for business in particular.
  related to employment of overseas workers. Enhanced skills            •   Higher Value-added Enterprises: Encouraging higher value-
  development programmes are also required for the local                    added enterprises to locate to the Pilbara, particularly with
  labour force.                                                             regard to supplying digital and additive technologies to the
• Accommodation: A major constraint, particularly in Karratha, is           resource industry needs to be supported.
  the rapidly increasing cost of accommodation. The need to secure      •   Air Links: The need for establishing more cost competitive air
  the investment of the private sector in construction activities           links is a priority. In particular the flight costs from Perth to the
  is becoming urgent, as stock levels are very low. Increasingly,           Pilbara are prohibitive when compared to flights from Perth to
  prospective employers and employees are simply unable to find             the East Coast of Australia.
  affordable accommodation.                                             •   Liveability: Further investments in making the Pilbara an
• Markets for SMEs: Increasing markets for SMEs in the non-                 attractive place to live are required, particularly in Newman and
  resources sector is a priority. Both local and export opportunities       Port Hedland. There is a need for a continuing effort to reduce
  need to be constantly appraised and more attention should be              the fly-in-fly-out (FIFO) component of the workforce through
  given to opening up markets and further stimulating innovation            encouraging local residency by appropriate urban renewal and
  in a practical manner. In this regard fact-finding trade missions         housing programmes.
  for small business need to be expanded, and the Enterprise Hubs
  in the Pilbara would benefit from deeper linkages with similar

                                                                                                           THE COST OF DOING BUSINESS IN THE PILBARA   5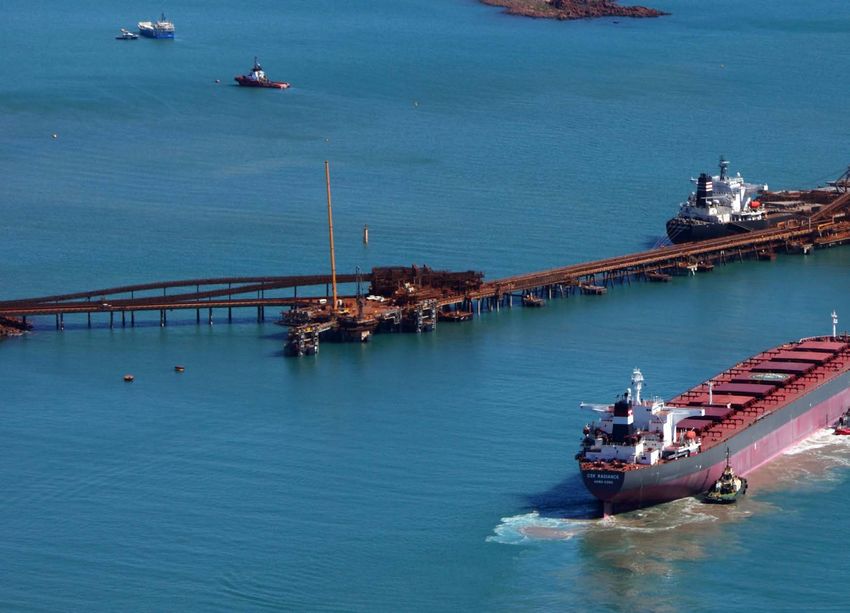
3. The Value of the Pilbara Economy

    The Pilbara economy has continued to strengthen in 2019 and              • Contribution of Resources Sector to Improved Federal and State
    into 2020 and its already high value has increased markedly.               Budgets: As pointed out by the West Australian newspaper “the
    The prices of most commodities remained favourable, with the               budgets of both the Federal and State WA” coffers are swelling
    exception of lithium and liquefied natural gas (LNG), however,             more than expected. The WA Government’s Mid-Year Economic
    over the medium-term prices for these two commodities are                  and Fiscal Outlook indicated an increased 2019/20 budget
    also expected to improve.                                                  surplus from $1.2 billion to $2.6 billion, due partly to higher iron
                                                                               ore royalties resulting from elevated iron ore prices.”
    The value of the Pilbara economy to Western Australia and the              A survey of 41 WA Chamber of Minerals and Energy (CME)
    Nation as a whole is shown by:                                             members revealed that in 2017/18 their total direct economic
                                                                               contribution to WA was $38 billion, which included salaries
    • Value of Pilbara Economy: Mining, construction and exports               and wages, payments to government, business purchases and
      dominate the Pilbara’s economy. The region is the state’s                community contributions.
      mining powerhouse and makes a significant contribution to the          • Mining Royalties: Royalties received from the mineral resources
      national wealth. Its iron ore and LNG industries are valued at           sector in 2018/19 totalled $6.2 billion, of which 87% was
      over $70 billion, representing more than 70% of mineral and              from iron ore. Mining royalties accounted for 20% of WA State
      energy production in Western Australia. In addition to attracting        Government revenue.
      tourists through its unique and internationally recognised natural     • Australian Export Earnings: Federal data shows that Australia’s
      features, the high number of visitors to the region is also linked       resource and energy export earnings are forecast to hit a record
      to mining, construction and travel for business. The Pilbara             $281 billion in 2019/20, up from $279 billion in 2018/19.
      region supports 63,850 jobs and had an annual economic output            The mining sector accounted for a very high proportion of the
      of $61.3 billion  in 2019.                                               country’s GDP in the year to the September quarter (9.5%),
    • Capital Investment in the Pilbara: The current wave of                   with the Pilbara making the largest contribution of any region.
      investment in the Pilbara is driven by the iron ore and LNG              Western Australia accounted for 43% of Australia’s merchandise
      sectors, as was the case with the last investment cycle. The             exports in 2018/19.
      iron ore industry has $17 billion worth of new projects under          • WA Sales Value of Minerals and Petroleum: Western Australia’s
      construction and an additional $33 billion under consideration to        mineral and petroleum industry recorded record sales of $145
      replace mines closing. The LNG industry is constructing $5 billion       billion over the 2018/19 financial year. Much of this economic
      worth of projects and considering projects worth a further $39           value comes from the Pilbara. The bulk of the $30 billion
      billion. In addition to backfilling existing capacity, LNG companies     increase on the 2017/2018 period was the result of improved
      are looking at developing new LNG trains at Pluto, Gorgon and            iron ore prices and increasing LNG volumes as projects continued
      Wheatstone. There are also several projects under construction or        to move towards full capacity in the Pilbara.
      consideration in emerging industries, such as mineral processing,      • Value of Iron Ore: Iron ore is currently the State’s most valuable
      petrochemicals, renewables and hydrogen. Critical investment             commodity at $61 billion. Petroleum products follow at $26
      decisions are anticipated in 2020 and 2021 for LNG, fertiliser and       billion, with gold third at $11 billion. Iron ore and petroleum
      iron ore. In this regard, the future prospects for the economy of        products saw an increase in value of 39% and 5% respectively
      the Pilbara are increasingly linked to further investments in LNG        compared to the previous financial year.
      and renewables, as well as the continuing key role of iron ore.        • LNG Exports: Australia is now the world’s largest LNG exporter
    • Exploration Expenditure: Exploration spending for all                    by overtaking Qatar, with a record 77.5 million tonnes shipped in
      commodities grew by 19% in 2019 to reach $897 million in the             2019, earning an estimated $49 billion, according to consultancy
      September quarter in WA, much of which is in the Pilbara.                EnergyQuestiii. Western Australia continued as the dominant
    • Karratha Investments: In the Karratha region Woodside’s                  export region, accounting for 57% of shipments, with the
      Scarborough and Pluto Train 2 development, and the Browse                Woodside Petroleum-managed North West Shelf venture the
      to North West Shelf project are both in the pipeline, as is the          country’s single biggest exporter, followed by Chevron’s Gorgon
      renewable energy hub at the Yara Pilbara ammonia plant. With             and Wheatstone plants.
      more than $65 billion in investment over the next three to five        • Resource Sector Workers in WA: The CME has estimated that
      years and anticipated population growth, Karratha is poised for          the number of workers employed in WA’s resources sector
      further major expansion.                                                 rose by 12,000 last financial year to a record 124,000. This
                                                                               figure is a significant increase and brings employment levels to
                                                                               above those in 2013 when the last boom came to an end. The
                                                                               proportion of WA’s workforce employed in the resources sector is
                                                                               6.7%, compared to the national average of less than 2%.

6   THE COST OF DOING BUSINESS IN THE PILBARA
• Pilbara Contribution to Future Workforce: The future contribution    • Throughput of Pilbara Ports: Data from the Pilbara Ports
  of the Pilbara  to the WA workforce is large. Together, projects       Authorityvi further illustrates the value of the region to the State
  already under construction in the Pilbara  are expected to create      and the country. A massive 697 million tonnes (Mt) passed
  13,000 construction jobs and directly employ 4,000 workers             through its three ports in 2018/19, reaffirming its status as
  during their operations. If all projects under consideration were      the world’s largest bulk export port authority. The Port of Port
  to proceed, the total number of jobs created would reach more          Hedland recorded a total throughput of 513 Mt and at the Port
  than 50,000 in construction, and 15,000 in operations.  Reaching       of Dampier total throughput was 173 Mt. Total iron ore exports
  this level of job creation however is less certain as some of the      across the two ports totalled 648 Mt, comprising 507 Mt at
  projects under consideration may not proceed in the medium             the Port of Port Hedland and 141 Mt at the Port of Dampier.
  term because of market conditions, finances, skills shortages and      The Pilbara Ports Authority has continued to progress efforts to
  technology development.                                                support future trade growth at existing and new ports and has
  These new projects are expected to require many FIFO workers,          also made progress on the new greenfield ports of Balla Balla,
  albeit less than during the previous investment cycle, because         Cape Preston West, Cape Preston East and Anketell.
  the construction phase will be less labour intensive, and a larger
  share of the workforce will locally reside.

                                                                                                        THE COST OF DOING BUSINESS IN THE PILBARA   7
4. Population and Employment Trends
    in the Pilbara

    POPULATION TRENDS                                                In 2018, the population of the Pilbara gradually increased after
                                                                     three years of small declines and further increases are expected,
    Population forecasts for the Pilbara have been appreciably       due to the large-scale resource industry investments taking
    modified over the last five years, and recent projections show   place, or planned, in the medium term.
    more conservative approaches have been taken, with lessons
    learnt from the end of the last boom.                            In this regard the current REMPLAN forecast for the City of
                                                                     Karratha indicates about 1% growth per year from 2019 to 2028.
    As predicted in previous RDA Pilbara reports, the resident       It is worth noting that the City’s population increased
    population of the Pilbara decreased as the economy slowed        by 30% from 2006 to 2016. The projected population is about
    down after 2013. The total population of the Pilbara was         25,500 in 2028viii.
    about 61,400 in 2016vii, compared to 64,000 between 2012
    and 2014. A smaller population decreases the amount of local     For Port Hedland it is a similar trend but with probably slightly
    labour available and increases pressure on employers when the    lower average increases in population over the next ten years.
    economy once again starts to expand. A smaller population also   Recent analysis projects a growth rate of just below 1% per year
    means a smaller local market.                                    through to 2028, to reach about 16,000 people.

8   THE COST OF DOING BUSINESS IN THE PILBARA
However, due to the short-term impacts of multiple resource EMPLOYMENT TRENDS IN THE PILBARA
industry projects happening at the same time there can be rapid The total number of jobs in the Pilbara region is 63,850 with
peaks and troughs in population in these centres. This trend is mining contributing the most, followed by construction, which
manifesting itself again as evidenced by the rapid upswing in together make up over 60% of all employment.
housing and rental prices in major Pilbara towns. This illustrates that the health of these sectors underpins the
economy of the region.
Pilbara Population 2006 to 2018 Pilbara Population 2006 to 2018v
30000
70000 Number Employed
25000
60000
20000
50000
15000
40000 10000
30000 5000
20000 0
at al str ing
Ad es oo h n
in n Se se
He E upp Sci ices
Ca tio er ic
bl So rai s
Ad al ing
, S t.
he R ty
an er il
ac es
Ut ing
Ot , Re les s
r C Es e
eg e
s
Pu re, n, T vice
ng h tie
ie
M S ta
he al al
at tat
of , F are io
in sis
th a t S tif
e
m sio d ou
uf vic
or
Pr ion , W uct
od st on in
ic ci n
r
af
e
iri W ili
al uc or en
, S al rv
m As
tu
10000 m Po C M
o
r
,
Ot
0
d
,H
m t,
2006 2007 2008 2009 2010 2011 2012 2013 2014 2015 2016 2018
al
co or
nt
Ac nsp
Re
a
Total Population
Tr
Figure 1: Population of the Pilbaraix Figure 2: Employment by Sector in the Pilbara
THE COST OF DOING BUSINESS IN THE PILBARA 95. Constraints to Economic
Development and the Cost of Doing
Business in the Pilbara
The key constraint to socio-economic development in the 5.2 COST OF LIVING
Pilbara is the high and increasing cost of doing business in the
region. In this regard we focus on the high cost of living, labour THE COST OF LIVING - REGIONAL PRICE INDICATORS (RPI)
and accommodation, which are of particular concern. • Between 2011 and 2017 the overall Regional Price Index
(RPI)xii for the Pilbara, comparing prices with Perth, fell from
5.1 INTERNATIONAL RISKS 137 to 111. However, in 2019 the RPI shows that overall prices
were highest in the Pilbara region of WA, with the indicator
Downside risks have changed in the short term. The immediate rising to 115.7, followed by the Kimberley and Gascoyne
risk is the onset of the coronavirus that originated in China. regions. In the Pilbara, all commodity groups were significantly
The impact on the Chinese economy is likely to be severe in higher than Perth prices, with housing and health and personal
the short term. Commodity prices have softened and even care exceptionally high. Costs were highest in Tom Price (new
the global economy is at some risk. On the other hand, some addition to the RPI) and Port Hedland.
progress between the USA and China concerning trade issues • Given the high level of capital investment in the Pilbara in the
and stimulation measures taken by China in early January medium term the absolute level of costs will probably rise
2020 should underpin an improved economic outlook and further, particularly transport, construction, accommodation
consequently a more buoyant environment for WA’s key mineral and wages.
commodities. • Persons working in higher paid professions may cope with the
high costs of living and could be in a position to accumulate
Over the medium-term global growth estimates have been savings. However, for persons in lower paid categories, such as
revised downwards by international agencies. The IMF is administration, retail and hospitality, this high cost structure
predicting the global economy will expand by 3.3% in 2020 and is problematic.
3.4% in 2021, which are reductions of previous forecasts.
Pilbara RPI
In terms of financial risks, the “Global Wave of Debt” is the
largest and fastest in 50 years, according to the World Bank . 130
Debt in emerging and developing economies climbed to a record
US$55 trillion in 2018, marking an eight-year surge that has 125
been the most broad-based in nearly five decades. Policymakers
have been urged “to act promptly to strengthen their economic 120
policies and make them less vulnerable to financial shocks. It
115
underscores why debt management and transparency need
to be top priorities for policymakers”. Australia’s linkages into
110
key emerging and developing markets can be of concern and
reinforces the need for diversification and deepening of the 105
economy.
100
Pilbara Karratha Port Hedland Newman Onslow Tom Price
2017 2019
Figure 3: Pilbara Towns - RPI Indexes for 2017 and 2019
(compared to Perth)
10 THE COST OF DOING BUSINESS IN THE PILBARA5.3 LABOUR COSTS IN THE PILBARA
AUSTRALIAN BUREAU OF STATISTICS (ABS) DATA Moreover, data in the Pilbara towns relative to those in Perth,
The ABS 2011 and 2016 Census data provides baseline data WA, and Australia over the period between 2001 and 2016 show
on income changes in the Pilbara compared to Perth, Western that the percentage increase in individual incomes was between
Australia and Australia, showing the high level of wages in 87% and 170% for the Pilbara, as opposed to an increase of 50%
the Pilbara as reflected in the table and graph below. After the for Perth, 34% for WA and 76.5% for Australia.
height of the resources boom in 2011, with the exception of
Onslow, incomes declined slightly in 2016, but remained at an
elevated level. The ABS census, due to be implemented in 2021,
is likely to show that labour costs are at similar levels to 2011
and possibly higher.
Town/City Year Percentage Change on Base Year (2001)
2001 2006 2011 2016 2001-2006 2006-2011 2001-2011 2001-2016
Karratha 704 940 1,543 1,318 34% 64% 119% 87%
Newman 785 1,095 1,538 1,468 39% 40% 96% 87%
Port Hedland 689 862 1,368 1,361 25% 59% 99% 98%
Onslow 452 428 926 1,224 -5% 116% 105% 170%
Perth 484 513 669 728 6% 30% 38 % 50%
Western Australia 540 500 662 724 -7% 32% 23% 34%
Australia 375 466 577 662 24% 24% 54% 77%
Table 1: Median Individual Weekly Income for Pilbara City/Town, Perth, WA and Australia 2001 – 2016 ($)
THE COST OF DOING BUSINESS IN THE PILBARA 11Median Individual Weekly Income Following a similar trend line, the Median Weekly Income for
families and households also increased from 2001 to 2016.
1800 The most recent data from the 2016 ABS census shows that
the Pilbara has the highest level of household income in
1600
Western Australia with a median of $2,422 a week. The WA
1400
median is $1,595.
1200
1000
Location Family Household
800
East Pilbara 2,536 2,353
600 West Pilbara 2,936 2,569
400 Karratha 2,536 2,353
200 Port Hedland 3,000 2,578
0 Ashburton 2,889 2,456
2001 2006 2011 2016
Karratha Newman Port Hedland Table 2: Weekly Median Incomes Pilbara Regions and Towns in 2016 ($)
Perth WA Australia Onslow
Figure 4: Median Individual Weekly Income Pilbara Towns, Perth, WA
and Australia – 2001 to 2016 ($)
12 THE COST OF DOING BUSINESS IN THE PILBARALABOUR COST DATA FROM OTHER SOURCES • this trend has continued in 2019/20. Discussions with
The increasing cost of labour is illustrated by the following: stakeholders in the Pilbara in early 2020 indicate difficulties in
sourcing labour in almost every category, with accompanying
• Data from the Pilbara Development Commission (PDC) indicates high costs that includes remuneration, relocation and
that over 26% of employees have weekly incomes of more than accommodation. For example, in Port Hedland skilled tradesmen
$2,000 and that there are very wide differences in income levels. are paid between $60 and $75 per hour (between $10,000 and
For example, more than 13% of workers have an income of $13,000 per month). Hospitality staff remuneration is up to $35
$800 per week or less and income disparities are unlikely to be per hour and managers receive wages of between $12,000 and
reduced without further diversification in the economy. $14,000 per monthxiv.
• The wages and salaries paid by businesses and organisations • Similarly, data sourced from stakeholders in Karratha show
in the Pilbara region are estimated at over $8 billion. This is that labour costs are also very high, in a similar range to Port
a very large amount in relation to the size of the population. Hedland. For example, property administrators in the real estate
In this regard, the Pilbara region represents 29% of the $27.8 sector are earning over $110,000 per annum, whilst managers
billion in wages & salaries paid by businesses and organisations are earning up to $170,000 per annum. Businesses are reporting
in Regional WA, and 7.6% of the $107 billion in wages & that they are having problems in recruiting staff in most skill
salaries paid by businesses and organisations in WA as a whole. sets. For example, recruiting for staff at the TAFE in Karratha
The Shires of Ashburton, Port Hedland, Karratha and the East is becoming more difficult as higher wages are required and
Pilbara have the highest median annual incomes in the country accommodation is difficult to find.
($76,000 to $100,000)xiii.
• Estimates of labour costs in previous RDA Pilbara Cost of Doing
Business studies allowed for a comparison of data between 2013
and 2018 for SMEs. Between 2013 and early 2018 labour costs
declined, with the low point reached in 2016/17, however, as
activity in 2018 increased labour costs started to rise again. For
example, costs for skilled labour increased by some 30% in 2018
compared to 2016.
THE COST OF DOING BUSINESS IN THE PILBARA 13In a Study prepared by the PDC on the comparative costs
of skilled labour in Karratha compared to the Kwinana
Industrial area in Perth, which requires similar skill sets, it
was pointed out that the cost of living in Karratha, specifically
in relation to rental accommodation costs, erodes the wage
premium for workers living in the Pilbara, making it less
attractive and serving as a deterrent for people from taking up
jobs and filling roles in the region. For a family of 4, living in
a mid-range 4x2 property in Karratha on a single ‘like for like’
tradesperson income, they would be out of pocket $23,500 living
in Karratha. They would need an additional $35,000 in after
tax income (a salary of approximately $200,000) to negate the
increased cost of living in the Karratha region. For workers not
‘directly’ employed by the resource companies (who traditionally
pay higher wages), this $35,000 premium is not currently
available. On average workers in Karratha are being offered
approximately a $11,500 after tax extra on a like for like basis.
The situation is complicated by the fact that rental prices are
increasing, and recent history has suggested that prices may go
even higher. For workers not being offered housing or housing
assistance it is a high-risk decision to move to the region. This
puts pressure on smaller companies to invest in housing for their
workers in an already tight property market.
14 THE COST OF DOING BUSINESS IN THE PILBARAIMPACT OF HIGH LABOUR COSTS 5.4 RESIDENTIAL AVAILABILITY
WA resources companies and SMEs need to be cost competitive AND ACCOMMODATION COSTS
to ensure sustainable operations. Resource companies need to be
able to compete globally for capital and markets. Although the The rising cost of accommodation is a severe constraint to
Pilbara has advantages in terms of product quality, proximity to businesses in the Pilbara, in Karratha and Newman in particular.
Asia and a very high level of expertise the level of competition in
the resources sector has increased significantly over the last The latest available Pilbara Housing and Land Snapshot (June
few years. 2019) produced by the PDC indicates a continuation of the
strengthening of the overall property market in the Pilbaraxvi .
Major Resource Companies Costs: Although the major players The trends are clear. Since their report was produced, both house
have been able to reduce costs substantially over the last few and rent prices have continued to strengthen. Examples of how
years (for example, the major iron ore producers have reduced the market is on a path towards higher prices, as indicated in
costs significantly to about US$15 per tonne, which are the the latest Snapshot by comparing data for the first six months of
lowest in the world)) labour costs have increased significantly 2019 with first six months of 2018, are as follows:
during 2018 and 2019, due to the high level of investment in
the short and medium term and the general recovery in the • In the Pilbara as a whole the median sales price of $289,500
economy of the Pilbara. was the highest since 2016.
• The median rent was more than 8% higher at $400 per week.
SME Costs: High labour costs and skills shortages are now a • In Karratha house sale prices rose to $342,500, an increase of
major impediment to the economic viability of SMEs and a more than 7%, whilst vacant land prices increased by 68% to
constraint to diversification. Although there have been reductions over $100,000.
in benefits, such as housing subsidies/allowances over the last • In Port Hedland median house prices rose by 1% to $222,000,
few years, businesses may have to start offering increased levels whilst the median price of units rose by 44% to $175,550.
of accommodation support to retain or attract staff. Recruitment • In the Shire of East Pilbara median house prices rose to
from the Eastern States and from overseas is starting to pick up, $184,500, which is an increase of 22%.
however there is also a high level of infrastructure investment • In the Shire of Ashburton median house prices rose to $272,250,
taking place in the Eastern States, which is limiting the an increase of 13%.
availability of skilled workers.
Figure 5: Dwellings Sales Median Price ($): Pilbara Centres
The implications of rising costs for labour and accommodation is
starting to have a critical effect on the viability of the operations Pilbara Centres Median House Prices
of SMEs. This is where the real problem lies. Incentives are
required to retain staff and also staff turnover levels are very 1.200.000
high in the main centres. The PDC sees the problem as local
1.000.000
businesses struggling to attract workers with the required skills
at a reasonable cost at a time that they are needing to meet
800.000
growing demand”xv.
600.000
This has several potential negative consequences including:
400.000
• Delaying key projects;
• Preventing economic diversification activities; 200.000
• Forcing companies to use interstate and
overseas contractors; and 0
2012 2013 2014 2015 2016 2017 2018 2019
• Preventing government from meeting the 2024 Regional
jobs target.
Karratha Port Hedland
Ashburton East Pilbara
LABOUR COST OUTLOOK
The general consensus of opinion in the Pilbara is that wages
will rise further over the short term and perhaps over the
medium term as the upward trajectory of investments continues.
Increases in costs have been flagged by the resources companies
themselves in numerous forums of late. These pressures are
evident in the resources sector for most categories of workers
including for skilled and semi-skilled workers. Stakeholders
in Karratha expressed the most concern regarding a looming
shortage of skilled workers in industries providing services to the
extractive industries.
THE COST OF DOING BUSINESS IN THE PILBARA 15Pilbara Median Rental Prices A major issue in all centres is that although land is available for
residential development the high cost of construction and land
purchase is an impediment to such development. There has been
2500 very little new residential builds in the last three years, with only
33 residential building approvals in the Pilbara in 2018/19. The
2000 appetite for developers to take on risk in what are perceived as
volatile markets is low.
1500
The Rawlinson’s Construction Cost Guide 2019 indexes for the
Pilbara centres compared to Perth (Perth = 100) show that costs
1000
remain at elevated levels:
500 − Karratha: 155
− Port Hedland: 160
0 − Newman: 165
2012 2013 2014 2015 2016 2017 2018 2019
− Onslow (based on Exmouth data): 160
Karratha Port Hedland
East Pilbara As an example, it is estimated that it costs up to $750,000 to
Ashburton
build a four by two house in Karrathaxvii , while at the same
Figure 6: Dwellings Rental Median Price ($): Pilbara Centres time mortgage finance is tight and the required deposits
are increasing. To help in addressing the issue of shortages
Discussions with stakeholders in the Pilbara centres carried out the City of Karratha intends to provide up to $35 million in a
in January 2020 indicates that they have increasing concerns partnership venture with private enterprise developers, which
regarding the availability and rising cost of accommodation over will alleviate the situation to a limited extent. In addition, two
the last eight months. This is particularly the case in Karratha workers camps for Woodside (LNG expansion) and Perderman
where shortages have reached critical proportions and is now a (fertiliser venture) are to be constructed to accommodate up
real impediment to small and medium size businesses. to 4,500 workers during the construction phase of the projects.
Once the operational phases start the possibility of retaining
The latest data from REIWA for January 2020 indicates that sharp the infrastructure that is constructed for the camps is under
increases in prices have occurred in some suburbs in Karratha discussion for future use for residential houses and apartments,
and in Port Hedland. For example, prices year on year have which seems to be a positive strategy if followed through.
risen in Port Hedland by 8.8% and in the suburbs of Pegs Creek
and Millars Well in Karratha by 21% and 26% respectively. Western Australia’s building and construction sector is likely
In Newman prices have risen by 36%, which is the strongest to see increased activity in the medium term as the economy
increase for many years. recovers, led by Perth, where transport infrastructure works are
to be built at a cost of about $8 billion over the next three years
Given the high levels of resource industry investment in the and other construction activity is also expected to pick up. As a
medium term it is likely that prices will continue to rise and result building costs are likely to rise.
there is now concern that the cost of accommodation will once
again increase the overall cost of living significantly over the High construction costs in the Pilbara are a result of:
next few years.
− Distance - meaning high transport costs for most materials.
• Karratha: Rents and house prices are continuing to rise and − High labour, accommodation and material costs, which are all
there is almost no stock left. It is clear that new construction is rising.
required. It is necessary to encourage developers to re-engage in − More rigorous standards to meet flooding and cyclone issues –
the City. Built industrial sites are either full or heading towards a this adds 30% to structural steel tonnages and significantly to
no vacancy situation. concrete footing volumes.
• Port Hedland: There is an extreme shortage of executive housing − Site visits add 10-20% to costs.
and an overall shortage of properties on the market. Demand
is increasing and there has been very little new construction. Discussions with stakeholders in January 2020 also indicate that
Industrial land is still available. In South Hedland there is still rents are rising quite quickly, after falling by up to 75% during
some stock available from properties built at the height of the the slump in economic activity that followed the last boom. It
boom. Overall prices are anticipated to rise strongly. is expected that rents will continue to rise in the medium term
• Newman: There is a critical shortage of developed industrial and already have reached levels in Karratha of $1,100 to $1,300
sites. Rents and house prices are continuing to rise sharply. per week at the upper end of the market. Clearly rents at these
Housing stock has not been increased significantly. levels are problematic for a large proportion of the working
population and small businesses cannot compete with the
larger players in subsidising employee rent costs. As companies
increase their staff levels in the main centres this situation will
be exacerbated.
16 THE COST OF DOING BUSINESS IN THE PILBARA5.5 INSURANCE COSTS
Insurance costs in the North of WA remain very high and Average Annual Premium $
average premiums remain higher in the whole of northern
Australia than the rest of Australia.xviii 3000
• Between 2007/08 and 2018/19 average premiums have risen
2500
in northern Australia by 178% for home insurance, 122% for
combined home and contents insurance and 33% for contents
insurance. Across all home and contents insurance products, the
2000
average premium increases in northern Australia are on average
twice those in the rest of Australia.
1500
• Of the three northern Australian regions, north Western Australia
had the highest average premiums across all insurance products,
markedly higher than north Queensland and the Northern 1000
Territory. Port Hedland stands out as the most expensive case
study area, with half of all consumers paying over $4,600 for
500
combined home and contents insurance and one quarter paying
over $6,200.
• Average excess levels are also generally higher in northern
0
Australia. Average excesses for combined home and contents
insurance are generally much higher in north Queensland and
NT N Queensland North WA
north Western Australia ($1,100 for buildings, $690 for contents)
compared with the Northern Territory and the rest of Australia Northern Australia Rest of Australia
($700 for buildings, and around $550 for contents).
• In 2018/19 strata insurance premiums in northern Australia Figure 7: Average Annual Premiums for combined home and contents
remained higher than in the rest of Australia. Average premiums insurance (2016/17)
were highest in north Western Australia, at $13,400, which is
more than four times the average for the rest of Australia
of $3,300.
THE COST OF DOING BUSINESS IN THE PILBARA 175.6 UTILITY COSTS
PORT HEDLAND INSURANCE CASE STUDY The amounts of electricity and water consumed per household
and business in the Pilbara are higher than in Perth due to the
• Non-insurance of residential homes has increased climatic conditions and thus the impact on costs to businesses
dramatically from 17% in 2011 to 45% in 2016/17 (latest are also much higher.
available data). The rate in Perth was only 9%.
WATERxix
• In 2018/19 the median cost of home and contents
insurance was $4,638. This was 3.3 times higher than the • Since 2014/15 there have been no price differences between
average premium for the rest of Australia, which was Perth and the Pilbara centres for lower amounts of water
about $1,400. consumed. However, water prices in the Pilbara towns have
increased in 2019/20 compared to 2018/19.
• Port Hedland appears to be the most expensive region by • Water charges for larger amounts used in the Pilbara centres
far in all of Australia for insurance premiums. are now less expensive than in Perth, except for Onslow, where
prices for large water users are very high.
• Affordability as measured by insurance as a percentage of • The resources sector in the Pilbara region abstracts the most
household income is a major issue. water in WA at some 450GL per annum. Abstraction of water is
expected to increase to 578GL per annum by 2024, an increase
• Strata premiums have jumped over 75% in the last 10 years of 29.2%. The forecast for water abstraction in the Pilbara from
and there are examples of over a 30% increase in the 2015 to 2020 is:
last year.
− Resources sector water abstraction is forecast to increase from
• However, actual insurance claims have been modest and 350GL in 2013 to 491GL in 2020, an increase of 141GL, or 40%.
are well below the average for northern Australia and north − Groundwater dewatering is expected to be 404GL in 2020, an
Western Australia. increase of 122GL on 2013 levels, and will account for 82% of
all water abstracted.
− Water abstracted by the resources sector in 2020 will largely be
either recycled (207GL) or used in mine operations (193GL).
18 THE COST OF DOING BUSINESS IN THE PILBARACity/ Town 0 - 150 151 - 500 500+ Fixed Charge: $1.7789 /day
(per kL) (per kL) (per kL) 0-1,650 kWh/day 27.6823 c/kWh
Perth 1.827 2.434 4.553 >1,650 kWh/day 31.2108 c/kWh
Pilbara
0 - 350 Table 4: Prices of Electricity in Pilbara Regional Centres 2019/20
Centres
351 - 500 501-750 750+
Karratha 1.827 2.434 3.906 4.9224 5.7 TRANSPORT COSTS
Port Hedland 1.827 2.434 2.932 3.740
Transport costs in the Pilbara are very high when compared to
Newman 1.827 2.434 2.932 3.740
Perth. This directly impacts on nearly every aspect of running a
Onslow 1.827 2.434 5.402 9.289
business in the region.
Table 3: Cost of Water Pilbara Towns and Perth 2019/2020 ($) • Overall transport costs in the Pilbara were about 7.2% higher in
2019 than in Perth, compared to just over 1% in 2017xxii.
• Fuel costs (unleaded petrol) are up to 30% higher than in
Pilbara Water Costs
Perthxxiii and car hire is about 15% higherxxiv.
• The cost of flights from the main Pilbara centres to Perth
10
(fluctuating around $800 for return economy class) is more
9
expensive than flights from Perth to Singapore or Sydney, despite
8
much shorter flying times . This impacts tourism, business
7
visitations, and residential affordability particularly if families
6
have members living in Perth.
5 • One favourable development is the anticipated start of direct
4 general cargo shipping into the Pilbara from other destinations,
3 rather than routing via Perth. It is anticipated that shipping costs
2 could be reduced by up to 50% because of this initiative.
1
0
Karratha Port Hedland Newman Onslow
500 750
Figure 8: Comparative Water Costs Pilbara Centres 2019/20 ($ per kL
500-750 and 750+ kL)
ELECTRICITY
• The State Government sets the price of electricity (otherwise
known as tariffs), which is charged to residents and businesses
across the State, in both Perth and regional Western Australia.
Electricity prices in all regions in WA, including the Pilbara, have
been standardised and are now the same as prices in Perthxxi.
• Most households pay a tariff that is much lower than the actual
cost of purchasing or generating, distributing and retailing
electricity. The difference between the tariff customers pay
and the actual cost is subsidised by the State Government. The
Government subsidy for FY2019/20 is $300 million.
• The quantity of electricity used by households and businesses is
very much higher in the Pilbara than in Perth. Estimates of the
ratio vary between 2.5 to 3.5, depending on the extent of usage
of air conditioners and other appliances. Therefore, in estimating
the impact of energy costs on businesses in the Pilbara high
usage rates need to be taken into account.
• In the Pilbara resource sector consumption is expected to
increase by 2.4% per annum over the next decade from
10,030GWh in 2015/16 to 12,050GWh in 2027/28, which is an
increase of 27%.
THE COST OF DOING BUSINESS IN THE PILBARA 196. Conclusions
The Pilbara is in a new phase of mining resource investment. they may see wage increases and more disposable income, which
However, most analysts do not envisage a full “boom” effect, could benefit local businesses. On the negative side non-resource
which can be very disruptive. Due to the very significant companies may struggle to retain staff or attract new staff, as they
infrastructure, housing and community investments that have are unable to compete in the labour market
taken place in all of the towns in the last 10 years, but particularly
in Karratha, the region has been future-proofed to a degree. As demonstrated by the data, the overall cost of living and doing
Nevertheless, there has been little increase in housing supply in business in the Pilbara remains stubbornly high and this curtails
the last three years and already sales and rental prices are moving economic diversification and discourages workers transitioning
upwards. This could have a significantly negative impact on the from FIFO to residential. The number of businesses operating in
cost of living and will mostly affect small businesses, not for profits the Pilbara has remained static for the last three years.
and the community services sector.
Policy interventions that can tackle high labour, insurance,
The availability and cost of labour are also of concern. A number transport, and utility costs, combined with innovative de-risking
of mining investments are entering the construction phase at the of the housing market will go a long way in ensuring that the
same time, and this has begun to affect costs for contractors and economic growth in the Pilbara will be sustainable, and will
new hire costs. This will have a knock-on effect, some positive improve the livelihoods of those who reside in the region which is
some negative. For those employed within the resources sector the powerhouse of Western Australia.
References
i Northern Australia Insurance Inquiry: Second interim report. ACCC November 2019
ii Source: Pilbara Development Commission: REMPLAN Economic Profile
iii Financial Review January 2020
iv Australian Mines and Metals Association: 2019
v Karratha; Regional Land Supply Assessment: Department of Planning Lands and Heritage; 2020
vi Pilbara Ports Authority 2018/19 Annual Report
vii Australia Bureau of Statistics – 2016 Census
viii Data supplied by City of Karratha, January 2020
ix Pilbara Development Commission
x Pilbara Development Commission: REMPLAN Economic Profile
xi World Bank - December 19, 2019
xii Department of Primary Industries and Regional Development; Regional Price Index 2019
xiii ABS data
xiv A working week of 40 hours has been used to convert hourly rates to full time equivalents
xv Information supplied by PDC January 2020
xvi The biannual Pilbara Housing and Land Snapshot produced by the Pilbara Development Commission
xvii Discussions with Pilbara Estate Agents
xviii ACCC report on Northern Australia Insurance Inquiry 2019 analysis based on data provided by Insurers
xix Data sourced from Water Corporation
xx 2015 to 2025 Resource Sector Outlook of the WA Chamber of Minerals and Energy
xxi Source: Horizon Power
xxii Data Source: The regional transport index produced by the Department of Primary Industries and Regional Development (DPIRD) gives an
indication of the relative cost of transportation for businesses in regional areas throughout Western Australia.
xxiii Data sources for fuel: Fuel Watch.
xxiv Data sources car hire websites
xxv Airline websites
20 THE COST OF DOING BUSINESS IN THE PILBARAAcknowledgements RDA Pilbara would like to acknowledge Imani Development Austral Pty Ltd and thank them for the research and consultation involved in developing this Annex and the Cost of Doing Business in the Pilbara Reports and Turner Design for the layout design and presentation of the document. THE COST OF DOING BUSINESS IN THE PILBARA 21
You can also read