Optimal strategies to screen health care workers for COVID-19 in the US: a cost-effectiveness analysis
←
→
Page content transcription
If your browser does not render page correctly, please read the page content below
Optimal strategies to screen health care workers for
COVID-19 in the US: a cost-effectiveness analysis
Sigal Maya ( Sigal.Maya@ucsf.edu )
University of California San Francisco
Guntas Padda
University of California San Francisco
Victoria Close
University of Vermont College of Medicine
Trevor Wilson
San Joaquin General Hospital
Fareeda Ahmed
Stanford University Graduate School of Business
Elliot Marseille
Health Strategies International
James G. Kahn
University of California San Francisco
Research Article
Keywords: covid-19, sars-cov-2, health care workers, cost-effectiveness, screening
Posted Date: September 10th, 2021
DOI: https://doi.org/10.21203/rs.3.rs-887590/v1
License: This work is licensed under a Creative Commons Attribution 4.0 International License.
Read Full License
Page 1/25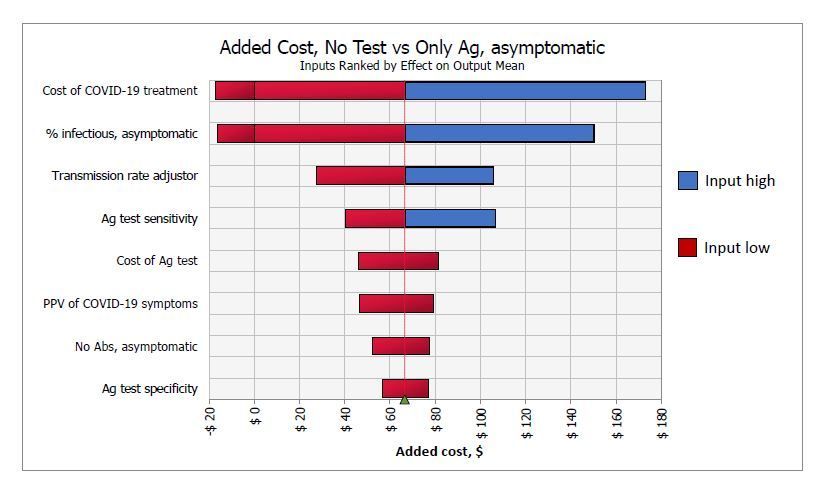
Abstract
Background: Transmission of SARS-CoV-2 in health care facilities poses a challenge against pandemic
control. Health care workers (HCWs) have frequent and high-risk interactions with COVID-19 patients. We
undertook a cost-effectiveness analysis to determine optimal testing strategies for screening HCWs to
inform strategic decision-making in health care settings. Methods: We modeled the number of new
infections, quality-adjusted life years lost, and net costs related to six testing strategies including no tests.
We applied our model to four strata of HCWs, defined by the presence and timing of symptoms. We
conducted sensitivity analyses to account for uncertainty in inputs. Results: When screening recently
symptomatic HCWs, conducting only a PCR test is preferable; it saves costs and improves health
outcomes in the first week post-symptom onset, and costs $83,000 per quality-adjusted life year gained in
the second week post-symptom onset. When screening HCWs in the late clinical disease stage, none of
the testing approaches is cost-effective and thus no testing is preferable, yielding $11 and 0.003 new
infections per 10 HCWs. For screening asymptomatic HCWs, antigen testing is preferable to PCR testing
due to its lower cost. Conclusions: Both PCR and antigen testing are beneficial strategies to identify
infected HCWs and reduce transmission of SARS-CoV-2 in health care settings. IgG testing clinical value
depends on test timing and immunity characteristics, however is not cost-effective in a low prevalence
setting. As the context of the pandemic evolves, our study provides insight to health-care decision makers
to keep the health care workforce safe and transmissions low.

Introduction
In December 2019, a novel zoonotic coronavirus, SARS-CoV-2, emerged in Wuhan, China, and became a
global pandemic [1,2]. With over 82 million confirmed cases and nearly two million fatalities worldwide as
of December 30, 2020, it has surpassed the impact of the severe acute respiratory syndrome epidemic of
2002 [3,4]. In March 2020, outbreaks of COVID-19, the disease caused by SARS-CoV-2, started occurring
in the United States. The country soon had the highest number of COVID-19 cases and fatalities
worldwide [3,5].

COVID-19 usually initiates as a lower respiratory infection causing mild to severe pneumonia in most
cases and inducing multi-organ systemic effects in some. Asymptomatic infection is common, although
uncertainty exists on its prevalence with estimates between 20% to 80% [6,7]. When undetected,
asymptomatic infections increase the likelihood of further transmission, emphasizing the need for
widespread screening [7]. Health care workers (HCWs) represent a vulnerable population in the context of
COVID-19. Due to the nature of their work, they are at heightened risk of SARS-CoV-2 exposure [8,9].
Screening HCWs for SARS-CoV-2 infection is important in preventing new infections and deaths both in
health care facilities and among community members of HCWs.

One approach to screen for SARS-CoV-2 is to assess the presence of viral RNA using polymerase chain
reaction (PCR) tests, which can provide important information on infection status and allow infected
HCWs to self-isolate [10]. However, as the pandemic progressed, health care facilities across the US faced

                                                    Page 2/25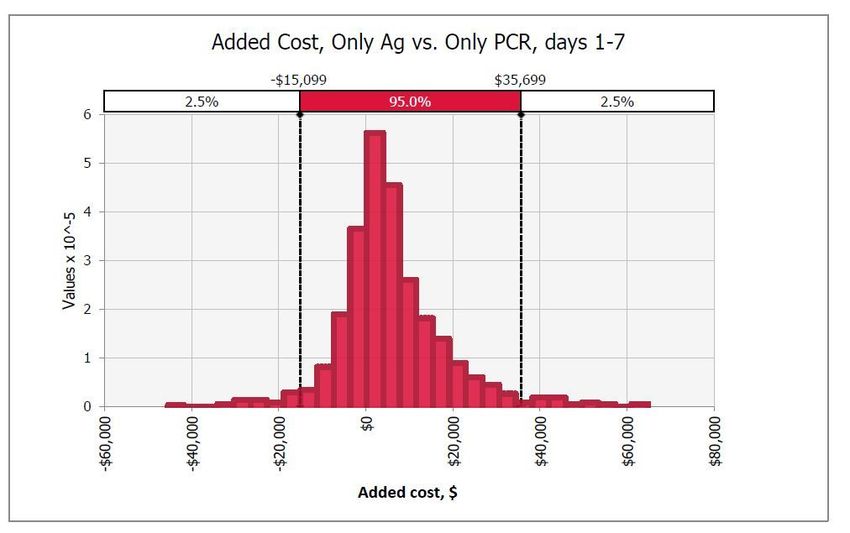
shortages of PCR testing supplies [11]. Furthermore, a positive PCR test does not necessarily indicate
transmissible virus: individuals infected with SARS-CoV-2 may remain PCR-positive for over a month,
long after they have cleared active infection [6,12].
An alternative to PCR tests for screening purposes is rapid antigen (Ag) tests. While these tests have
lower sensitivity than PCR, they can identify individuals who have high enough viral loads to transmit
infection [13,14]. Ag tests are relatively inexpensive ($5) and provide results in 15 minutes [15].
Finally, while not useful for screening for active infection, antibody tests (specifically tests that detect
SARS-CoV-2-specific immunoglobulin G [IgG]) can be administered to identify immune HCWs and inform
strategic workforce management decisions. Knowledge of antibody status could allow selective
assignment of HCWs who have immunity against SARS-CoV-2 to care for COVID-19 patients, thereby
lowering the risk of transmission. Yet, there is limited information on how long immunity lasts or if
antibodies reliably assess immunity [16–18].
Variable performance of available tests and complex patterns of biological markers also pose significant
challenges to health care officials as they attempt to identify optimal screening strategies [19]. The risks
associated with false test results, such as providing false reassurances of immunity (false-positive IgG
tests) or unnecessary isolation of HCWs (false-positive PCR or Ag tests), should be considered when
developing optimal screening strategies for this population. In this study, we used cost-effectiveness
analysis to determine the most effective use of these tests.
While the development of SARS-CoV-2 vaccines have rapidly and significantly changed the context of this
pandemic, the subsequent emergence of new SARS-CoV-2 strains highlights the possibility that other
SARS-CoV-2 variants may emerge in the future that may not be vaccine-susceptible [20]. In the meantime,
HCWs continue to be at risk of contracting the virus as the vaccines are being rolled out [21]. As such, it
remains crucial to have measures in place to keep the health care workforce safe and reduce
transmissions in the workplace and the community.
Methods
Overview
We conducted a decision model-based cost-effectiveness analysis to identify optimal COVID-19
screening strategies for HCWs. We divided the population into susceptible, infected, and recovered
(including vaccinated). To portray the evolution of viral detectability and infectivity through the course of
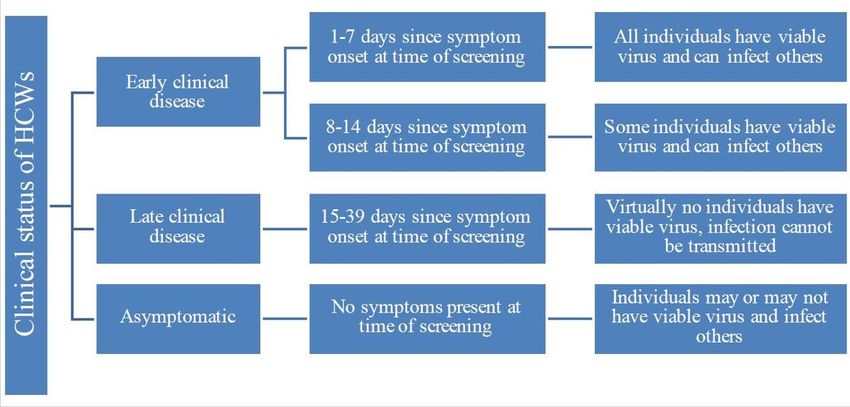
infection, we stratified our population into four groups based on symptom status and duration at time of
screening (Fig 1). Asymptomatic individuals were those without COVID-19 symptoms (i.e., including pre-
symptomatic), regardless of history of known or suspected COVID-19 exposure. We designed a decision
tree incorporating test performance as well as a set of specified actions based on test results. We
estimated and compared the number of new infections acquired, quality-adjusted life years (QALYs) lost,
and net costs associated with one-time testing using six testing options: (1) no tests, (2) only PCR test,
Page 3/25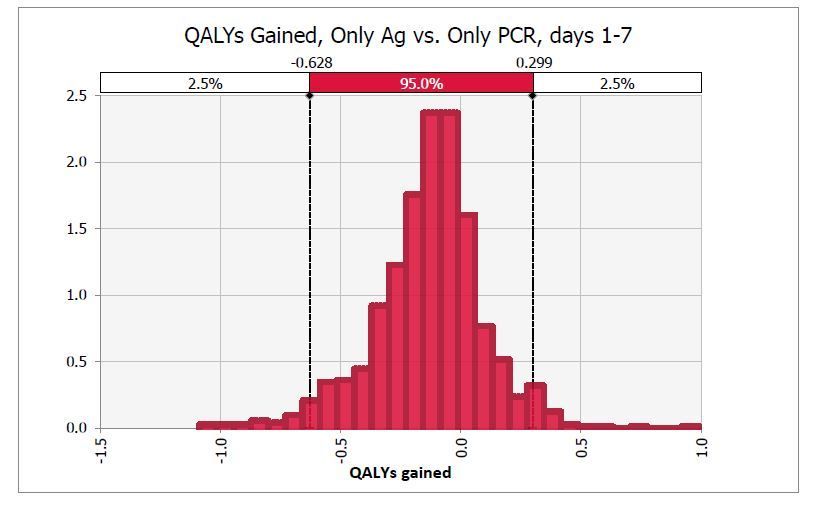
(3) only Ag test (4) only IgG test, (5) conditional PCR test if IgG test is positive, and (6) concurrent IgG and
PCR tests. We calculated incremental cost-effectiveness ratios (ICERs) where appropriate and conducted
extensive sensitivity analyses. The model was implemented in Excel® (Office 365, Microsoft Corporation)
and used @RISK® (Palisade Corporation, version 7.6.1) software for sensitivity analyses.

Decision tree design
The decision model incorporates three possible COVID-19 infection states and associated serological
profiles, representing the true biological profile of a HCW which is unknown at time of screening (see S1
File). Six different screening strategies (including no screening) were considered. We model the
probability of receiving positive or negative test results as dictated by test sensitivity and specificity.
According to test results, HCWs take different specified actions, yielding varying rates of transmission.
We calculate number of new infections acquired, QALYs lost, and net costs incurred for each screening
strategy. A simplified version of the decision tree is presented in S1 File, Appendix G.

Key assumptions
We made several assumptions in constructing the model: (1) Recovered (including vaccinated)
individuals have immunity for COVID-19 of 85% [25] (varied in sensitivity analyses). (2) Individuals who
have been infected shed viable SARS-CoV-2 for approximately eight days post-symptom onset, after
which the probability of shedding viable virus decreases significantly. Positive PCR (but nog Ag test) past
the duration of infectiousness is due to viral RNA fragments [6,12,22,23]. We explore different durations
of shedding viable virus. (3) HCWs who know their viral and antibody status behave differently from
those who do not. Those who believe they have recovered take more risks than those with no information.
(4) Individuals with SARS-CoV-2 infection cannot acquire a second infection while carrying infectious
virus.

Model inputs
The parameter values used in the model are based on extensive literature reviews and personal
communications with experts. To account for uncertainty, inputs were varied widely (Table 1).

Health
Three possible states were defined for true disease status. Susceptible individuals were defined as those
who had never been infected with SARS-CoV-2, those who had recovered but never developed antibodies,
or those who had recovered but whose antibodies have waned. These HCWs could acquire but could not
transmit virus. Infected individuals were defined as individuals who were actively infected with SARS-
CoV-2 and could transmit. They may or may not have produced IgG. Recovered individuals were defined
                                                   Page 4/25
as those who have SARS-CoV-2 antibodies, either due to vaccination or a previous infection. This does
not necessarily indicate clinical recovery. These HCWs could not transmit SARS-CoV-2 and had a lower
probability of acquiring virus than susceptible HCWs. Further details provided in S1 File Appendix A.
Inferred disease status of a HCW was determined by test results and did not always match true disease
status due to false positive and false negative results (see S1 File Appendix B). Mismatches between true
and inferred status have the potential to increase transmission or incur unnecessary precautions.
Inferences of disease status led to different actions. Infected HCWs were isolated. In health care settings,
susceptible HCWs were more likely to be assigned to COVID-19 “cold zones” (no COVID-19 patients) and
recovered HCWs were more likely to be assigned to COVID-19 “hot zones” (only COVID-19 patients). In
community settings, susceptible HCWs were more likely to take rigorous COVID-19 precautions while
recovered or vaccinated HCWs were likely less strict. More can be found in S1 File Appendices C and D).
While we did not explicitly model different infection mitigation measures (e.g., social distancing, mask
wearing, or frequent hand washing), the effect of these measures on SARS-CoV-2 transmission was
implicitly taken into account through the use of the current effective reproduction number to calculate the
number of secondary infections.
Efficacy
While COVID-19 PCR tests are reported to have a sensitivity of only about 70% [31–33], this is attributable
to the problematic timing of test administration [45]. Indeed, PCR assays are often described as having
high sensitivity, usually above 90% [29,30,46]. However, if an individual is tested shortly after exposure, a
negative result is likely as viral load may be too low to detect [30,45]. A positive PCR test result is also not
necessarily indicative of viable SARS-CoV-2 [12,22,23]. Herein, sensitivity was estimated as 95% and did
not vary by time since symptom onset [29,30]. PCR sensitivity for asymptomatic HCWs was 70% to
account for false negative results early in the infection when the individual does not have sufficient viral
load [31–33]. For specificity, we used data on the ability to grow viral cultures to estimate the likelihood of
having viable virus at different timepoints post-symptom onset [24]. Specificity of PCR testing was varied
between 11-99% based on the probability of detecting viable SARS-CoV-2 as opposed to viral RNA
fragments. Specificity was calculated as 62% on average for asymptomatic individuals (see S1 File
Appendix E).
Specifications of the Ag and IgG tests were determined via literature review and are shown in Table.
Costs
Testing costs for both IgG and PCR tests include cost of testing supplies (swabs, chemical reagents) and
human resource costs. The PCR test cost $51 per test and the IgG test was $42, while the Ag test cost $5
[35]. Our base-case assumed that tests would be conducted in-house where equipment and trained
Page 5/25personnel is readily available. Costs could differ if testing is outsourced; this was assessed in sensitivity
analyses.
COVID-19 treatment costs differ greatly depending on disease severity. Some infected individuals remain
asymptomatic and generate no costs, others may require ambulatory or critical care. We used a weighted
mean of costs incurred with varying levels of care [34] (see S1 File Appendix F).
Model outputs
The number of new infections over two weeks was calculated for each probability path using the
likelihood of transmission in health care and community settings given different actions taken by HCWs.
An indirect transmission multiplier was set as two to account for the remaining infections in the chain.
The number of QALYs lost are calculated for each strategy. QALYs are a standardized measure
incorporating morbidity and mortality due to a disease or condition. We used an estimate of 5.52
discounted QALYs lost due to one COVID-19 death (based on US life tables and age distribution of COVID-
19 mortality, discount rate 3%) [42,47], multiplied by an infection fatality rate estimate of 0.5% [43,44]. To
account for the growing evidence of long-term morbidity, we added an estimated 0.05 additional QALYs
per infection [48–51]. We investigated the effect of differing these values in sensitivity analyses.
Net costs included screening and medical costs and were not discounted since all costs were incurred in
year one. Medical costs associated with long-term complications were not included due to a paucity of
data; this was investigated in sensitivity analyses.
ICERs, expressed as net costs per QALY saved, were calculated when a strategy had higher costs and
better outcomes than another. Strategies associated with lower costs and more QALYs saved were
dominant; no ICERs were calculated.
Sensitivity analyses
Extensive one-way and multi-way sensitivity analyses were conducted. Sensitivity ranges for
deterministic analyses were informed by the low and high estimates reported in relevant literature. Monte
Carlo simulations with 1,000 iterations were run for probabilistic sensitivity analyses, with beta
distributions for probabilities. Namely, we addressed the uncertainty around treatment costs, test
performance, and prevalence of COVID-19 among HCWs.
Results
Base case
Page 6/25We present results separately for asymptomatic HCWs and each of the three clinical periods in which a
test may be administered as described in Fig 1. Major findings are presented in Tables 2-5, and
summarized in Table 6. Further details may be found in S2 File.
Early clinical period, days 1-7
For ten HCWs who have started experiencing symptoms in the past seven days, conducting no screening
results in 24.8 new infections and 1.925 QALYs lost, generating a net cost of $82,000. This is the least
effective option, and it is dominated by PCR-only testing which identifies and mandates isolation for
infectious HCWs (Table 2).
Administering only a PCR test is cheaper and more effective than all other strategies except for IgG + PCR
testing. While IgG + PCR testing has a small health benefit over only PCR testing, this benefit is so small
that the ICER is over $1 million per QALY gained. As such, PCR-only testing is preferred to IgG + PCR, and
strictly dominant over the remaining options. For every ten HCWs that are tested with PCR only, the net
cost is $4,600 with estimated 1.24 new infections, or 0.097 QALYs lost (Table 2). PCR testing only also
results in 0.032 HCWs unnecessarily being taken off the health care workforce for two weeks for every ten
HCWs that are tested during their first week of symptoms.
Table 2. Results for screening ten HCWs on day 1-7 of having symptoms.
Option Net Cost ∆Costs QALYs Lost ∆QALYs Lost ICER ($/QALYs)
Only PCR $4,633 n/a 0.09661 n/a n/a
IgG + PCR $5,037 $404 0.09624 0.00037 $1,081,393
Only Ag $8,293 $3,660 0.19313 -0.09652 Dominated
IgG, if positive PCR $64,297 $59,664 1.49459 -1.39798 Dominated
No Test $82,172 $77,539 1.92529 -1.82868 Dominated
Only IgG $82,497 $77,863 1.92305 -1.82644 Dominated
Almost all infected individuals have viable virus at this time and positive PCR test results are treated as
true positives, indicating isolation. Ag, antigen; ICER, incremental cost-effectiveness ratio; IgG,
immunoglobulin G; PCR, polymerase chain reaction; QALY, quality-adjusted life year; ∆: difference.
Early clinical period, days 8-14
Results for screening HCWs in their second week post-symptom onset resemble those of HCWs who have
been symptomatic more recently, as explained above. Since individuals are more likely to clear infectious
virus by this time, the number of new infections and associated costs are significantly lower across all
screening approaches compared to HCWs being screened earlier in the course of infection (Table 3). At
Page 7/25this stage PCR testing is no longer dominant, but it is the most cost-effective strategy with an ICER of $35
thousand per QALY gained.
Table 3. Results for screening ten HCW on day 8-14 of having symptoms.
Option Net Cost ∆Cost QALYs Lost ∆QALYs Lost ICER ($/QALYs)
Only Ag $353 n/a 0.00709 n/a n/a
Only PCR $560 $207 0.00117 0.00592 $34,980
IgG, if positive PCR $836 $277 0.00860 -0.00743 Dominated
IgG + PCR $979 $419 0.00116 0.00001 $34,048,150
No Test $981 $421 0.02299 -0.02182 Dominated
Only IgG $1,393 $833 0.02279 -0.02163 Dominated
Some infected individuals have viable virus at this time and positive PCR test results are treated as true
positives, indicating isolation. Ag, antigen; ICER, incremental cost-effectiveness ratio; IgG,
immunoglobulin G; PCR, polymerase chain reaction; QALY, quality-adjusted life year; ∆: difference.
Late clinical period
Not screening ten HCWs in later stages of clinical disease leads to 0.003 additional infections and 0.0003
lost QALYs, and generates a net cost of $11 due to susceptible HCWs acquiring SARS-CoV-2 (Table 4). At
this stage, no test is the is the dominant strategy. While testing strategies that include Ag or IgG tests
provide some minor health benefits compared to no test, these benefits are so small that the cost per
QALY gained for all these options are in the order of millions, thus they are not cost-effective. PCR-only
testing slightly increases the number of QALYs lost compared to no test due to susceptible HCWs
receiving false positive test results and assuming they are protected from infection.
Table 4. Results for screening ten HCW on day 15-39 of having symptoms.
Option Net Cost ∆Cost QALYs Lost ∆QALYs Lost ICER ($/QALYs)
No Test $11 n/a 0.00027 n/a n/a
Only Ag $61 $49 0.00025 0.00001 $3,909,046
Only IgG $431 $420 0.00026 0.00001 $37,917,445
IgG, if positive PCR $483 $472 0.00026 0.00001 $42,650,284
Only PCR $522 $511 0.00028 -0.00001 Dominated
IgG + PCR $941 $930 0.00026 0.00001 $84,011,883
Page 8/25No infected individuals have viable virus at this time and positive PCR test results are treated as false
positives; does not indicate isolation. Ag, antigen; ICER, incremental cost-effectiveness ratio; IgG,
immunoglobulin G; PCR, polymerase chain reaction; QALY, quality-adjusted life year; ∆: difference.
Asymptomatic
Not screening asymptomatic HCWs leads to 0.03 new infections, 0.002 QALYs lost and $104 in net costs
per ten HCWs (Table 5). Administering an Ag test is the dominant approach for asymptomatic screening
costing $86 per ten HCW tested. Both PCR-only and IgG+PCR screening are slightly more effective than
Ag-only, however they have a significantly higher net costs leading to large ICERs of $8-13 million per
QALY gained.
Table 5. Results for screening ten asymptomatic HCWs.
Option Net Cost ∆Cost QALYs Lost ∆QALYs Lost ICER ($/QALYs)
Only Ag $86 n/a 0.00084 n/a Dominant
No Test $104 $18 0.00244 -0.00160 Dominated
Only IgG $523 $437 0.00242 -0.00158 Dominated
Only PCR $543 $457 0.00078 0.00006 $7,746,741
IgG, if positive PCR $704 $618 0.00137 -0.00053 Dominated
IgG + PCR $963 $877 0.00078 -0.00007 $13,370,356
Infected individuals may or may not have viable virus and positive PCR test results are treated as true
positives, indicating isolation. Ag, antigen; ICER, incremental cost-effectiveness ratio; IgG,
immunoglobulin G; PCR, polymerase chain reaction; QALY, quality-adjusted life year; ∆: difference.
Table 6. Summary of results.
Page 9/25Clinical Status Base Case Uncertainty
Result
Early clinical Only PCR, PCR testing is 74% likely to save QALYs but only 26% likely to
period, days 1- dominant save costs due to variations in test sensitivities.
7
Early clinical Only PCR, PCR-only is 34% likely to be dominant over Ag testing, if
period, days 8- transmissible infection persists into second week post-symtpom
14 $34,000/QALY onset. As this duration decreases, cost-effectiveness of PCR
gained testing also decreases, but remains below $180,000/QALY gained
with 50% likelihood.
Late clinical No Test, No other testing strategy is cost-effective. The magnitude of
period dominant ICERs depend on QALYs lost per infection and transmission rate
of SARS-CoV-2.
Asymptomatic Only Ag, 25% likelihood of being cost-effective (rather than dominant),
dominant depending on prevalence of transmissible infection among
asymptomatic HCWs and medical costs.
Ag, antigen; ICER, incremental cost-effectiveness ratio; PCR, polymerase chain reaction; QALY, quality-
adjusted life year.
Sensitivity Analyses
Sensitivity analyses reveal little variation in outcomes with changing inputs. For HCWs in the first week of
having symptoms, PCR testing was 74% likely to save more QALYs than Ag testing, but only 26% likely to
be cheaper (Figs 2 and 3). Both of these outcomes were most dependent on PCR and Ag test sensitivity
which accounted for 45% to 29% of variance.
When testing in the second week, PCR testing remained the preferable strategy but with decreasing cost-
effectiveness (ICERs up to $750 thousand per QALY saved), primarily due to the prevalence of
transmissible infection in this group which accounted for 23-32% of variance.
In the late clinical disease stage, Ag testing always saved QALYs compared to no test but was not cost-
effective due to very small health gains. PCR-only testing in this group had a 12% probability of saving
QALYs compared to no testing (as opposed to increasing health losses in base-case), however these
gains also were not large enough to render PCR cost-effective over no testing. Thus, no testing remained
the optimal strategy. In all three groups of symptomatic HCWs, IgG+PCR testing led to small QALY gains
that were dominated by others. Remaining strategies that did not include viral tests (either PCR or Ag)
were dominated in simulations.
For asymptomatic screening, Ag tests always saved QALYs compared to no testing but was more
expensive in 25% of simulations when COVID-19 treatment costs or prevalence was low (Fig 4). In these
cases, Ag testing was cost-effective with ICERs up to $80 thousand per QALY gained (as opposed to
dominant in base-case). Inputs that most affected this ICER were cost of COVID-19 treatment and
Page 10/25prevalence of transmissible infection among asymptomatic individuals, which accounted for 41% and
19% of variance, respectively. Comparing PCR-only to Ag testing, the former had a 65% probability of
saving QALYs over Ag testing, however was not cost-effective due to small health gains and large
incresases in net costs.
Discussion
This study assessed the cost-effectiveness of six screening approaches for HCWs in the US using one-
time PCR, Ag, and/or IgG assays under varying conditions based on clinical presentation. When the
prevalence of COVID-19 is low, findings suggest that the best screening approach for recently
symptomatic HCWs is PCR testing. Symptomatic HCWs in the first or second week, if truly infected with
SARS-CoV-2, are more likely to be infectious than those in the later stages of clinical disease, and
isolating these individuals is more important in reducing transmission than knowing their antibody
status. Notably, studies have shown Ag test sensitivity approaches that of PCR when testing those within
first week of symptoms [27,28]. In this case, Ag testing might be a promising alternative for screening for
its lower cost and faster turnaround time. Indeed, our sensitivity analyses show variable health gains and
cost savings with these two tests, suggesting the possibility of Ag testing being dominant (cheaper and
more effective) over PCR-only.
Coupling PCR testing with an IgG test provides a minute health gain due to fewer susceptible HCWs being
assigned to COVID-19 “hot zones” where risk of acquiring infection is higher. Yet, IgG + PCR testing is not
a cost-effective option, as the additional net cost of this strategy is prohibitive.
Conversely, for HCWs in late clinical disease, the risk of still being infectious is low, and knowledge of
antibody status is more helpful to reduce transmission by strategic workforce management if long-
lasting immunity is conferred. As the course of the infection progresses, IgG titer levels increase. As such,
its utility increases over time. Previous studies on antibody responses to SARS-CoV-2 also recommend
conducting IgG tests around the third week of infection due to higher detection rates at this time [38]. Yet,
with ICER’s over $30 million per QALY gained, strategies incorporating IgG tests are still not cost-effective
in late clinical disease because of the low prevalence of COVID-19. Notably, PCR testing in late clinical
disease leads to poorer health outcomes than no screening at all. A positive PCR result for HCWs who are
three or more weeks post-symptom onset is interpreted as a false positive (i.e., due to viral fragments, not
transmissible). These individuals are falsely reassured that they have recovered from COVID-19 and
therefore are protected. They may have lower fidelity to personal protective equipment and may take
more risks, leading to a slight increase in the number of new infections. A positive Ag test is not
interpreted as a false-positive at this stage (even though it may be), because unlike PCR tests, Ag test are
not suspect of detecting low and non-transmissible viral loads.
For screening asymptomatic HCWs, Ag testing is preferable over others. It is cheaper and and more
effective than most other testing strategies. PCR-only testing saves additional QALYs, however the high
cost of PCR compared to Ag tests leads to a high ICER that is not cost-effective. Testing strategies that
Page 11/25include antibody testing are all dominated by PCR-only testing, because false positive antigen tests of
asymptomatic HCWs lead to false reassurances of protection and more risk-taking.
Findings of robust memory T cell responses to SARS-CoV-2 in the absence of antibodies suggest that
seronegative individuals may also be protected from reinfection [52]. This emphasizes the possibility of
controlling transmission in health care settings by strategic decision-making. However, it also indicates
that the proportion of HCWs who are immune might have been underestimated in this study, leading to
underestimated cost-effectiveness of all screening strategies. Different ways of assessing immunity may
increase effectiveness of strategic workforce management in lowering transmissions of SARS-CoV-2 in
health care settings.
Our analysis provides insight for health care decision makers. We highlight the importance of scaling up
PCR and Ag testing to identify infectious HCWs to reduce spread of infection in health care and
community settings. We also demonstrate the potential benefits of strategic scheduling of HCWs while
noting that long-term seroprevalence and immunological studies are needed before policy
recommendations can be given with confidence. While this analysis does not find antibody testing cost-
effective for HCWs, this strategy does allow reductions in transmission to and from HCWs in late clinical
disease. This suggests that alternative ways of assessing immunity may provide a cost-effective
approach to informing workforce management decisions to reduce spread.
Limitations
Uncertainty, while always an issue in cost-effectiveness analyses, is particularly a concern here, given the
limited epidemiological and clinical information on COVID-19. We therefore made several assumptions
based on characteristics of other similar pathogens, such as SARS, and used informed estimates for data
inputs. Specifically, the definition we used for PCR specificity based on infectivity rather than being
infected introduced some uncertainty. To address this limitation, we consulted with experts between
March-July 2020 and conducted sensitivity analyses using wide ranges for these inputs. We found that
varying these key inputs did not substantially change findings.
Second, the simulated IgG test provides a quantitative measure of IgG and does not differentiate between
neutralizing and non-neutralizing antibodies. The immunologic ramifications of having IgG are also not
yet fully understood. Our base-case analysis assumes high protection but does not make any conjectures
about duration of immunity. If IgG provides transient protection, then the falsely reassuring effect of IgG
testing across all four strata of HCWs would increase over time.
Third, this study does not incorporate the loss of productivity due to unnecessary isolation of HCWs. It is
plausible that given this inefficiency, PCR testing may not be a dominant screening approach.
Nonetheless, PCR testing would remain the most effective strategy to decrease the number of new
infections because it would still identify the most cases. Studies assessing screening strategies for the
Page 12/25general workforce and college campuses corroborate that PCR screening is a cost-effective option
compared to options such as symptom or fever screening [53,54].
Fourth, the utility of Ag testing is debated. The test’s analytical sensitivity is poor, while it can more
accurately identify higher viral loads which are more likely to be transmissible. This suggests that our
model underestimates the cost-effectiveness of Ag testing for asymptomatic HCWs, and that it is an even
more preferable strategy for this group than we estimate.
Finally, we recognize that some oversimplifications were made. The decisions we modeled are based
solely on test results, whereas in reality these test results would be considered alongside exposure history
among other factors that may influence health outcomes.
While these uncertainties are real, we believe that our assumptions and estimates reflect the best
available evidence at the time of this writing. As new information becomes available, the interpretation of
our results will likely change.
Future work
There is much to be discovered regarding SARS-CoV-2 and COVID-19, and new findings must be
integrated into this analysis to improve the accuracy of inputs and results. If other testing approaches
become available, these should considered in the model. This analysis reflects cost-effectiveness of
screening strategies in the US where the prevalence of COVID-19 is low. The results and their
interpretation will differ in other settings where conditions may be different. As the pandemic moves
through more vulnerable regions, it will be critical to apply this analysis to different populations to help
ensure that critical resources are allocated optimally.
Conclusion
As a result of the COVID-19 pandemic, resource shortages occurred throughout the US. We conducted a
cost-effectiveness analysis to understand the optimal allocation of testing resources for COVID-19 to
screen HCWs and to inform workforce management decisions. Our results suggest that the screening
approach should be different depending on the clinical presentation of HCWs being screened. Among the
testing strategies analyzed, PCR testing is the dominant approach for HCWs who started seeing COVID-
19 symptoms in the past 1-14 days, whereas Ag tests should be preferred for asymptomatic HCWs. For
those who are more than 15 days post-symptom onset, PCR testing has low utility and IgG testing is too
expensive; no testing is the optimal approach. These findings are based on US-specific inputs and several
key assumptions. As the body of evidence grows, these findings should be reviewed and updated.
Declarations
Ethics approval and consent to participate
Page 13/25Not applicable.
Consent for publication
Not applicable.
Availability of data and materials
All data generated or analysed during this study are included in this published article and its
supplementary information files.
Competing interests
The authors declare that they have no competing interests.
Funding
This work was supported by the National Institute on Drug Abuse grant number 5R37DA015612-170. The
funder did not play a role in the design of the study, and collection, analysis, and interpretation of data,
and in writing the manuscript.
Authors’ contributions
TW and JGK conceived the study and guided the work. SM conducted all analyses, wrote the first draft of
the manuscript, and completed final editing. All authors contributed to study design, data collection and
analysis, and preparation of the manuscript.
Acknowledgements
We thank G Rutherford, N Martin, and E Bendavid for advice and input on the analyses and manuscript.
Abbreviations
Page 14/25Ag, antigen; COVID-19, coronavirus disease 2019; HCW, health care worker; ICER, incremental cost-
effectiveness ratio; IgG, immunoglobulin G; PCR, polymerase chain reaction; QALY, quality-adjusted life
year; SARS-CoV-2, severe acute respiratory syndrome coronavirus 2.
References
1. Pneumonia of unknown cause – China [Internet]. WHO. World Health Organization; 2020 [cited
2020 May 20]. Available from: https://www.who.int/csr/don/05-january-2020-pneumonia-of-unkown-
cause-china/en/
2. Phelan AL, Katz R, Gostin LO. The Novel Coronavirus Originating in Wuhan, China: Challenges for
Global Health Governance. JAMA. 2020 Feb 25;323(8):709–10.
3. COVID-19 Dashboard by CSSE at Johns Hopkins University [Internet]. 2020 [cited 2020 Jun 12].
Available from: https://coronavirus.jhu.edu/map.html
4. NHS. SARS (severe acute respiratory syndrome) [Internet]. 2019 [cited 2020 Jun 12]. Available
from: https://www.nhs.uk/conditions/sars/
5. Taylor DB. How the Coronavirus Pandemic Unfolded: a Timeline. The New York Times [Internet].
2020 May 12 [cited 2020 May 21]; Available from: https://www.nytimes.com/article/coronavirus-
timeline.html
6. Position Statement from the National Centre for Infectious Diseases and the Chapter of
Infectious Disease Physicians, Academy of Medicine, Singapore - 23 May 2020. 2020.
7. Nishiura H, Kobayashi T, Miyama T, Suzuki A, Jung S mok, Hayashi K, et al. Estimation of the
asymptomatic ratio of novel coronavirus infections (COVID-19). Int J Infect Dis. 2020 May 1;94:154–5.
8. Schwartz J, King C-C, Yen M-Y. Protecting Healthcare Workers During the Coronavirus Disease
2019 (COVID-19) Outbreak: Lessons From Taiwan’s Severe Acute Respiratory Syndrome Response. Clin
Infect Dis [Internet]. 2020 [cited 2020 Jun 2]; Available from: https://academic.oup.com/cid/advance-
article-abstract/doi/10.1093/cid/ciaa255/5804239
9. Nguyen LH, Drew DA, Graham MS, Joshi AD, Guo C-G, Ma W, et al. Risk of COVID-19 among front-
line health-care workers and the general community: a prospective cohort study. Lancet Public Heal
[Internet]. 2020 Sep 1 [cited 2021 May 24];5(9):e475–83. Available from: www.thelancet.com/public-
health
10. Hadaya J, Schumm M, Livingston EH. Testing Individuals for Coronavirus Disease 2019 (COVID-
19). JAMA. 2020 May 19;323(19).
11. Canipe C, Hartman T. The COVID-19 testing challenge [Internet]. Reuters Graphics. 2020 [cited
2020 Jun 8]. Available from: https://graphics.reuters.com/HEALTH-
Page 15/25CORONAVIRUS/TESTING/azgvomklmvd/
12. Atkinson B, Petersen E. SARS-CoV-2 shedding and infectivity. Lancet [Internet].
2020;395(10233):1339–40. Available from: http://dx.doi.org/10.1016/S0140-6736(20)30868-0
13. Mina MJ, Peto TE, García-Fiñana M, Semple MG, Buchan IE. Clarifying the evidence on SARS-
CoV-2 antigen rapid tests in public health responses to COVID-19. Lancet [Internet]. 2021 Feb 17 [cited
2021 Apr 29];397(10283):1425–7. Available from: https://doi.org/10.1093/eurheartj/ehaa575.
14. Johnson-León M, Caplan AL, Kenny L, Buchan I, Fesi L, Olhava P, et al. Executive summary: It’s
wrong not to test: The case for universal, frequent rapid COVID-19 testing. EClinicalMedicine [Internet].
2021 Feb 19 [cited 2021 Apr 29];33:100759. Available from:
https://doi.org/10.1016/j.eclinm.2021.100759
15. Westman N. FDA authorizes Abbott’s fast $5 COVID-19 test. The Verge [Internet]. 2020 [cited
2021 Jun 9]; Available from: https://www.theverge.com/2020/8/26/21403432/fda-authorizes-binaxnow-
covid-19-test-abbott-cheap-fast
16. Grzelak L, Temmam S, Planchais C, Demeret C, Huon C, Guivel-Benhassine F, et al. SARS-CoV-2
serological analysis of COVID-19 hospitalized patients, pauci-symptomatic individuals and blood donors.
medRxiv [Internet]. 2020 [cited 2020 May 28]; Available from:
https://doi.org/10.1101/2020.04.21.20068858
17. Wajnberg A, Mansour M, Leven E, Bouvier NM, Patel G, Firpo A, et al. Humoral immune response
and prolonged PCR positivity in a cohort of 1343 SARS-CoV 2 patients in the New York City region 2.
medRxiv [Internet]. 2020 [cited 2020 May 19]; Available from:
https://doi.org/10.1101/2020.04.30.20085613
18. Long QX, Liu BZ, Deng HJ, Wu GC, Deng K, Chen YK, et al. Antibody responses to SARS-CoV-2 in
patients with COVID-19. Nat Med. 2020 Apr 29;
19. Mandavilli A. Coronavirus Antibody Tests: Can You Trust the Results? [Internet]. The New York
Times. 2020 [cited 2020 Jun 12]. Available from:
https://www.nytimes.com/2020/04/24/health/coronavirus-antibody-tests.html
20. Seaman J. New, more contagious COVID-19 strain confirmed in Colorado. The Denver Post
[Internet]. 2020 Dec 29 [cited 2020 Dec 30]; Available from:
https://www.denverpost.com/2020/12/29/new-covid-19-variant-colorado/
21. Kelley A. ER nurse tests positive for COVID-19 a week after getting vaccine | TheHill [Internet]. The
Hill. 2020 [cited 2020 Dec 30]. Available from: https://thehill.com/changing-america/well-
being/longevity/532100-er-nurse-tests-positive-for-covid-19-a-week-after
Page 16/2522. Wölfel R, Corman VM, Guggemos W, Seilmaier M, Zange S, Müller MA, et al. Virological
assessment of hospitalized patients with COVID-2019. Nature [Internet]. 2020 [cited 2020 May
30];581:465. Available from: https://doi.org/10.1038/s41586-020-2196-x
23. Joynt GM, Wu WK. Understanding COVID-19: what does viral RNA load really mean? Lancet
Infect Dis [Internet]. 2020;3099(20):19–20. Available from: http://dx.doi.org/10.1016/S1473-
3099(20)30237-1
24. He X, Lau EHY, Wu P, Deng X, Wang J, Hao X, et al. Temporal dynamics in viral shedding and
transmissibility of COVID-19. Nat Med. 2020 May 1;26(5):672–5.
25. Hall VJ, Foulkes S, Charlett A, Atti A, Monk EJM, Simmons R, et al. SARS-CoV-2 infection rates of
antibody-positive compared with antibody-negative health-care workers in England: a large, multicentre,
prospective cohort study (SIREN). Lancet [Internet]. 2021 Apr 17 [cited 2021 May 24];397(10283):1459–
69. Available from: https://doi.org/10.1016/
26. EUA Authorized Serology Test Performance [Internet]. US Food and Drug Administration. [cited
2021 Jun 9]. Available from: https://www.fda.gov/medical-devices/coronavirus-disease-2019-covid-19-
emergency-use-authorizations-medical-devices/eua-authorized-serology-test-performance
27. Pollock NR, Jacobs JR, Tran K, Cranston AE, Smith S, O’Kane CY, et al. Performance and
Implementation Evaluation of the Abbott BinaxNOW Rapid Antigen Test in a High-Throughput Drive-
Through Community Testing Site in Massachusetts. J Clin Microbiol [Internet]. 2021 Feb 23 [cited 2021
Apr 28];59(5):83–104. Available from: http://jcm.asm.org/
28. Pilarowski G, Lebel P, Sunshine S, Liu J, Crawford E, Marquez C, et al. Performance
Characteristics of a Rapid Severe Acute Respiratory Syndrome Coronavirus 2 Antigen Detection Assay at
a Public Plaza Testing Site in San Francisco. J Infect Dis. 2021;223(7):1139–44.
29. Shen M, Zhou Y, Ye J, Abdullah AL-maskri AA, Kang Y, Zeng S, et al. Recent advances and
perspectives of nucleic acid detection for coronavirus [Internet]. Vol. 10, Journal of Pharmaceutical
Analysis. Xi’an Jiaotong University; 2020 [cited 2020 Jun 24]. p. 97–101. Available from:
/pmc/articles/PMC7102540/?report=abstract
30. Tahamtan A, Ardebili A. Real-time RT-PCR in COVID-19 detection: issues affecting the results
[Internet]. Vol. 20, Expert Review of Molecular Diagnostics. Taylor and Francis Ltd; 2020 [cited 2020 Jun
24]. p. 453–4. Available from: https://www.ncbi.nlm.nih.gov/pmc/articles/PMC7189409/
31. Reddy KP, Shebl FM, Foote JHA, Harling G, Scott JA, Panella C, et al. Cost-effectiveness of public
health strategies for COVID-19 epidemic control in South Africa: a microsimulation modelling study.
Lancet Glob Heal [Internet]. 2021 Feb 1 [cited 2021 Jun 9];9(2):e120–9. Available from:
https://pubmed.ncbi.nlm.nih.gov/33188729/
Page 17/2532. Yang Y, Yang M, Yuan J, Wang F, Wang Z, Li J, et al. Laboratory Diagnosis and Monitoring the
Viral Shedding of SARS-CoV-2 Infection. Innovation. 2020 Nov 25;1(3):100061.
33. Wang W, Xu Y, Gao R, Lu R, Han K, Wu G, et al. Detection of SARS-CoV-2 in Different Types of
Clinical Specimens. JAMA [Internet]. 2020 May 12 [cited 2021 Jun 9];323(18):1843–4. Available from:
https://jamanetwork.com/
34. Rae M, Claxton G, Kurani N, McDermott D, Cox C. Potential costs of COVID-19 treatment for
people with employer coverage [Internet]. Peterson-KFF Health System Tracker. 2020 [cited 2020 Jun 24].
Available from: https://www.healthsystemtracker.org/brief/potential-costs-of-coronavirus-treatment-for-
people-with-employer-coverage/
35. Medicare Administrative Contractor (MAC) COVID-19 Test Pricing. 2021.
36. Satyanarayana M. COVID-19 antibody tests raise as many questions as they answer. C&EN Glob
Enterp [Internet]. 2020 Jun 3 [cited 2020 Jun 26];98(22):29–33. Available from:
https://pubs.acs.org/doi/10.1021/cen-09822-cover
37. Cairns E. Covid-19 antibody tests face a very specific problem [Internet]. Evaluate Vantage. 2020
[cited 2020 Jun 26]. Available from:
https://www.evaluate.com/vantage/articles/analysis/spotlight/covid-19-antibody-tests-face-very-
specific-problem
38. Zhao J, Yuan Q, Wang H, Liu W, Liao X, Su Y, et al. Antibody responses to SARS-CoV-2 in patients
of novel coronavirus disease 2019. Clin Infect Dis [Internet]. 2020 [cited 2020 May 19]; Available from:
https://academic.oup.com/cid/advance-article-abstract/doi/10.1093/cid/ciaa344/5812996
39. California For All. Tracking COVID-19 in California [Internet]. [cited 2021 Apr 28]. Available from:
https://covid19.ca.gov/state-dashboard/
40. California Department of Public Health. COVID-19 Seroprevalence Data [Internet]. 2021 Apr 15
[cited 2021 Apr 28]. Available from: https://www.cdph.ca.gov/Programs/CID/DCDC/Pages/COVID-
19/Sero-prevalence-COVID-19-Data.aspx
41. Centre for Mathematical Modelling of Infectious Diseases (CMMID). Covid-19: Estimates for
California (United States) [Internet]. 2021 [cited 2021 Apr 28]. Available from:
https://epiforecasts.io/covid/posts/subnational/united-states/california/
42. Avalon Health Economics. COVID-19 QALYs calculator. 2020.
43. Ioannidis JPA. The infection fatality rate of COVID-19 inferred from seroprevalence data.
medRxiv [Internet]. 2020 Jun 8 [cited 2020 Jul 2]; Available from:
https://doi.org/10.1101/2020.05.13.20101253
Page 18/2544. Mallapaty S. How deadly is the coronavirus? Scientists are close to an answer. Nature [Internet].
2020 Jun 16 [cited 2020 Jul 2]; Available from: https://www.nature.com/articles/d41586-020-01738-2
45. Chang D, Mo G, Yuan X, Tao Y, Peng X, Wang F-S, et al. Time Kinetics of Viral Clearance and
Resolution of Symptoms in Novel Coronavirus Infection. Am J Respir Crit Care Med [Internet]. 2020 [cited
2020 May 28];201(9):1150–2. Available from: www.atsjournals.org.
46. Wan Z, Zhang Y, He Z, Liu J, Lan K, Hu Y, et al. A Melting Curve-Based Multiplex RT-qPCR Assay
for Simultaneous Detection of Four Human Coronaviruses. Int J Mol Sci [Internet]. 2016 Nov 23 [cited
2020 Jun 24];17(11):1880. Available from: http://www.mdpi.com/1422-0067/17/11/1880
47. Briggs A. Moving Beyond “Lives-Saved” From COVID-19 [Internet]. Avalon Health Economics LLC.
2020 [cited 2020 Jul 2]. Available from: https://avalonecon.com/moving-beyond-lives-saved-from-covid-
19/
48. Helms J, Kremer S, Merdji H, Clere-Jehl R, Schenck M, Kummerlen C, et al. Neurologic Features in
Severe SARS-CoV-2 Infection. N Engl J Med [Internet]. 2020 Jun 4 [cited 2020 Jun 25];382(23):2268–70.
Available from: http://www.nejm.org/doi/10.1056/NEJMc2008597
49. Frontera J, Mainali S, Fink EL, Robertson CL, Schober M, Ziai W, et al. Global Consortium Study of
Neurological Dysfunction in COVID-19 (GCS-NeuroCOVID): Study Design and Rationale. Neurocrit Care
[Internet]. 2020 [cited 2020 Jun 25];1. Available from: /pmc/articles/PMC7243953/?report=abstract
50. Hsia R, Razzak J, Tsai AC, Hirshon JM. Placing emergency care on the global agenda. Ann Emerg
Med. 2010;56(2):142–9.
51. Tomasoni D, Italia L, Adamo M, Inciardi RM, Lombardi CM, Solomon SD, et al. COVID‐19 and
heart failure: from infection to inflammation and angiotensin II stimulation. Searching for evidence from
a new disease. Eur J Heart Fail [Internet]. 2020 May 15 [cited 2020 Jun 25];ejhf.1871. Available from:
https://onlinelibrary.wiley.com/doi/abs/10.1002/ejhf.1871
52. Sekine T, Perez-Potti A, Rivera-Ballesteros O, Strålin K, Gorin J-B, Olsson A, et al. Robust T cell
immunity in convalescent individuals with asymptomatic or mild COVID-19. Cell [Internet]. 2020 [cited
2020 Sep 1]; Available from: https://doi.org/10.1016/j.cell.2020.08.017
53. Padda G. Evaluating the cost-effectiveness of COVID-19 screening strategies in the workplace.
University of California, San Francisco; 2020.
54. Paltiel AD, Zheng A, Walensky RP. Assessment of SARS-CoV-2 Screening Strategies to Permit the
Safe Reopening of College Campuses in the United States. JAMA Netw Open [Internet]. 2020 Jul 31 [cited
2021 Apr 28];3(7):e2016818–e2016818. Available from: https://jamanetwork.com/
Table 1
Page 19/25Table 1. Base-case values and ranges for model inputs.
Page 20/25Input Base- Range Source
Case
Value
Test performance
IgG test sensitivity 98.1% 89.9% US FDA [26]
–
99.7%
IgG test specificity 99.6% 99.2% - US FDA [26]
99.8%
Ag test sensitivity in early clinical disease, 90% 70% - Pollock 2021 [27]
days 1-7 95%
Ag test sensitivity in early clinical disease 70% 50% - Pollock 2021 [27], Pilarowski
(days 8-14), late clinical disease (days 15-39), 90% 2021 [28]
asymptomatic
Ag test specificity 99.6% 99.6% - Pollock 2021 [27], Pilarowski
100% 2021 [28]
PCR test sensitivity, symptomatic 95% 67% - Shen 2020 [29], Tahamtan
100% 2020 [30]
PCR test sensitivity, asymptomatic 70% 53% - Reddy 2021 [31], Yang 2020
95% [32], Wang 2020 [33]
PCR test specificity in early clinical disease, 99% 60% – See S1 File, Appendix E for
days 1-7 100% calculation.
PCR test specificity in early clinical disease, 11% 9% -
days 8-14 12%
PCR test specificity in late clinical disease 66% 50% -
100%
PCR test specificity when asymptomatic 62% 44% -
82%
Cost inputs
Cost of COVID-19 treatment $3,312 $1000 - Rae 2020 [34]
$12,000
Cost of PCR testing $51 $20 - CMS 2021 [35]
$120
Cost of IgG testing $42 $20 - CMS 2021 [35],
$120 Satyanarayana 2020 [36],
Cairns 2020 [37]
Viral profiles
Likelihood of infectiousness in early clinical 89.3% 43.6 – Wölfel 2020 [22]
disease, days 1-7 97.1%
Page 21/25Likelihood of infectiousness in early clinical 7.9% 0.7 –
disease, days 8-14 36.4%
Likelihood of infectiousness in late clinical 0.0% 0.0 –
disease 0.8%
Antibody profiles
Likelihood of having no antibodies in early 67.6% 61.7 – Zhao 2020 [38]
clinical disease, days 1-7 69.9%
Likelihood of having no antibodies in early 19.3% 10.4 –
clinical disease, days 8-14 22.3%
Likelihood of having no antibodies in late 0.1% 0.0 –
clinical disease 1%
Epidemiologic inputs
Point prevalence of COVID-19 infection in the 0.002 0.0005 California COVID-19
community – 0.008 Dashboard [39]
Proportion of population recovered (or 0.47 0.43 – California DPH [40]
vaccinated) 0.70
Probability of asymptomatic infection 0.4 0.2 – Nishiura 2020 [7]
0.8
Effective reproduction number with 0.85 0.50 – CMMID 2021 [41]
precautions 1.5
Immunity conferred 85% 50 – Hall 2021 [25]
100%
QALYs lost due to one COVID-19 infection 0.078 0.05 – Avalon Health Economics
0.21 2020 [42], Ioannidis 2020 [43],
Mallapaty 2020 [44]
Figures
Page 22/25Figure 1
Clinical status of HCWs based on existence of respiratory symptoms at time of screening [22–24].
Figure 2
Page 23/25Probability distribution of QALYs saved with Ag vs. PCR-only testing in early clinical disease, days 1-7.
PCR screening saves more QALYs than Ag testing in 74% of simulations.
Figure 3
Probability distribution of difference in net costs with Ag vs. PCR-only testing in early clinical disease,
days 1-7. PCR screening has fewer net costs than Ag testing in 26% of simulations.
Page 24/25Figure 4
One-way sensitivity analyses on net costs of no test vs. Ag testing among asymptomatic HCWs. Inputs
ranked by effect on output mean.
Supplementary Files
This is a list of supplementary files associated with this preprint. Click to download.
S2File.docx
S1File.docx
Page 25/25You can also read