Disclaimer - Protector Forsikring
←
→
Page content transcription
If your browser does not render page correctly, please read the page content below

Disclaimer

This presentation and the information contained herein have been prepared by and is the sole responsibility of Protector Forsikring ASA (the "Company”). Such information is being provided
to you solely for your information and may not be reproduced, retransmitted, further distributed to any other person or published, in whole or in part, for any purpose. Failure to comply with
this restriction may constitute a violation of applicable securities laws. The information and opinions presented herein are based on general information gathered at the time of writing and are
therefore subject to change without notice. The Company assumes no obligations to update or correct any of the information set out herein.

These materials may contain statements about future events and expectations that are forward-looking statements. Any statement in these materials that is not a statement of historical fact
including, without limitation, those regarding the Company’s financial position, business strategy, plans and objectives of management for future operations is a forward-looking statement
that involves known and unknown risks, uncertainties and other factors which may cause our actual results, performance or achievements of the Company to be materially different from any
future results, performance or achievements expressed or implied by such forward-looking statements. Such forward-looking statements are based on numerous assumptions regarding the
Company’s present and future business strategies and the environment in which the Company will operate in the future. The Company assumes no obligations to update the forward-looking
statements contained herein to reflect actual results, changes in assumptions or changes in factors affecting these statements.

This presentation does not constitute or form part of, and is not prepared or made in connection with, an offer or invitation to sell, or any solicitation of any offer to subscribe for or purchase
any securities and nothing contained herein shall form the basis of any contract or commitment whatsoever. No reliance may be placed for any purposes whatsoever on the information
contained in this presentation or on its completeness, accuracy or fairness. The information in this presentation is subject to verification, completion and change. The contents of this
presentation have not been independently verified. While the Company relies on information obtained from sources believed to be reliable, it does not guarantee its accuracy or
completeness. Accordingly, no representation or warranty, express or implied, is made or given by or on behalf of the Company or any of its owners, directors, officers or employees or any
other person as to the accuracy, completeness or fairness of the information or opinions contained in this presentation. None of the Company, its affiliates or any of their respective advisors
or representatives or any other person shall have any liability whatsoever (in negligence or otherwise) for any loss howsoever arising from any use of this presentation or its contents or
otherwise arising in connection with the presentation. The Company's securities have not been and will not be registered under the US Securities Act of 1933, as amended (the "US Securities
Act”), and are offered and sold only outside the United States in accordance with an exemption from registration provided by Regulation S of the US Securities Act.

This presentation should not form the basis of any investment decision. Investors and prospective investors in securities of any issuer mentioned herein are required to make their own
independent investigation and appraisal of the business and financial condition of such company and the nature of the securities. Any decision to purchase securities in the context of a
proposed offering of securities, if any, should be made solely on the basis of information contained in any offering documents published in relation to such an offering. For further information
about the Company, reference is made public disclosures made by the Company, such as filings made with the Oslo Stock Exchange, periodic reports and other materials available on the
Company's web pages.

                                                                                                 1
Capital Markets Day
March 10th 2021

Our DNA
                               Vision
                           The Challenger
                           Business Idea
This will happen through unique relationships, best in class decision-
                 making and cost effective solutions
                            Main targets
                     Cost and quality leadership
                          Profitable growth
                                Top 3
                               Values
                              Credible
                          Innovative/Open
                                Bold
                             Committed
Capital Markets Day 2021
Virtual Webcast| March 10th | From 10:00

10:00 – 10:30       Protector – We have only just begun

10:30 – 10:45       Nordics – Back on Track

10:45 – 11:00       UK – A Disciplined Team Journey

11:00 – 11:15       Investments – Core business

11:15 – 11:40       Long-term target and shareholder distribution

11:40 – 12:00       Summary, Succession and Q&A

New information released today
SCR-ratio up 19% points, YTD equity return > MNOK 350, 3-year CR 90-92%

• New BNOK 1.9 reinsurance deal on WC Denmark/Norway signed March 9th
    • The deal confirm reserve quality
    • Protectors SCR-ratio increases with 19%-points, everything else equal
    • Very attractive cost of capital

• YTD equity portfolio return > MNOK 350
    • Remember, these gains are mainly unrealized and volatility must be expected

• Long-term (3 years) combined ratio target changed from 94% to 90-92%

• New dividend policy decided in the board
    • A flexible policy where priority 1 is Insurance growth if possible
    • Excess capital (SCR-ratio > 180%) will be distributed to shareholders over time
    • Quarterly dividend will be considered (but remember, flexibility comes first)

                                                                          5
Reinsurance deal reduces risk and increases SCR-ratio
70% of WC tail in Denmark and Norway sold

• Reserves sized BNOK 1.9 sold to DARAG Germany (70% of reserves transferred)
• Similar to our deal with DARAG on Change of Ownership reserves
• SCR-ratio post dividend increases from 190% to 209%
• Cut off date is end Q3 2020, 70% on all reserves prior to October 1st transferred
• Very limited impact on P&L
• Funds are withheld, meaning Protector do not transfer money to DARAG;
     • Except for a pre-defined risk premium (normally between 5-15%)
     • Protector pays a certain agreed interest rate on funds withheld (normal procedure)
• It’s a “real risk transfer contract”, meaning upsides and downsides on reserves are shared 70%/30%

• Cost of capital on this deal is very attractive

                                                                       6
Capital Markets Day 2021
Virtual Webcast| March 10th | From 10:00

10:00 – 10:30       Protector – We have only just begun

10:30 – 10:45       Nordics – Back on Track

10:45 – 11:00       UK – A Disciplined Team Journey

11:00 – 11:15       Investments – Core business

11:15 – 11:40       Long-term target and shareholder distribution

11:40 – 12:00       Summary, Succession and Q&A
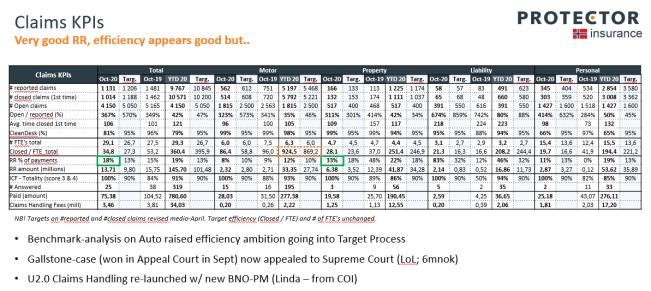
Claims handling – the moment of truth
Claims handling in Protector
Moment of truth

Main targets in Claims Handling:
    • High customer quality
    • Correct, avoid leakage and follow up on any possibility
    • High efficiency (when critical mass is reached)

Resources to deliver on Main Targets:

                           Norway       Sweden     Denmark      Finland   PF Nordics   UK   PF Total
Total                        34           48          28           14        124       41     165
Claim Handlers               25           34          19           12         90       30     120
Technisians/supporters       3            8           3            0          14        7      21
Managers incl. controllers   6            6           6            2          20        4      24

                                                                          9
Project Falcon 2020
Our way to world leading Claims handling

                     Rolls Royce           Cost control through Recovery and Reduction

                     Clean Desk            No delays in Claims handling – without compromising on quality

                     ICF                   Instant customer feedback. Customer satisfaction, follow up dissatisfied

                     Pharaoh               Counter fraud within Claims handling, through “Key Fraud Indicators”

                                                 10
Project Falcon 2020
Our way to world leading claims handling
Rolls Royce 14 % improvement
Clean Desk 91% clean. 26.000 of 28.500 working days
ICF 88% satisfied (“Good” or “Very good”)
Pharaoh 1% savings, OK result. Higher potential
11Management reporting
Control is key
All relevant KPI’s available to managers 24/7 Large Loss follow-up tools to ensure perfect control Monthly reports –Top Down and Bottom Up
– presented on 1 “page”. and learning loops
• Protector level • Registration spreadsheet per claim • Protector level
• Business Unit level • Large Loss quadrant • Business Unit level
• Line of business level • Monthly reports, incl. yellow / red flags • Line of business level
• Individual level • Individual level
ClaimHeader ID+C1:C1:F50 912494 Template last updated 23.02.2021
Customer info
Customer Name Rauma Boliger AS Concern name Rauma kommune
Customer ID 441469 Concern segment
UW, RM and/or renewal assesment
Original Client evaluation: Green Did UW deliver? Green
Did renewal resp. deliver? Green Did RM deliver? Green
Coverage
Coverage position: Certain EML:
Broker
Company Aon Norway AS Broker Name Bjørg Bersvendsen
Claims handler
Current claims handler Fredrik Messel Decision maker Fredrik Messel
Previous claims handler None Decision maker, role Large claim meeting
External loss adjuster No Name, external loss adj.
Claim info
Claim type Brann Claim cause Brann
Damage date 2020-10-01 Customer behaviour Green
Reported date 2020-10-01 Reported to Pharaoh? No
Claim size 20 MNOK Claim size last updated 20201204
Claim size, documented Yes Claim size, doc. date 08.10.2020
1st time reservation 20,00 Current Incurred 20,00
Current reserve 18,00 Current RR-assesment
Worst case reserve 25,00 Best case reserve: 16,00
Brief comments: Large loss, 1/3 with minor damages, reserve 14 mkr on building, VAT 3,5 mkr , Loss of rent 1,8 mkr,
Inventory 0,7 mkr
Follow up structure
Involved parties: Ease-it Help AS Right people onboard? 5
Plan for claims handling Yes Quality on plan: 3
Activities: Plan for reinstatement Mthl eval. by Dec.Maker Green
Technical reports, restoration quotes etc.
Report 1
Company Ease It Help AS Appraiser Lars A Borgen
Requested by Internal Report type Quote
Order date 01.10.2020 Delivered date 08.10.2020
Level of cost in report 19500000 Level, choosen Report 19500000
Cost of Report Quality of Report Green
Counterpartys report
Company Appraiser
Level of cost in report Level, choosen Report
Rolls Royce
Total 0,0 Recovery 0,0
Hardway 0,0 Pharaoh 0,0
Payments
Total 0,0 Compensation 0,0
Consultants 0,0 Others 0,0
UW Learning Loop
UW LL Yes Reported to UW No
Policy Quality Green Microscope
Final evaluation of the Claims handling
Data Quality Time spent
Quality Innovative
#nye #avsluttet #åpne RR % CD
Navn Jan YTD Jan Target YTD Endr # # + 1Y Jan Target YTD Jan YTD Leders kommentar
Name 1 163 163 118 105 124 415 6 10,5 % 9,9 % 10,5 % 76 % 76 % …
Name 2 160 160 112 125 112 454 31 9,9 % 9,9 % 9,9 % 100 % 100 % …
Name 3 169 169 121 125 121 458 17 12,4 % 9,9 % 12,4 % 95 % 95 % …
Name 4 20 20 94 88 94 167 10 9,7 % 9,9 % 9,7 % 95 % 95 % …
12Project Falcon 2021
IQ Falcon
Rolls Royce Perfect cost control in every claim, incl. counter-fraud and “Negative RR”
Clean Desk Improved SLA’s from cradle to grave, incl. perfect data quality (100%)
Efficiency Balance is key, cost ratio in Nordics for own account at 6.6% in 2022
Broker Satisfaction Strengthen # 1 position through Innovation and Quality
13Our DNA
Vision
The Challenger
Business Idea
This will happen through unique relationships, best in class decision-
making and cost effective solutions
Main targets
Cost and quality leadership
Profitable growth
Top 3
Values
Credible
Innovative/Open
Bold
CommittedValue creation in the long run
We have only just begun
• Cost leader in the world – not good enough
• Quality leader in Scandinavia & UK
• Average CR last 10 years at 91.6 %
• Price increases still higher than claims inflation entering 2021, churn back to normal in Nordics
• Growing organically from 0 to > 5.5 BNOK in premiums; building a significant float
• UW discipline and Claims Handling are moments of truth
• Investment is core and delivers better than benchmark HTD
• It’s also a story of capital consumption and risk
• HTD ROE at 19%
• HTD CAGR share price at 27%
15Cost Leadership – World leader, but…
Not good enough – new target 2023
Creating cost leadership Cost the real way1
• Define strategy, design value chains and implement 12%
• In-house IT with cost ratio of ≈ 1% vs 3.2% for industry (Gartner Inc.)
11%
• The real cost “secret” is a mix of culture and IT
• Increased cost 2019-2020 10%
• Investing in UK
9%
• Increased client churn in the Nordics
• Portfolio clean-up consume resources 8%
7%
2014 2015 2016 2017 2018 2019 2020 2021 2022 2023
Gross expense ratio
2014 2015 2016 2017 2018 2019 2020
Protector Nordics (ex. COI) 6.4 % 7.3 % 6.0 % 7.3 % 7.6 % 7.7 % 9.6 %
Tryg Corporate 11.1 % 10.8 % 11.0 % 10.2 % 9.9 % 10.4 % 11.4 %
If Industrial2 16.1 % 17.3 % 17.6 % 17.1 % 16.0 % 14.6 % na
1 Gross cost incl. claims handling ex. broker commission costs w. normalized LBP
2 Cost ratio excl. annual avg. claims handling cost for If 16Quality leader in Scandinavia and UK
Humble and proud
Broker satisfaction index; not conducted in the Nordics in 2020 due to Covid-19
13 years in a row 7 years in a row
#1
2 yrs consecutive #2 in 2018
Far ahead of #2 again
17Profitability challenged
2020 - A turning point, CR 2021 expected at 90-92%
Profitable 9 out the 10 last years Profitability improvements
• Some challenges entering 2018 • Significant Nordic price increases
• Poor UW discipline in Norway & Finland • Stronger UW discipline in some markets/segments
• Claims inflation motor higher than expected
• Margin management and Capital allocation
• Grenfell Tower and Grey Silverfish
• Exit COI market in Norway
Net Combined Ratio 2011-2021 104%
99%
94% 95%
92% 90-92%
90%
88% 89%
87%
79%
2011 2012 2013 2014 2015 2016 2017 2018 2019 2020 2021
18Volume growth
17 % GWP CAGR last 5 years, 10% growth expected for 2021
Sustainable growth 5 516
• Profitability comes first, growth second 5 100
• No capex booked at balance sheet entering new markets
• Geographical diversification increasing 4 286
• UK expected to be biggest geographical area in 2022
• Organic growth only 3 612
• GWP CAGR last 10 years at 24%
2 916
2 318
1 865
1 410
1 091
803
2011 2012 2013 2014 2015 2016 2017 2018 2019 2020 2021
Finland UK Denmark Sweden Norway
19Protector Nordic vs. Peers
Growing to a nr. 3 position in the market
Combined Ratio avg. ‘14-’201
• Protector vs. If Industrial and Tryg Corporate
• Same product mix Tryg Corporate 90,1%
• Same broker based sales channel
• Same commission structure If Industrial 94,3%
• Same average size of clients
PRF Nordics (ex. COI) 95,3%
• Profitable Nordic market 70% 75% 80% 85% 90% 95% 100%
• However with significant rate pressure 2013-2017
GWP development2 (MNOK)
• Prices started to increase in 2018 and have continued in 2019-2021
8 000
7 000
• Protector with a competitive Combined ratio 6 000
• Despite growing fast 5 000
• Despite expansion across borders 4 000
• Due to our cost advantage 3 000
2 000
1 000
0
2014 2015 2016 2017 2018 2019 2020
1 CR volume weighted for comparison 20
2 Volume translated in to MNOK; fixed exchange rates as of 31.12.2020Top 3 in any segment we enter
Brokered Insurance Nordics & Public sector UK
P&C Nordic Nordic municipalities Public sector UK
Bergen Göteborg København Helsinki
Stavanger Malmö Bærum Aarhus
Nr. 1 Motor fleet Nordic Nordic bus market Many others
21Product mix development1 – towards short tail
Reduced risk profile and reduced capital consumption
• Short tail from 34% in 2008 to 80% in 2021 Geographical diversification as of 31.12.2020:
• Long tail attractiveness decreasing as risk free interest rate decline or disappear.
• Geographical diversification increased; four countries at critical mass 27% 30% 17% 3% 23%
• Motor increasing from 9% in 2008 to 35% in 2021
• Avg. capital consumption per GWP in current portfolio at 31%, versus 45% in 2014
2008 2014 2020 2021 (est)
Motor
9% Motor 11% 7%
16%
23% 23% 13%
Property Motor Motor
16% 13% 33% 35%
16% Property 11%
8% Other short 11% Other short
Other short
28%
17%
43% 35%
Other short 32%
Property Property
Short-tail (1 year) Medium-tail (2-5 years) Long-tail (>5 years)
1 Incl. Change of Ownership Insurance (COI) 22Capital consumption going down quickly
Increased ROE and shareholder distribution
High WC all countries
Medium COI, Liability, EL UK, Other Illness
Low Property, Motor, Accident & Other
Capital consumption pr. GWP
5 757
5 457
45% 4 799
4 163
3 439
2 843
2 375
31%
2014 2015 2016 2017 2018 2019 2020 2021
* Incl. Change of Ownership Insurance (COI) 23How did it happen?
Our DNA
Vision
The Challenger
Business Idea
This will happen through unique relationships, best in class decision-
making and cost effective solutions
Main targets
Culture eats Cost and quality leadership
It’s our DNA -
Profitable growth
strategy for Top 3
We are
breakfast! Values The Challenger
Credible
Innovative/Open
Bold
CommittedThe real secret
Know, understand and live our DNA – every day
Our DNA
G@W Vision
Management training The Challenger
Business Idea
This will happen through unique relationships, best in class decision-
making and cost effective solutions
Main targets
Cost and quality leadership
Profitable growth
Top 3
Values
Credible
Innovative/Open Protector Profile
Bold 7
Krav1
6
Krav8 Krav2
Committed 5
4
3
2
Krav7 1 Krav3
Krav6 Krav4
Krav5
Medarb Leder
Qx 1x Qx 1x
25Never ever compromise on our DNA (TIME)
Values embedded in our every day work
26Value creation in the long run
We have only just begun
• Cost leader in the world – not good enough
• Quality leader in Scandinavia & UK
• Average CR last 10 years at 91.6 %
• Price increases still higher than claims inflation entering 2021, churn back to normal in Nordics
• Growing organically from 0 to > 5.5 BNOK in premiums; building a significant float
• UW discipline and Claims Handling are moments of truth
• Investment is core and delivers better than benchmark
• It’s also a story of capital consumption and risk
• HTD ROE at 19%
• HTD CAGR share price at 27%
27Capital Markets Day 2021 Virtual Webcast| March 10th | From 10:00 10:00 – 10:30 Protector – We have only just begun 10:30 – 10:45 Nordics – Back on track 10:45 – 11:00 UK – A Disciplined Team Journey 11:00 – 11:15 Investments – Core business 11:15 – 11:40 Long-term target and shareholder distribution 11:40 – 12:00 Summary, Succession and Q&A
Executive summary
Nordics – Back on track
• Profitability entering 2021 Turn-around completed
• Cost efficiency measures Cost ratio down 1.5%-points in 2022
• Quality towards market Measured monthly through ”Broker Instant Feedback”.
• Price increases in 2021 4-5%-points higher than claims inflation
• Underwriting discipline Further de-risking, but now on a moderate level
• Nordic profitability outlook 2021 Combined ratio < 90%
• Growth opportunities in the Nordics Maintain discipline, low single digit 2021 Protector
29«We are different»
Our DNA
«Olemme erilaisia» Vision «Vi är annorlunda»
The Challenger
Business Idea
This will happen through unique relationships, best in class decision-
making and cost effective solutions
Main targets
Cost and quality leadership
«Vi er annerledes» Profitable growth «Vi er anderledes»
Top 3
Values
Credible
Innovative/Open
Bold
CommittedCost Leadership
Turn trend around in the Nordics
Creating cost leadership Cost the real way1
• Define strategy, design value chains and implement .
12%
• High premium volume per employee when critical mass is reached.
• Low overhead – Managers are operational.
11%
• In-house IT with Cost ratio of ≈ 1%, vs 3.2% for industry (Gartner Inc.)
10%
9%
8%
2013 2014 2015 2016 2017 2018 2019 2020
Gross expense ratio
2013 2014 2015 2016 2017 2018 2019 2020 Avg. ‘13- ‘20
Protector Nordics (ex. COI) 7,5 % 6,4 % 7,3 % 6,0 % 7,3 % 7,6 % 7,7 % 9,6 % 7,6 %
Tryg Corporate 11,8 % 11,1 % 10,8 % 11,0 % 10,2 % 9,9 % 10,4 % 11,4 % 10,8 %
If Industrial 16,1 % 16,1 % 17,3 % 17,6 % 17.1 % 16.0 % 14,6 % na 16,3 %
1 Gross cost incl. claims handling ex. broker commission cost w. normalized bonus scheme. 31Quality leader in Scandinavia
Elements of dissatisfaction following price increases
Broker satisfaction index done annually through Protector, Broker houses and/or broker associations
13 years in a row 7 years in a row
#1
2 yrs consecutive #2 in 2018
32Claims results deteriorated
2021 – Profitability turn around completed
Gradually worsening Profitability improvements
• Average Return on Equity previous 10 years at 18%. • ROE focus makes long-tail less attractive.
• Underlying realities worse in 2014-2016 and better 2018-2020. • Significant Nordic price increases.
• Denmark very poor claims results in 2020 driven by early years. • Stronger UW discipline in some markets/segments
Net Combined Ratio 105%
97% 97%
91% 92%
90% 90%
88% 89%
87%
79%
2011 2012 2013 2014 2015 2016 2017 2018 2019 2020 2021
33Volume growth
12.5 % CAGR 2016-2020, single digit going forward
4 500
100%
Sustainable growth 4 247 4 189
4 000
• Profitability comes first, growth second. 3 781
90%
• Excitement about maintaining discipline.
3 500 3 359 80%
• Opportunities in a disciplined Nordic market.
70%
3 000 2 893
60%
2 500
2 318
50%
2 000 1 865
40%
1 500 1 410
30%
1 091
1 000
803 20%
1 110 1 193
500 885 1 009 10%
730 812
608
306 426
233
0%
2011 2012 2013 2014 2015 2016 2017 2018 2019 2020 2021
Finland Denmark Sweden Norway Public Sector Nordic Public Sector Nordics % (rhs)
34Cost efficiency
Right-sizing to strengthen cost leadership.
Earned premium / FTE 2018 2019 2020 2021
• Manning has increased while growth halted.
NO 22.1 20.0 18.8 22.4
SE 12.5 14.8 16.1 18.4 • Efficiency has not been prioritized during 2018-2020.
DK 19.4 20.2 16.5 17.2
FI 8.8 11.3 9.4 9.0
Nordics 16.7 17.3 16.4 18.4 • Price increases and #policy decreases support efficiency.
Cost the real way 2018 2019 2020 2021 2022
NO 6.1% 6.9% 7.6% 6.5% 5.7% • 2%-points improvement from 2020-2022 is possible.
SE 8.7% 7.8% 8.1% 7.2% 6.5% • ”Low hanging fruit” has been taken.
DK 9.1% 9.3% 11.0% 8.6% 7.5%
FI 13.1% 11.1% 9.3% 11.5% 9.4%
Nordics 7.9% 8.0% 8.6% 7.5% 6.6% • Further right-sizing based on 2021-2022 volume.
35Quality Leadership
Broker Instant Feedback supports quality control.
• Monthly pulse to all brokers based on activity level.
• SMS for easy access and response, scale 1-4.
• Immediate follow-up of all ”1” – very unhappy.
• Individual follow-up on broker satisfaction too learn and train.
Initial feedback is very good.
Happy – very happy Unhappy Very unhappy
”Thanks for your positive ”Please provide feedback on ”We are sorry. Your KAM will
feedback!” email… if we can assist you” contact you within 24 hrs”
36Price increases
Will improve profitability 4-5% in 2021
2020 2021
Very low churn on P&C.
≈ 14.5% Slightly less than 2020
High churn on Workers Comp.
Very large variation on products and segments. Less than 2020 in total.
≈ 13.0%
Motor much lower. Real estate average +40%. Larger variation.
Very high churn driven by Workers Comp.
≈ 11.9% Slightly less than 2020
Deliberate due to capital consumption.
Very low churn on all products. ≈ 21.7% Less than 2020
8.7% in January
Low churn. Majority unprofitable. ≈ 13.7%
Higher going forward.
• Average claims inflation (all products) 3-4 % in the Nordics, higher on Motor and Real Estate
37Portfolio Quality
Further de-risking on a moderate level.
• 80% of contract controlled for deviations.
• All large exposures covered.
• # 4106 deviations clarified before renewal.
• Exposures controlled and pricing risk adjusted
where relevant.
• Policy data improved.
#Contracts to
Microscoping #Microscoped #Deviations found
renewal
NO 5 102 3 925 1 895
SE 648 648 1 950 • IT’s highest priority is to improve data structure.
DK 423 340 184
FI 75 75 77
Protector 6 248 4 988 4 106
38Market position
Market share at 12% – opportunities in Public Housing and Motor
• Public sector is dominated by 2-3 insurers in each market. • Commercial and Affinity is dominated by 3-4 local insurers.
• Mutual insurers are much more represented in all markets. • International subsidiaries are focusing on niches.
• Cost efficiency is critical to succeed. • Cost and quality is key for profitable growth.
Public Sector – NOK 3 bn – market leader by far Commercial and Affinity – NOK 30 bn – top 3
Municipalities Housing Commercial & Affinity Motor
#1
13%
Others Protector Protector
26% Protector 22% #2 17%
37% 11%
Protector
9%
#3 Others
15% Others 67% Others
#2 78% 83%
19%
39Public Sector
Consistent risk selection comes first, growth is secondary
15 years on consistent approach to risk selection Consistently beating the market on large loss frequency
• One UW all lines, Director or Chief UW in all processes • Loyal to methodology – no «red» risk written.
• > 400 factors per UW-case – simple overview • Portfolio development and avoiding large losses.
• Approximately 500 000 claims in our database
CLAIMS HISTORY BENCHMARKS PROGNOSE PROGNOSIS QUOTE MARKET
t
en
t
en
t
en
m
e
n
sm
rat
ss
sm
tio
lity
ll)
s
on
M
M
tic
se
es
ium
(Bi
,5m
ec
r
es
s
.
r ta
7,5
ino
y
kv
cti
7,5
as
ar
tis
as
ss
ilit
sp
rå to
ss
d
.0
iew
0
m
fre
Ye
pe
ill)
al
s<
k.
pe us
sa
ks
in
pre
r
k.
ins
ks
ate
rå
nic
ob
. In
ity
etV
ins
tr.
tr.
ar
ar
ar
%
%
ate
din
los
M
te
oli
r%
.E
. In
. 0vio
t
ic
ate
ate
ate
r
aim
r%
.E
pe
an
h
ka
ka
nt
ino
sv
sv
se
ns
ns
-ra
pr
r
L(
tal
ch
kv
kv
kr
rtf
sk
bl
kr
atc
ino
ino
ote
r
r
r
re
loa
kv
kv
m
rge
kr
kr
kr
InPkre
ino
ino
ino
ino
rre
in-
gs
gs
An
An
Co
Co
Qu
IN
Re
.0
EM
Pu
Po
st
Fre
Fre
To
Te
Ris
Cl
Ri
Ris
St
Su
LLR
Fre
Fre
M
M
M
M
Qu
Ris
Ris
Ris
LL-
Cu
Co
Ex
W
W
M
M
M
M
La
Pr
Pr
25,0 400,0 1,74 0,53 21 % 0,03 0,21 Grønn Gul Grønn grønn Hvi t Hvi t Grønn Grønn Hvi t Hvi t Hvi t HVIT 1,74 0,53 21 % 0,03 0,18 0,21 0,29 0,05 0,05 0,29 0,05 0,046 0,11 0,20 0,14 0,23 89 % 41 % 4% 1 0,14
10,0 553,9 1,40 0,48 27 % 0,06 0,45 Gul Rød Rød gul Grønn hvi t Grønn Hvi t Hvi t Hvi t hvi t GUL 1,40 0,48 27 % 0,06 0,39 0,45 0,91 0,19 0,18 0,63 0,10 0,065 0,26 0,43 0,24 0,50 86 % 33 % 5% 1 0,21
Client research
10,9
8,1
500,0
400,0
1,60
2,07
0,51
0,93
11 %
17 %
0,04
0,06
0,17
0,66
Grønn
hvi t
Hvi t
Rød
Hvi t
Gul
Grønn
Hvi t
Hvi t
Hvi t
Grønn
Hvi t
Technical portfolio
Grønn
Hvi t
Hvi t
Grønn
Hvi t
Hvi t
grønn
grønn
Hvi t
Hvi t
GRØNN
HVIT
1,60
2,07
0,51
0,93
11 %
17 %
0,04 0,13
Claims frequency
0,06 0,59
0,17
0,66
0,19
1,04
0,05
0,09
0,06
0,09
0,28
0,65
0,06
0,06
0,090
0,097
0,07
0,16
0,22
0,33
0,31
UW prognosis
0,37
0,27
0,37
83 %
87 %
57 %
43 %
8%
6%
3
2
0,27
0,33
summary 6,4
5,6
228,0
335,0
2,14
2,43
0,68
1,00
23 %
26 %
0,13
0,11
0,41
0,38
Hvi t
Hvi t
Rød
Gul
Hvi t
Gul
Hvi t
Hvi t
Grønn
Gul
Gul
Gul
Summary
Gul
Gul
Grønn
Gul
Hvi t
Hvi t
Hvi t
gul
Grønn
Grønn
GUL
HVIT
2,14
2,43
0,68
1,00
23 %
26 %
0,13
0,11
0,28
0,26
0,41
0,38
0,48
0,22
0,17
0,09
0,16
0,09
0,48
0,28
0,15
0,09
0,128
0,120
0,08
0,08
0,35
0,29
0,57
0,44
0,45
0,35
79 %
82 %
61 %
60 %
8%
8%
4
4
0,50
0,39
5,0 332,5 1,65 0,60 36 % 0,11 0,25 Gul Hvi t Gul Gul Hvi t Hvi t Hvi t Grønn Gul hvi t gul HVIT 1,65 0,60 36 % 0,11 0,14 0,25 0,22 0,12 0,11 0,32 0,11 0,090 0,12 0,32 0,30 0,38 84 % 52 % 8% 2 0,26
4,8 186,4 2,70 1,12 21 % 0,07 0,18 Hvi t Hvi t Hvi t Hvi t Rød Grønn Hvi t Hvi t Hvi t gul Hvi t GRØNN 2,70 1,12 21 % 0,07 0,11 0,18 0,09 0,05 0,05 0,20 0,05 0,049 0,10 0,20 0,33 0,28 72 % 37 % 8% 3 0,28
4,1 216,6 0,86 0,33 9% 0,05 0,10 Rød Hvi t gul GUL Hvi t Gul Hvi t Hvi t GUL Gul rød RØD 0,86 0,33 9% 0,05 0,05 0,10 0,20 0,06 0,06 0,29 0,07 0,143 0,19 0,40 0,58 1,14 35 % 18 % 8% 1 0,50
4,1 152,2 1,68 0,73 19 % 0,07 0,17 Grønn Hvi t Grønn Hvi t Hvi t Hvi t Grønn Hvi t Hvi t grønn Grønn HVIT 1,68 0,73 19 % 0,07 0,10 0,17 0,21 0,02 0,04 0,32 0,05 0,077 0,13 0,25 0,38 0,33 77 % 39 % 8% 3 0,34
4,0 219,3 1,21 0,39 16 % 0,04 0,04 Hvi t Grønn Grønn Hvi t Hvi t Hvi t Grønn Hvi t Gul Hvi t Hvi t HVIT 1,21 0,39 16 % 0,04 - 0,04 0,13 0,09 0,09 0,29 0,09 0,058 0,08 0,23 0,27 0,27 84 % 54 % 8% 2 0,23
3,7 222,6 0,61 0,29 5% 0,03 0,11 Rød Hvi t Gul Gul Grønn Hvi t Hvi t Gul Rød rød hvi t RØD 0,61 0,29 5% 0,03 0,08 0,11 0,26 0,10 0,09 0,37 0,09 0,161 0,15 0,40 0,67 0,73 55 % 35 % 8% 1 0,59
3,7 313,9 2,04 0,77 24 % 0,11 0,11 Gul Grønn Hvi t Hvi t hvi t Hvi t Grønn Grønn Gul Gul Hvi t RØD 2,04 0,77 24 % 0,11 - 0,11 0,14 0,10 0,09 0,30 0,09 0,073 0,14 0,31 0,45 0,38 82 % 44 % 8% 3 0,39
3,1 136,6 0,80 0,38 13 % 0,04 0,20 gul Grønn Gul HVIT Gul Gul Gul Hvi t Gul Gul rød GUL 0,80 0,38 13 % 0,04 0,16 0,20 0,19 0,03 0,04 0,29 0,05 0,110 0,11 0,26 0,35 0,32 84 % 50 % 8% 2 0,31
2,9 318,2 3,16 0,75 4% 0,06 1,76 rød Rød Gul GRØNN Rød Grønn Rød Grønn Hvi t Gul Hvi t RØD 3,16 0,75 4% 0,06 1,71 1,76 1,75 0,05 0,06 0,57 0,05 0,176 0,46 0,68 1,37 1,90 36 % 12 % 4% 1 1,20
2,4 113,1 2,66 1,40 9% 0,04 0,04 Gul Grønn Grønn Grønn Gul Gul Rød Hvi t Gul gul Gul HVIT 2,66 1,40 9% 0,04 - 0,04 0,04 0,04 0,05 0,21 0,06 0,126 0,13 0,32 0,42 0,36 87 % 51 % 8% 3 0,37
2,0 171,4 2,06 0,23 14 % 0,05 0,05 Hvi t Hvi t Hvi t Grønn Rød Grønn Hvi t Hvi t Grønn gul Hvi t HVIT 2,06 0,23 14 % 0,05 - 0,05 0,29 0,29 0,18 0,41 0,08 0,075 0,08 0,23 0,38 0,32 73 % 48 % 8% 3 0,33
2,3
Total overview and
1,3
145,6
89,5
0,63
2,35
0,17
1,27
16 %
21 %
0,04
0,14
0,04
0,14
Hvi t
Public statistics
Grønn Gul Hvi t hvi t Hvi t Grønn
Risk engineers comments
Hvi t Hvi t hvi t gul RØD 0,63
Inflated benchmarks
0,17 16 % 0,04 - 0,04 0,07 0,07 0,07 0,28 0,08 0,055 0,14 0,27 0,23 0,32 84 % 42 % 8% 2 0,20
Hvi t Hvi t Hvi t Hvi t Gul Hvi t Gul Hvi t Gul gul Gul GUL 2,35 1,27 21 % 0,14 - 0,14 0,26 0,14 0,11 0,38 0,15 0,094
Market rate expectation
0,16 0,41 0,65 0,55 75 % 45 % 12 % 3 0,57
UW suggestion summary and conclusion on region and size
40Executive summary
Nordics – Back on Track
• Profitability entering 2021 Turn-around completed
• Cost efficiency measures Cost ratio down 1.5%-points in 2022
• Quality towards market Measured monthly through ”Broker Instant Feedback”.
• Price increases in 2021 4-5%-points higher than claims inflation
• Underwriting discipline Further de-risking, but now on a moderate level
• Nordic profitability outlook 2021 Combined ratio < 90%
• Growth opportunities in the Nordics Maintain discipline, low single digit 2021 Protector
41Capital Markets Day 2021 Virtual Webcast| March 10th | From 10:00 10:00 – 10:30 Protector – We have only just begun 10:30 – 10:45 Nordics – Back on Track 10:45 – 11:00 UK – A Disciplined Team Journey 11:00 – 11:15 Investments – Core business 11:15 – 11:40 Long-term target and shareholder distribution 11:40 – 12:00 Summary, Succession and Q&A
Our DNA
                               Vision
                           The Challenger
                           Business Idea
This will happen through unique relationships, best in class decision-
                 making and cost effective solutions
                            Main targets
                     Cost and quality leadership
                          Profitable growth
                                Top 3
                               Values
                              Credible
                          Innovative/Open
                                Bold
CommittedUK Summary 2016-2020
A disciplined Team Journey has just begun
• £10bn market in scope, £3bn market in focus, many years of growth ahead
• Three segments
• Public UW & cost advantage # 3 today
• Housing: UW & cost advantage # 3 today
• Commercial: Careful entry, one team «on 2, soon 3, broker panels» Prepare
in due
UK - The Journey so far time
• Profitable in 2019 and 2020 120
• Profitable in year 4 and 5 (like in Sweden) 100 1/3 hit-
ratio vs
• Some luck on large losses 80
People Nordics
• Good underlying profitability before
60
• Improved Reinsurance terms clients
40
• Culture is key 20
• Quality leader 0
• Up-front investment in people for future 2016 2017 2018 2019 2020
FTE's GWP (£m)
44Lessons learned from entering Sweden and Denmark
Making mistakes is ok – if they are shared and not repeated
Significant long
tail business early
(DK)
Start in Public Clients before
Sector, then Lost money, takes
people time to fix
Commercial
Vertical
Build strong
integration in
Protector culture
claims (motor
early
Good techs, etc) Some mistakes
Good
experience made
experience
Improve in UK Learn
Copy in UK
Broker
Insource message (USP)
Claims Commercial
handling early sector Invest early in
Local Risk
people to avoid
Significant Management
future quality
build of motor resources early
gaps
portfolio (SWE)
45Our Segments and brokers
Selected Brokers, search for Competitive Edge, do it well
Public Sector Housing Associations Commercial Sector
PRFs main brokers: PRFs main brokers: PRFs main brokers:
• Marsh • Marsh • Marsh
• Aon • Aon
• AJG
> £600m market > £300m market Large clients (£250k avg.)
UW Excellence Cost advantage key Risk managed clients
Home Market (low deductibles) Property & Motor largest LOBs
46Public Sector & Housing Association
Top 3, disciplined UW, risk selection & cost advantage
Public Sector Housing Associations • Market leader with > 50 % share
• Clients selection through consistent
UW methodology
• One UW, all products
• Focused RM approach
PRFs main brokers: PRFs main brokers:
• Marsh • Marsh
• Aon
• AJG
> £600m market > £300m market
UW Excellence Cost advantage key
Home Market (low deductibles)
47Commercial Sector
Large Clients, focused distribution, Risk Management focus
Commercial Sector • Core Products – Property, Casualty & Motor
• Gradually expanding distribution
• Wide risk appetite – Narrow customer focus
• Strong analytical bias
PRFs main brokers:
• Marsh
• Aon • Major customer proposition
• Embedded Risk Management approach
Large clients (£250k avg.)
Risk managed clients
Property & Motor largest LOBs
48Disciplined growth in a large market
61% avg. annual growth since 2017 with lots more potential
UK GWP Growth
£m 2017 2018 2019 2020
120
110,64
100
80 75,91
59,63
60
47,06
40,50
40
31,01
21,59 20,00 22,50
17,14 18,71
20
10,65 11,21 13,82
5,64 6,21
0
Public Housing Commercial Total
COR: 110% 97% 73% 87% 109% 108% 119% 97% 86% 112% 99% 86%
Market (in focus) Share: 2.9% 3.6% 5.2% 3.7% 4.6% 6.7% 0.9% 2.0% 2.8% 1.6% 2.6% 3.8%
49The UK Market
£10bn+ – Growing despite Brexit & Covid 19
The Market
Segments Distribution
Broker 1: £2,000m
Broker 2: £1,280m
Commercial Broker 3: £ 960m
£9,000m Broker 4: £1,200m
Broker 5: £ 400m
London Market
Specialist: £1,640m
Regional: £1,520m
£2.9bn
Public
3 Major Brokers
Sector
ZM Direct
£600m
Excluding Lloyds of London
and remaining South East
Housing
2 Major Brokers
Associations
£300m
(exclusive panels)
50The UK Market
Huge opportunity, targeted focus – Underwrite the client
• In scope UK Market GWP £10 bn + Current Risk High Medium Low
Appetite
Manufacturing Real Estate Financial Institutions
Retail & Wholesale Specialist Areas / Professional
• In Focus GWP £2.9bn + Public Services
Administration
• Whereof Commercial GWP £2.0bn +
High 1.2 0.6 0
• Whereof Public GWP £0.9bn +
Medium 0.8 0.3 0
Low 1.9 0.9 4.3
• Competitive landscape: 15-20 providers (reducing)
Total 3.9 1.8 4.3
• Top 5 50 %
High distribution Products outside of
• 6-10 25 % Protector’s current
Core appetite
costs scope
Focus: Property,
viewpoint Products outside of PI – Largest
• 11-15 10 % Casualty, Motor
scope exposure
• The rest 10 %
51UK ‘One Team’ Development
Prepared for the future, committed to the culture and curious
• Protector Cultural Lead – 2019 & 2020
• 80+ employees (33 on-boarded in 2020)
• Seamless transition to WFH
• Advancing training & Development – through internal & external programs
• Two locations – One team – culturally embedded
52Broker Satisfaction
Perception is reality, strong results in 2020, never compromise on quality
BSI UK 2020 - Totality
Protector 80
Avg ex Protector 59
Competitor 1 65
Competitor 2 64
Competitor 3 63
Competitor 4 60
Competitor 5 60
Competitor 6 60
Competitor 7 56
Competitor 8 56
Competitor 9 55
Competitor 10 54
Competitor 11 52
0 10 20 30 40 50 60 70 80
53UK Summary 2016-2020
A disciplined Team Journey has just begun
• £10bn market in scope, £3bn market in focus, many years of growth ahead
• Three segments
• Public UW & cost advantage # 3 today
• Housing: UW & cost advantage # 3 today
• Commercial: Careful entry, one team «on 2, soon 3, broker panels» Prepare
in due
UK - The Journey so far time
• Profitable in 2019 and 2020 120
• Profitable in year 4 and 5 (like in Sweden) 100 1/3 hit-
ratio vs
• Some luck on large losses 80
People Nordics
• Good underlying profitability before
60
• Improved Reinsurance terms 2021 clients
40
• Culture is key 20
• Quality leader 0
• Up-front investment in people for future 2016 2017 2018 2019 2020
FTE's GWP (£m)
54Capital Markets Day 2021 Virtual Webcast| March 10th | From 10:00 10:00 – 10:30 Protector – We have only just begun 10:30 – 10:45 Nordics – Back on Track 10:45 – 11:00 UK – A Disciplined Team Journey 11:00 – 11:15 Investments – Core business 11:15 – 11:40 Long-term target and shareholder distribution 11:40 – 12:00 Summary, Succession and Q&A
Investment is core
CAGR AUM last 5 years of 15.2%
                                                                                                                           13 492
• Equity share between 8.9 and 25.1% historically                                                                          13.5%
    • Direct equity investments under consideration
                                                                                                                  10 925
• High Yield (HY) share between 15% and 34% historically
                                                                                                                  10.1%
• Equity and HY share will vary according to assessed attractiveness > 20% RoE                    9 373   9 535
                                                                                                                           8 975
    • Capital consumption differ substantially between asset classes                                      9.9%
                                                                                                  17.6%
                                                                                          7 545

                                                                                  6 637
                                                                                          22.1%
                                                                                  12.5%
                                                                                                                           86.5%
                                                                       4 958
                                                                                                                  89.9%
                                                                       11.6%
                                                           4 000                                          90.1%
                                                           13.2%                                  82.4%
                                                3 193
                                                8.9%                              87.5%   77.9%
                                    2 355
                        2 022       17.8%                              88.4%
             1 635      24.6%
  1 222                                                    86.8%
             25.1%                             91.1%
  16.8%                             82.2%
             74.9%      75.4%
  83.2%

  2008       2009       2010        2011        2012       2013        2014       2015    2016    2017    2018    2019     2020
                                                              Float    Equities   Bonds

                                                                        56
Protector’s financial underwriting method
Overall investment hurdle rate at 20% company RoE
Protector’s analysis process Stress test Risk allocation New ideas and watchlist
• Portfolio allocation based on risk/reward considerations/
high hurdle rate (min. 20% RoE)
• Stress test to ensure that we withstand any financial crisis
Bottom-up analysis FUW Difficulty & expertise
• Thorough bottom-up analysis, the cornerstone of our
investment approach
• Watchlist includes light follow-up on all Nordic high-yield
bonds, and many European small/mid-cap equities
Position sizing Quarterly update Market/macro backdrop
• Continuous process improvements
57Investment strategy – equities
Focus on level of difficulty and risk/ reward
Protector
• Long term ownership returns “Do not buy a farm just because you
Horizon expect a lot of rain this summer”
• Good long term ownership returns “There are no extra points for level
Type of investments • Easy/predictable businesses of difficulty in investments”
• High with margin of safety in our assessments
Hurdle rate and margin of safety • Low liquidity shares with added hurdle
• Fewer companies, deep analysis and contrarian
Analysis variant perception
• Low, reference for good companies but “How to win – pick easy
Intensity of competition • Overlooked/ignored competition”
• Unpopular/poor sentiment
• Continuous learnings and improvement of process
Focus • Long term results
58Equity portfolio statistics
Good performance since inception in 2014
• Equity share of total portfolio varies depending on Cumulative TWR in % – Equity portfolio vs. benchmarks (08.10.2014 – 31.12.2020)
available investment opportunities reaching hurdle 170
164
150
• Discount to estimated intrinsic value 26% at YE20
130
• Concentrated portfolio where top 5 positions will 110
99
normally be 30-50% of total 90
• No travel-, oil- or oil service companies
70 71
50
30
10
Oct-14
Oct-14
Oct-15
Oct-16
Oct-17
Oct-18
Oct-19
Oct-20
Nov-14
Jan-15
Feb-15
Mar-15
Sep-15
Nov-15
Jan-16
Feb-16
Mar-16
Sep-16
Nov-16
Jan-17
Feb-17
Mar-17
Sep-17
Nov-17
Jan-18
Feb-18
Mar-18
Sep-18
Nov-18
Jan-19
Feb-19
Mar-19
Sep-19
Nov-19
Jan-20
Feb-20
Mar-20
Sep-20
Nov-20
May-15
Jun-15
May-16
Jun-16
May-17
Jun-17
May-18
Jun-18
May-19
Jun-19
May-20
Jun-20
Apr-15
Jul-15
Apr-16
Jul-16
Apr-17
Jul-17
Apr-18
Jul-18
Apr-19
Jul-19
Apr-20
Jul-20
Dec-14
Aug-15
Dec-15
Aug-16
Dec-16
Aug-17
Dec-17
Aug-18
Dec-18
Aug-19
Dec-19
Aug-20
Dec-20
-10
Cum. TWR Protector Cum. TWR OSEBX Nordic index
59Equity portfolio - top 10 holdings
5 are new from CMD in 2018
Top 10 holdings per 02.03.2021
1. Multiconsult, 4.043.344 shares
2. Elanders, 2.150.520 shares
3. Jyske Bank, 757.645 shares, new 2019
4. BankNordik, 1.060.644 shares, new 2019
5. eWork, 1.720.499 shares
6. Columbus, 5.132.389 shares, new 2020
7. B3, 2.008.022 shares
8. Origin, 2.000.000 shares, new 2020
9. Projektengagemang, 3.159.489 shares, new 2020
10.Bank Norwegian, 500.000 shares
• YTD return > MNOK 350
• Remember that these are mostly unrealized gains, volatility must be expected
• Equity share (of total portfolio) will vary
60Investment strategy – Bonds
Invest in riskier assets if RoE > 20%. Higher risk requires higher margin of safety
• Bottom-up analysis (underwriting) and quarterly follow up
• Bond market often slow to react to deteriorating fundamentals
Analysis/Underwriting strategy
• Continuous development of process
• Absolute attractiveness of individual risk, e.g.
• Terms
• Redundancy, low Loss Given Default
• Always ensure large margin of safety to intrinsic enterprise value
Focus areas • Willingness to
• Sit on the sideline; because of this our expectation is often to show lower returns in good times
• Act aggressively – structurally advantaged to take opportunity of periods of fund outflows
• Selective – ≈ 5% of new deals
• Capital consumption & return on risk capital
• Company capital allocation alternatives evaluated
Return evaluations • Hurdle rate for investment = company ROE target >20%
• Liquidity / ability to change our mind
61Bond portfolio statistics
Immaterial losses the last 5 years. Higher risk in 2020 and start of 2021
• Low losses, -0.11% or less, every year since insourcing in 2015 Portfolio data 31.12.20 30.09.20 31.12.19
Size bond & cash eq. (MNOK) 1 11 603 11 788 9 757
• Higher risk in 2020 than avg. last 5 years with losses of -12m or -0.11%
• A year with higher volatility and higher losses for the general market Avg. ref. rate (NIBOR, STIBOR, etc.) 0.2% 0.1% 1.2%
Avg. spread/risk premium (bps) 210 205 89
Yield 2.3% 2.1% 2.1%
• “Normalized“ annual loss expectation through cycle, -0.2% to -0.5% Duration 0.4 0.3 0.4
• Expect losses to be “chunky” with low losses in most years Credit duration2 1.4 1.6 2.0
Avg. rating 3 A- A A+
• Actual losses of course dependent on risk taking
1 Size excludes forward foreign currency contracts
2 Avg. includes bank deposits
3 Avg. based on official rating (>60%) and ‘Protector rating’ (60%) and ‘Protector rating’ (HY bond transactions January to June 2020
Protector will invest aggressively in rare situations when our assessment is outstanding risk/reward
BPS MNOK
1800 1200 • Severe stress tests avoids forced selling
1017
1600 1000 • No “customer” will withdraw money
1400 800
• We hedge all currency and have no risk of forced selling if
banks demand more collateral.
1200 600
498 • We typically have some excess capital to deploy when
1000 400 opportunity arise
268
800 139 200
• Flexible investment model. In March we bought High Yield.
127
91
23,8 11
In the next crises it could be equities, buy-backs or
10 16 21
600 0 something else
Week 1 -6 -14 Week 26
-46 -49
400 -200 • Close cooperation with CEO, CFO and CRO ensures
adequate risk evaluation
200 -400
• All company capital allocation alternatives evaluated
0
-502
-600 at all times
HY investments HY Spread (lhs)
Spread line is Spb1 Markets’ ‘Norsk Xover Replika’
63Bond portfolio – return and capital consumption
Focus on return on capital consumed
Protector return ex investments in HY bond funds from March ’15
Capital consumption NOK bn2
Alternative 1
Protector in-house bond 1.2
portfolio
2.4x
Protector HY return ex investments in HY bond funds from March ’15 Alternative 2
2.9
Crossover bond fund1
HTD outperformance at lower risk and capital consumption
1 Carnegie Corporate bond fund used as proxy for crossover bond funds
64
2¨Capital consumption before any diversification effects = after tax loss in stress + capital consumption under SIICapital Markets Day 2021 Virtual Webcast| March 10th | From 10:00 10:00 – 10:30 Protector – We have only just begun 10:30 – 10:45 Nordics – Back on Track 10:45 – 11:00 UK – A Disciplined Team Journey 11:00 – 11:15 Investments – Core business 11:15 – 11:40 Long-term target and shareholder distribution 11:40 – 12:00 Summary, Succession and Q&A
Earlier communicated long-term financial objectives
Profitability first. A balance sheet that can handle the unexpected

Long-term financial objectives (looking 3 years ahead from Feb. ‘20)
Net Combined Ratio:                                                                                                   94 %
Return on Equity (ROE):                                                                                              > 20 %
Gross Written Premium (GWP) growth:                                                                                   5%
Solvency II Capital Ratio (SCR):                                                                                     > 150 %

Net Combined Ratio                                           ROE1                                                             GWP Annual Growth Rate                                     SCR²

                                                                                                               44%
                                                                   38%                                                                36%                                                                                  203%
                                            104%                                                                                                                                                      199%
                                                                                                                                                  32%
                                      99%                                28% 28%                                                            29%
                                94%             95%                                25%                                                                        26%
                90% 88% 89% 92%                                                          21% 20%                                                        24%         24%
          87%                                                                                                                                                                                                174%   172%
    79%                                                                                                                         18%                                       19% 19%
                                                              5%
                                                                                                                                                                                            154%
                                                                                                          0%                                                                        8%

                                                                                                   -13%
    ’11 ’12 ’13 ’14 ’15 ’16 ’17 ’18 ’19 ’20                   ’11 ’12 ’13 ’14 ’15 ’16 ’17 ’18 ’19 ’20                           ’11 ’12 ’13 ’14 ’15 ’16 ’17 ’18 ’19 ’20                         ’16   ’17    ’18    ’19    ’20

1 Return on Solvency Capital until 2016 when reflecting changes in accounting principles from Jan. 1st 2016 where Shareholder’s Equity includes security provisions
² Volatility adjusted SCR 2019 and YTD 2020

                                                                                                                        66
Combined ratio considerations 2021
Improvements on it’s way
2020 net combined ratio at 94.8 %
+ Covid-19 effects 1 %-points
+ Some negative surprises normally occur – “safety margin” 2-4 %-points
0 Quality of customer portfolio slightly better, but what about new clients? 0 %-points
- Earned premium effect lagging from 2020 1.2 %-point
- Price increases Nordic higher than price inflation 2021 2 %-points
- Cost ratio improvements 2021 vs. 2020 1 %-point
- Net run-off losses 2021 vs. 2020, prudent reserve history 2.2 %-points
- Large loss ratio higher than normalised 7% 1.8 %-points
We expect to deliver a combined ratio for 2021 at 90-92%
67The situation entering March
Combined ratio probably on budget – very good start on investments
• Volume In line with budget assumptions
• Price increases January 1st 5.8% increase above claims inflation on BNOK 2 premium
• Large losses Slightly lower than normalized (volatility expected)
• Motor Good start
• DARAG deal Will reduce downside (and upside) on WC Denmark and Norway
• Long tail business No analysis have been made
• Margin of safety Slightly increased at the moment
68Protectors competitive position
Strong 2021 entry, significant identified upsides
• Nordic business back on track after trouble.
• Sweden and Norway looks strong
• Denmark about to recover, but still need more work
• Public Nordics look strong with limited competition and significant competitive edge
• UK has started very well.
• Competitive edge arriving in Public and Housing sector.
• No competitive disadvantage in reinsurance.
• Investments doing very well; further improvements identified.
• Capital outlook very strong; comfortable downside protection
• Claims handling quality and efficiency improvements realistic
• No new market expected in period 2021-2023
69Market background
A hardening market, slightly reduced competition
• Interest rate level at 0 for a long time leads to increased UW discipline +
• Reinsurance trouble supports UW discipline +
• Very disciplined Nordic market will continue +
• Industry consolidation reduces competition and supports discipline +
• Trygg-Hansa, Fremtind and some smaller players disappearing
• Covid-19 supports stability and reduces Churn in Nordic short term +
• Brexit could reduce risk appetite in UK among some big players 0
• Undisciplined UK market are growing more disciplined 0
• Covid-19 reduces new sales (not in Public) short term in UK -
70Risk Level in Protector
Risk level slightly down in 2021-2023
• Higher volatility due to some Property volume and (motor) Liability in UK Increased risk
• Higher Nat Cat risk due to increased Housing portfolio in UK Increased risk
• Four countries with (close to) critical mass is a new situation for Protector Reduced risk
• Significant reduced long and medium tail business Reduced risk
• Increased level of frequency business with strong competitive edge (motor) Reduced risk
• Relative level of new (and more risky) business going down Reduced risk
• Moving volume from 1.0 bill to 1.5 bill in 18 moths is very risky
• Moving from 5.5 bill to 6.0 bill in 12 months is not that risky
• Cost ratio the “real way” going down ‘21-’23. CL8. No risk
• New crises will arrive, but budgets always include a “margin of safety” Risk as always
71New long-term financial objectives – 3Y perspective
Profitable growth with a Combined Ratio 90-92%
Long-term financial objectives Old New Guiding 2021
Net Combined Ratio: 94 % 90-92% 90-92%
Return on Equity (ROE): > 20 % > 20%
Gross Written Premium (GWP) growth: 5% Disciplined 10%
Solvency II Capital Ratio (SCR): > 150 % > 150%
72Capital Allocation Maximise shareholder return
Capital allocation – maximize shareholder return
Priority 1: Always profitable growth in insurance, if possible

Main capital allocation alternatives:
 1                                 2                                    3                                    4                           5

                                            Investments
     Insurance underwriting                                                    Cash as an option                        Buy backs            Dividends
                                          Equities & Bonds

 1     Allocation towards profitable growth is preferred; stay disciplined
 2     Challenging to allocate capital in times of low credit spreads and all-time-high stock markets

 3     How much capital should be kept for future financial market crises?

 4     An attractive alternative if meeting hurdle; will normally have to bid with significant premium
 5     Capital base discipline; flexible distribution of excess capital if allocation cannot be made elsewhere

                               • Determine minimum hurdle rate (RoE>20%)
                               • Calculate returns for all internal and external allocation alternatives available, by return and risk
 Capital allocation approach
                               • Deploy capital in the most attractive alternatives above hurdle.
                               • Release underperforming capital (COI, Price increases, WC Denmark and Norway as example)

                                                                                       74
Capital allocation alternatives – what have we done?
Maximizing shareholder return
1 Changing product mix – capital light1 2 Lowered risk in bond portfolio – enabled capacity in March
Capital consumption NOK bn2
Alternative 1
Protector bond portfolio 1.20
2.4x
Alternative 2
2.90
Crossover bond fund1
• Change of product mix from 2019 to 2022 - significant effect on capital
consumption
Differing values from P&Ls due to exchange rates applied Differing values from P&Ls due to exchange rates applied
3 Buy backs 4 Dividends
• Historical buy backs – in all 26.2m shares • Dividends of 14.45 per share paid out pre 2020
Buy backs 2007 2008 2009 2010 2018
Dividends 2009 2010 2012 2013 2014 2015 2016 2017 2020
# shares 2 718 645 14 762 900 3 348 920 955 782 4 404 622
Average price 10.91 7.22 6.00 9.67 57.50 Per share 1.25 1.50 1.20 1.75 2.00 2.25 2.25 2.25 3.00
75Other capital allocation initiatives
Optimize sources and cost of capital
• T1 and T2 issuances
• Buying additional Large Loss Reinsurance with ”0 risk” for capital reasons
• Solvency based Reinsurance, incl. retroactive option in financial turmoil
• Sale of COI reserves
• Sale of WC reserves
• Put options / investment hedging
76Capital allocation – maximize shareholder return
Priority 1: Always profitable growth in insurance, if possible
Main capital allocation alternatives:
1 2 3 4 5
Investments
Insurance underwriting Cash as an option Buy backs Dividends
Equities & Bonds
1 Allocation towards profitable growth is preferred; stay disciplined
2 Challenging to allocate capital in times of low credit spreads and all-time-high stock markets
3 How much capital should be kept for future financial market crises?
4 An attractive alternative if meeting hurdle; will normally have to bid with significant premium
5 Capital base discipline; flexible distribution of excess capital if allocation cannot be made elsewhere
• Determine minimum hurdle rate (RoE>20%)
• Calculate returns for all internal and external allocation alternatives available, by return and risk
Capital allocation approach
• Deploy capital in the most attractive alternatives above hurdle.
• Release underperforming capital (COI, Price increases, WC Denmark and Norway as example)
77You can also read


