CRISIL CRBCustomised Research Bulletin - Real Estate - May - June 2014
←
→
Page content transcription
If your browser does not render page correctly, please read the page content below
May - June 2014

CRISIL CRBCustomised Research Bulletin

                  Real Estate
CRISIL CRBCustomised Research Bulletin

About CRISIL Limited
CRISIL is a global analytical company providing ratings, research, and risk and policy advisory services. We are India's
leading ratings agency. We are also the foremost provider of high-end research to the world's largest banks and leading
corporations.

About CRISIL Research
CRISIL Research is India's largest independent and integrated research house. We provide insights, opinions, and analysis
on the Indian economy, industries, capital markets and companies. We are India's most credible provider of economy and
industry research. Our industry research covers 70 sectors and is known for its rich insights and perspectives. Our analysis is
supported by inputs from our network of more than 4,500 primary sources, including industry experts, industry associations,
and trade channels. We play a key role in India's fixed income markets. We are India's largest provider of valuations of fixed
income securities, serving the mutual fund, insurance, and banking industries. We are the sole provider of debt and hybrid
indices to India's mutual fund and life insurance industries. We pioneered independent equity research in India, and are today
India's largest independent equity research house. Our defining trait is the ability to convert information and data into expert
judgements and forecasts with complete objectivity. We leverage our deep understanding of the macro economy and our
extensive sector coverage to provide unique insights on micro-macro and cross-sectoral linkages. We deliver our research
through an innovative web-based research platform. Our talent pool comprises economists, sector experts, company analysts,
and information management specialists.

CRISIL Privacy
CRISIL respects your privacy. We use your contact information, such as your name, address, and email id, to fulfil your request
and service your account and to provide you with additional information from CRISIL and other parts of McGraw Hill Financial
you may find of interest.
For further information, or to let us know your preferences with respect to receiving marketing materials, please visit
www.crisil.com/privacy. You can view McGraw Hill Financial’s Customer Privacy Policy at http://www.mhfi.com/privacy.

Last updated: May, 2013

Disclaimer
CRISIL Research, a division of CRISIL Limited (CRISIL), has taken due care and caution in preparing this Report based on the information
obtained by CRISIL from sources which it considers reliable (Data). However, CRISIL does not guarantee the accuracy, adequacy or
completeness of the Data / Report and is not responsible for any errors or omissions or for the results obtained from the use of Data / Report.
This Report is not a recommendation to invest / disinvest in any company covered in the Report. CRISIL especially states that it has no
financial liability whatsoever to the subscribers / users / transmitters / distributors of this Report. CRISIL Research operates independently of,
and does not have access to information obtained by CRISIL’s Ratings Division / CRISIL Risk and Infrastructure Solutions Limited (CRIS),
which may, in their regular operations, obtain information of a confidential nature. The views expressed in this Report are that of CRISIL
Research and not of CRISIL’s Ratings Division / CRIS. No part of this Report may be published / reproduced in any form without CRISIL’s
prior written approval.
Key Offerings
              Industry

    n   Market Sizing

    n   Demand/Supply Gap
        Analysis

    n   Input/Commodity Price
        Forecasting

    n   Impact Analysis of
        Economic/Regulatory                 Company
        Variables
                                    n    Competitive
                                         Benchmarking

                                    n    Valuation studies

                                    n    Evaluation of various
                                         business models

                                    n    Customised Credit
                                         Reports                                 Project
                                    n    Vendor Assessment
                                                                       n    Feasibility/Pre-feasibility
                                                                            Studies

                                                                       n    Techno-economic
                                                                            viability studies (TEV)

                                                                       n    Project Vetting

                                                                       n    Location
                                                                            identification/assessment

                                                                       n    Sensitivity Analysis

Key Verticals
n   Automotive                  n       Infrastructure                  n    Power
n   Commodities                 n       Logistics                       n    Real Estate
n   Hotels & Hospitals          n       Oil & Gas                       n    & Others

                                                             CRISIL Industry Research covers 70 industries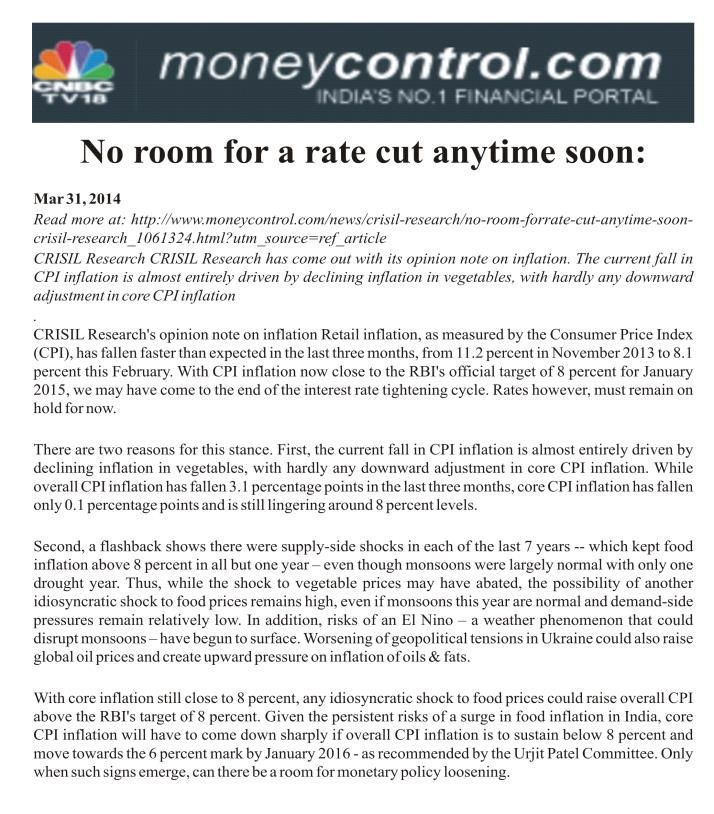
CRISIL CRBCustomised Research Bulletin

CRISIL Customised Research

CRISIL Research, the leading independent and credible provider of economic, sectoral and
company research in India, utilises its proprietary information networks, database and
methodologies to provide you customised research inputs and conclusions for business
planning, monitoring and decision-making.

CRISIL Research provides research inputs and conclusions to support
your decisions while
n       Lending to an entity
n       Taking a stake in an entity
n       Transacting/partnering with an entity
n       Feasibility of entry into a new business segment
n       Feasibility of capacity expansion
n       Choice of location, fuel, other inputs
n       Choice of markets, targeted market share
n       Product mix choices
n       Production/sales planning

CRISIL Research provides you the following inputs to help you
identify/assess business opportunities or review business risks
n      Identification/assessment of new business themes/areas
n      Building futuristic scenarios and discontinuity analysis over the long term
n      Assessing the impact of changes in economic variables, commodity prices on your
       business
n      Field-based information on variables and tracking indicators for ongoing      review of
       opportunities/risks in your sectors of interest
n      Assessment of credit/investment quality of your portfolio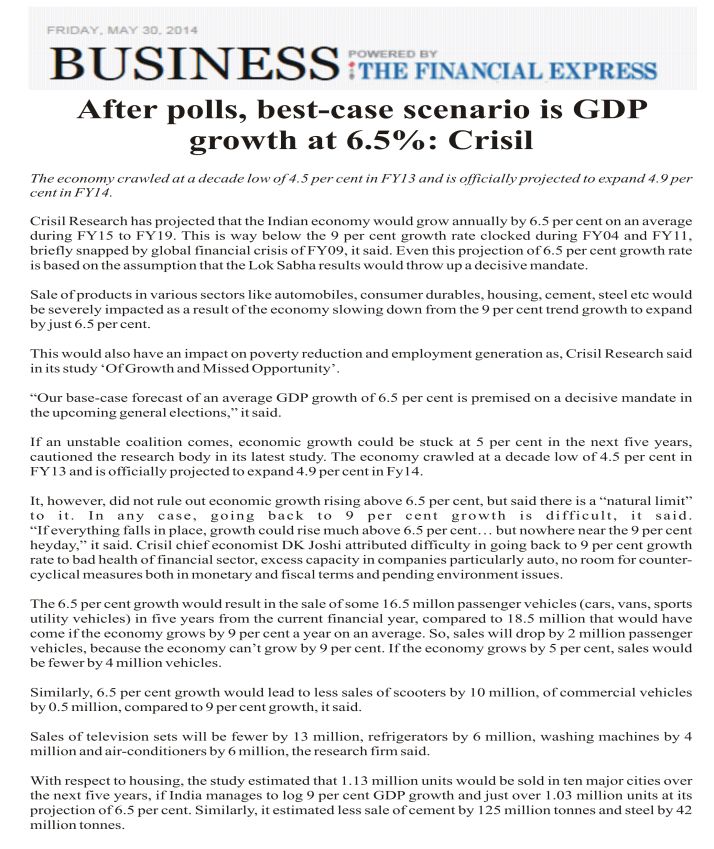
Foreword

           With a new government assuming power at the Centre, riding on a
           decisive electoral mandate, the portents for India’s economy are
           certainly positive. And the real estate sector is not an exception. After
           a sustained economic slowdown, that kept real estate demand and
           capital values subdued for last 4-5 quarters, the expectation is that
           the new government’s policies to address inflation, job creation and
           kickstart the investment cycle will provide a boost to growth leading
           to a gradual recovery in the sector.

           Creating jobs will particularly provide a shot in the arm to a sagging
           real estate sector’s fortunes, as more jobs will mean higher
           disposable incomes. Moreover, any amendments and greater clarity
           on the Land Acquisition Act may make it easier for developers to
           acquire land. However, as the impact of the new policies is unlikely to
           be instantaneous, the revival in demand will be gradual. Moreover,
           interest rates are expected to remain firm in the near term, which
           hints that growth in demand is expected to improve at a measured
           pace. As real estate demand improves, capital values in the 10 major
           cities are also likely to increase albeit marginally. In this issue, we
           have also examined unfolding trends in related sectors such as
           hotels, retail and hospitals.

           In 2013, new apartment sales declined across the top 10 cities we
           track, barring IT/ITeS hubs like Bengaluru and Pune. Worsening
           demand, amid huge unsold inventories, also pulled down capital
           values across most cities in the last 8-10 months. However, stable
           demand helped Pune and Bengaluru to ward off a fall in capital
           values. We expect real estate demand to revive and grow by 5-6 per
           cent in 2015. While significant pent-up demand is likely to drive up
           real estate absorption by 6-7 per cent in Mumbai, demand in the
           NCR, Chennai, Bangalore and Pune is likely to grow by around 5 per
           cent.
CRISIL CRB Customised Research Bulletin

       Foreword

                               The retailing sector too will see green shoots of a recovery in 2014-15.
                               After having slumped to decadal lows, we expect growth in the Indian
                               organized retail industry to improve to 13-14 per cent during the year.
                               Retailers’ margins will also improve further by 50-100 basis points, as the
                               effect of cost rationalization measures initiated in 2013-14 continues.
                               Organized retail penetration is also likely to reach 10 per cent by 2018-19
                               from 7.9 per cent in 2013-14.

                               For hotels too, a marginal recovery is in sight, but it will be visible only
                               from 2015-16. With room supply growing faster than demand in 2014-15,
                               both occupancy rates (ORs) and average room rates (ARRs) will decline.
                               As the situation reverses starting 2015-16, ORs will recover. However,
                               rising competition will keep ARRs rangebound and consequently
                               revenues per available room (RevPARs) are expected to remain flat over
                               the next 3-4 years at Rs 4,500.

                               For the healthcare industry, where a lack of infrastructure (low beds to
                               population ratio) is a major issue, the game changer will be a rise in
                               private   investments,    especially   for   in-patient   department   (IPD)
                               treatments. Among daycare models that we have analysed, the eye care
                               delivery market will be worth keeping an eye on, given the attractive
                               returns that it offers.

                               Prasad Koparkar
                               Senior Director
                               Industry & Customised Research

2
Contents

           Opinion
           Segment-wise review of the Indian real estate market       01

           Interview
           Binaifer F. Jehani, Director - CRISIL Research             03

           Economic Overview – June 2014                              05

           Industry Overview
           Healthcare delivery                                        06
           Hotels                                                     09
           Organised Retail                                           13

           Independent Equity Research Report
           Apollo Hospitals Enterprise Ltd, June 05, 2014             15

           Customised Research Services
           Real Estate                                                16

           Media Coverage                                             17

                                                                  3
CRISIL CRB Customised Research Bulletin

4

Opinion Segment-wise review of the Indian real
estate market
Planned v/s CRISIL Research's estimated supply
1. Residential Real Estate
(2014-16)
Demand remained tepid in 2013 as well
NCR 934
In 2013, high interest rates and sticky inflation 419
Mumbai - MMR 322
161
continued to exert pressure on demand across the 10 188
Pune
128
major cities (Mumbai, NCR, Bengaluru, Kolkata, Bengaluru 184
124
Chennai, Hyderabad, Pune, Ahmedabad, Chandigarh Hyderabad 155
94
Chennai 127
and Kochi) as potential buyers remained in a wait-and- 80
109
Kolkata
watch mode. Consequently, new home bookings 63
Ahmedabad 88
63
declined year-on-year across all cities barring Pune and Chandigarh Tricity 74
39
Bengaluru. Average capital values too grew by a tepid Kochi 28
18
4-5 per cent y-o-y, mainly led by a rise in the first half. Planned Supply (mn sq ft.)
CRISIL Research's Estimated Supply (2014-16) (mn sq ft.)
In the latter half of the year, capital values remained
stable or declined marginally over the first half. Source: CRISIL Research
Capital value index (for 10 major cities) 2. Commercial office space
300 Rentals in most micromarkets stay below 2008
280 peaks
260
240 During the global economic slowdown in 2008-09,
220
demand for commercial office space, especially from
200
180 the IT/ITeS and BFSI sectors, plummeted causing
160
140 average lease rentals to fall by 25-30 per cent between
120 the first half of 2008 and the second half of 2009. In
100
subsequent years, average lease rentals in the 10
H1 2014 E
H1 2013
2005
2006
2007
H1 2008
H2 2008
H1 2009
H2 2009
H1 2010
H2 2010
H1 2011
H2 2011
H1 2012
H2 2012
H2 2013
major cities have moved sideward, barring a few micro-
markets which have recorded a rise or a fall. Demand
Capital Value Index
gained momentum briefly in the first half of 2011, but
Note: Indexed to 2005; E- Estimated
high vacancies restricted a sharp rise in lease rentals.
Source: CRISIL Research
Weak demand has also slowed down execution of
Mumbai, NCR to house half of estimated supply many projects. Currently, lease rentals in almost 90 per
cent of micromarkets in the 10 major cities are 25-30
Of the 2.2 billion sq ft of supply planned in the 10 cities,
per cent below peak levels seen in the first half of 2008.
CRISIL Research expects only 54 per cent (1.2 billion
sq ft) to come up by 2016. Mumbai and NCR alone are
expected to account for 49 per cent of the estimated
supply.
1
CRISIL CRB Customised Research Bulletin
Lease rental index (for commercial office spaces in 3. Retail real estate
10 major cities) Vacancy levels continue to stunt rise in rentals
190 Post the 2008-09 slowdown, demand for retail real
180
170 estate space was weighed down by the prevailing
160 oversupply. Since the first half of 2010, lease rentals in
150
140 the 10 major cities have also remained flat owing to the
130
120
vacancies, failing to breach peak levels seen in the first
110 half of 2008.
100
2005
2006
2007
H1 2009
H1 2013
H1 2008
H2 2009
H1 2010
H2 2010
H1 2011
H2 2011
H1 2012
H2 2012
H2 2013
H1 2014E
H2 2008
Lease rental index (for retail spaces in 10 major
cities)
Lease Rental Index
220
*Excludes Ahmedabad since transactions happen on outright 200
basis
180
Note: Indexed to 2005; E- Estimated
160
Source: CRISIL Research
140
120
Only 31 per cent of the total planned supply to 100
materialise by 2016; oversupply to persist
2007
2005
2006
H1 2012
2008 H1
2008 H2
H1 2009
H2 2009
H1 2010
H2 2010
H1 2011
H2 2011
H2 2012
H1 2013
H2 2013
H1 2014E
Of the total 389 million sq ft of office space planned in
the 10 major cities, CRISIL Research expects only 121
million sq ft to metarialise during 2014 to 2016. Of this, Lease Rental Index
NCR, Bengaluru and Pune will together account for 61 Note: Indexed to 2005; E- Estimated
per cent. However, there is a clear evidence of Source: CRISIL Research
oversupply as demand will amount to only 53 million sq
ft during the period. NCR to see maximum additions in mall space
during 2014 to 2016
Of the total 70 million sq ft of planned retail real estate
Planned v/s CRISIL Research's estimated supply
space, CRISIL Research only 27 million sq ft to come
(2014-16)
up during 2014 to 2016. In other terms, about 90 malls
NCR 35
86 out of the total planned 168 malls are likely to be
Bengaluru 68
18 operational by 2016, of which 39 malls are expected to
Pune 64
20 be located in the NCR.
Mumbai - MMR 53
16
Hyderabad 39
6
Kolkata 31
9
Chennai 21
8
Ahmedabad 10
3
Kochi 10
2
Chandigarh Tricity 7
3
Planned supply (mn sq ft.)
CRISIL Research expected supply (2014-16) (mn sq ft.)
Source: CRISIL Research
2Binaifer F. Jehani
Interview Director, CRISIL Research
Binaifer F. Jehani, Director, CRISIL Research, Binaifer
leads the research function on the real estate sector at
CRISIL Research. She is responsible for overseeing a
large team of analysts, offering comprehensive
research coverage on real estate, spanning residential,
commercial and retail space. Her areas of expertise
also comprise healthcare delivery, hospitality and
housing finance.
In addition, Binaifer manages customised assignments,
which involve gauging the feasibility, underlying market
potential, etc of prospective business models for
developers, private equity firms, investment bankers Which segment within the real estate industry is
likely to grow faster in the next 2 years?
and banks. Research findings of such bespoke
assignments empower these players to make informed With a new government taking power at the Centre,
and effective investment decisions. things should start looking up for the real estate industry
and the residential segment in particular. However, a
Binaifer joined CRISIL in 2004. During the course of her recovery in demand will be gradual as prices remain
eight-year stint, she has successfully handled several unaffordable. Over the past 8-10 months, tepid demand
projects, involving estimation of market and financial had in fact pulled down capital values by 3-4 per cent
feasibility. These projects have driven critical business across most of the 10 major cities. Buyers maintained a
activities in areas of expansion, capacity building, etc. wait-and-watch mode given the political and economic
She has been an active participant at real estate uncertainties. Therefore, capital values are likely to rise
forums, where she proffered valuable insights and again only in 2015, and only by 2-4 per cent y-o-y,
opinions on vital sectoral issues. across the major cities.
In 2008, Binaifer pioneered the product called ‘City In the commercial real estate market, high vacancies
Reality’, which determined underlying potential in the are expected to restrict a rise in lease rentals in the
top ten cities of India. Further, in 2011, she was near term, despite fewer project launches. However,
instrumental in conceptualising the ‘Reality Next’ report, rentals will also not fall from current levels as we
covering the newly emerging cities, by going beyond believe that they have already bottomed out. CRISIL
the conventional top ten Indian cities. Research, therefore, expects commercial office space
rentals to remain stable until 2015.
Binaifer is a Qualified Chartered Accountant and holds
Demand in which of the 10 major cities is expected
a Post Graduate Diploma in Business Administration
to outgrow the rest in the near term?
with specialisation in finance from Symbiosis Institute of
Pune and Bengaluru. Housing demand in both cities will
Business Management in Pune..
by far be driven by a growing IT/ITeS industry. The
3CRISIL CRB Customised Research Bulletin
rising preference for mid-range apartments has helped
these cities weather an economic slowdown. Steady
demand will drive up capital values in these markets by
2-4 per cent between 2014 and 2015. Moreover, both
cities are well-connected to peripheral areas, which
house bulk of upcoming supply. The development of
key infrastructure projects like the Metro Rail and the
ring road is also expected to bolster demand in these
cities.
Which are the micromarkets which will see
maximum appreciation in capital values?
In the long term, certain micromarkets in large cities will
definitely outperform others. For instance, in Mumbai,
capital values in Chembur will rise sharply as various
infrastructure projects – such as the Monorail and Metro
rail - improve connectivity. In Pune, prices in
micromarkets like Kharadi and Chakan will also surge
aided by infrastructure projects. In Bangalore, strong
demand from the IT/ITeS sector, will drive up capital
values in Hebbal and Whitefield.
How is the retail industry expected to grow in the
near term and how will this benefit demand for retail
real estate space?
We expect that a revival in consumer sentiments is key
to the retail industry’s growth and by extension, demand
for retail real estate space. Going forward, we expect
organised retail industry to grow faster led by higher
same store sales growth and new store rollouts,
especially after hitting a decadal low in 2013-14. New
store rollouts will drive up demand for retail real estate
space, while prevailing high vacancies will restrict a rise
in retail lease rentals in the near term..
4Indian Economy Economic Overview – June 2014
High Threat Medium Threat
Inflation (%) Credit grow th (%) Currency Interest rates (%)
12 30 70
11
65
10
20 60
8
9
55
10 50 8
45 7
Mar-14
Jan-14
May-13
May-14
Jul-13
Sep-13
Nov-13
4 0
40
May-13 Aug-13 Nov-13 Feb-14 May-14 May-13 Aug-13 Nov-13 Feb-14 May-14
May-13 Aug-13 Nov-13 Feb-14 May-14
WPI CPI-IW Non-food credit growth Avg Rs per US$ 1 Yr 10 Yr
Sectoral inflation (%) Industrial production grow th (%) Trade Grow th (%) Foreign inflow (US$ bn)
20 8
4 20
4
10 0
10
-4
0 0
-8
Mar-14
Jan-14
May-14
May-13
Jul-13
Sep-13
Nov-13
0
Feb-14
May-13
May-14
Nov-13
Aug-13
-10
-20
-4 May-13 Aug-13 Nov-13 Feb-14 May-14
Primary FDI+(ECBs/FCCBs)
Fuel Apr-13 Jul-13 Oct-13 Jan-14 Apr-14
Manufacturing Exports Imports Net FII flows
Mfg
Macroeconomic Indicators - Forecasts
2013-14 2014-15F Rationale
Grow th Agriculture 4.6* 3.0
Resumption of stalled projects, rise in mining output and higher external demand to
Industry 0.7* 4.0
boost grow th. Industry to grow at 4.0%. Services and agriculture to grow by 7.6%
and 3.0% respectively. Risks to forecast from a deficient monsoon are how ever,
Services 6.9* 7.6 rising.
Total 4.7* 6.0
Lagged impact of rate hikes in 2013-14 to bring dow n non-food inflation. Low er crude
Inflation CPI - Average 9.5 8.0
oil prices to ease inflation in fuel and transportation.
Fiscal deficit expected to remain at elevated levels in 2014-15. Low probability of
Fiscal deficit as a % of GDP 4.5 4.3 adoption of tax reforms like goods and services tax to cap government revenues. In
addition, rollover of fuel subsidies from this year to limit the dow nside to subsidies.
Low er inflation, better liquidity conditions and higher deposit grow th to push yields
10- year G-Sec
Interest rate 8.8 8.6 dow n. How ever, high government borrow ings to refinance outstanding debt to limit the
(year end)
dow nside.
Exchange Re/US $ Forecast revised dow n to reflect higher foreign inflow s than expected earlier, due to
60.1 60.0
rate (year end) monetary easing in the Eurozone and likely opening up of FDI across sectors.
Note *CSO Advanced Estimates,# Revised estimates, F: Forecasted
Source: Central Statistical Office, RBI, Budget docum ents, CRISIL Research
5CRISIL CRB Customised Research Bulletin
Industry Overview Healthcare delivery
‘Eyeing’ the gains in healthcare delivery India, which is also the diabetes capital of the world, will
Until a few years ago, words like ‘cataract’, corneal contribute to a huge patient base for eye care
implant, surgery, conjured images of long-drawn treatments: about 75 per cent people with Type 2
operations. No more. With private eye care chains diabetes will develop diabetic retinopathy after 15 years
widening their presence in India, all treatments — from as a diabetic.
optical treatments or cataract surgeries — take only a
few hours at the most. Though costs seem to be a bar, Eye care surgery market in 2013-14 (volumes)
the patients queuing aren’t few. Rising incomes and
Retina
better insurance penetration have led to more people diseases
5%
seeking paid treatments. Moreover, as private eye care
Glaucoma
centres/ chains require less space and a lower capital 2%
outgo, the returns and profits are also better vis-à-vis Cornea
diseases
other healthcare delivery models studied by CRISIL Cataract 3%
82%
Research.
LASIK etc
3%
Eye care chains to grow ‘easily’ as more patients
Others
queue up 5%
Estimated to be worth Rs 120 billion as of 2013-14, the
market for eye care treatments in India is poised to Rs Source: CRISIL Research
236 billion in the next five years. The emergence of
private eye care ‘chains’, in a space dominated by …better technology making paid eye care attractive
hospitals and standalone centres, will underline the next Almost 50 per cent of eye surgeries are performed free
growth story in the eye care services market. But are of cost or at highly subsidised rates currently. However,
their takers? Definitely. An ageing and increasingly the emergence of better technology (non-invasive
diabetic population, greater preference for paid eye treatments) is also aiding the shift away from low-cost
care, shorter procedures and use of better technology or free treatments. For instance, cataract surgeries are
in most treatments will aid a steady rise in people increasingly carried out using ‘phacoemulsification’,
seeking eye care treatments. where the lens is emulsified and sucked out through a
small incision rather than manual surgeries, which carry
Large patient population…. a relatively higher risk of infections. Though
A majority of Indians with eye disorders struggle with ‘phacoemulsification’ treatments are at least 40-50 per
normal refractive disorders. However, the real gain lies cent pricier than normal procedures, efficiency and the
in tapping the rising demand for surgeries, especially lesser time taken outweigh the cost factor.
cataract surgeries, in a largely ageing and diabetic
population. As life expectancy increases, roughly a
tenth of Indians are likely to come under the above 60-
year age bracket over the next five years. Secondly,
6Key private players in the eye care space Returns attractive due to strong demand and low
capital outgo
Center Dr Agarw al's Eye
for Sight Eye Hospitals Q
As compared to most other single-specialty hospitals
Established in 1996 1976 2006
such as cardiology, oncology or multi-specialty
hospitals, a tertiary eye care centre requires a capital
No of centers 45 44 24 investment of only Rs 60-70 million. A well-established
tertiary centre can earn operating margins of 25-30 per
Locations AP, Gujarat, MP, TN, Karnataka, NCR, UP, cent once it breaks even. Similarly, IRRs for an eye
Punjab, AP, Rajasthan, Haryana,
care centre also fare better vis-à-vis other healthcare
UP,NCR,J&K, Odisha, Uttarkhand,
Maharashtra, Andaman & Gujarat delivery models studied by CRISIL Research.
Rajasthan Nicobar
Eyeing the money
Revenues (Rs 1.2 1.1 0.25
billion) ( 2012-13) ( 2012-13) ( 2011-12) Type of center/hospital Project IRRs Project Cost
Eye care center ( 4500 sq ft) 17-18% Rs 60-70 million
Lotus Medfort Vasan
Dialysis center ( 1500 sq ft) 14-15% Rs 9-10 million
Eyecare Hospitals Healthcare
Cardiac super specialty
Established in 1993 n.a. 2002 13-14% Rs 800-900 million
hospital ( 100 beds)
Oncology super specialty
13-14% Rs 1,700-1,800 million
( 200 beds)
No of centers 7 13 150
Multispecialty Hospital
16-17% Rs 1,500-1,600 million
( 200 beds)
Locations TN, Kerala NCR, AP, TN AP, NCR, WB, Source: CRISIL Research
UP, TN, MP,
Rajasthan,
Punjab,
Maharashtra, Hub-and-spoke model aids expansion
Kerala,
Eye care chains are of three types – primary (the hub),
Karnataka,
Gujarat, secondary and tertiary (the spokes). Primary centres
Haryana,
are usually located in rural areas and are mainly for
Jharkhand
outpatient services such as screening and consultation.
Revenues (Rs 0.3 n.a. 5 Charitable players mostly operate primary centres. In
billion) ( 2012-13) ( 2011-12) India, on account of shortage of doctors, there are a few
n.a.: Not available; AP: Andhra Pradesh; J&K: Jammu & Kashmir; MP:
primary eye care centres with telemedicine facilities.
Madhya Pradesh; NCR: National Capital
Secondary eye care centres are mainly located in
Region; TN: Tamil Nadu; UP: Uttar Pradesh
smaller towns and cities. These centres mostly cater to
Source: CRISIL Research
cataract surgeries. For other complex procedures,
patients are referred to tertiary centres.
Strong demand for eye care (as highlighted above) and
lower capital outgo ensures attractive returns on
Brand presence, consistent quality key to success
investment, which has prompted the entry of chains in
Low capital costs alone do not make the case for an
this industry.
eye care chain. To fully tap the potential of this
segment, a strong brand presence is essential for any
player before widening its reach. Associating with
reputed doctors and consistently delivering quality
7CRISIL CRB Customised Research Bulletin
treatments will build the brand. Chains must guardedly
expand through the franchisee model as any negative
publicity by word-of-mouth or otherwise can damage
brand/ business prospects.
Moreover, eye care is region-specific. A strong brand in
one city may be unknown in another city. Hence,
intense marketing efforts are necessary. For example,
Vasan Healthcare opened eight centres between 2002
and 2008, and over 120 centres in the next four years.
8Industry Overview Hotels
Average occupancy rates (ORs) of premium segment demand growth slowed to 7 per cent. However, CRISIL
hotels in India are expected to improve marginally in Research expects room demand growth to improve to
2015-16 after remaining at decadal lows of 59 per cent 9- 10 per cent 2014-15 onwards with a recovery in
in 2013-14 and 2014-15. Premium hotels have been business sentiments as the global and Indian macro-
reeling under severe stress, as a demand slowdown economic situation improves.
coinciding with huge supply additions. However, an
Rising demand; fewer room additions hint at better
improvement is in sight from 2015-16 onwards, as times…
demand picks up and supply additions slow down.
While occupancy rates (ORs) are expected to recover Supply growth expected to moderate
first, intense competition will keep average room rates (nos)
(ARRs) remain under pressure over the next two years. 66,100
Consequently, the revenue per available room 56,850
61,100
(RevPAR) is expected to remain flattish over next 2 39,850
36,200
33,300
years.
Room demand growth to improve to 9 per cent in
the next 2 years…
2013-14 2014-15 F 2015-16 F
Demand growth is expected to improve Room demand Room supply
0.25 F: Forecast
Source: CRISIL Research
0.2
Room supply in business and leisure destinations
0.15
(nos) 48,050
0.1 44,550
0.05
0
2007-08
2008-09
2009-10
2013-14
2014-15 F
2015-16 F
2010-11
2011-12
2012-13
-0.05
11,050 12,300 13,050
F: Forecast
2013-14 2014-15 2015-16 2012-13 2013-14 2014-15
Source: CRISIL Research
F F F
Business destinations Lesiure destinations
Room demand Room
Post the first economic slowdown in 2008-09, room
F: Forecast
demand for premium hotels increased at a CAGR of 11
Source: CRISIL Research
per cent between 2009-10 and 2011-12. As a global
economic slowdown in 2012-13 and 2013-14 too, Room additions by premium hotels are expected to
impacted both business and leisure travel, room increase at a slower 8 per cent over 2014-15 and 2015-
9CRISIL CRB Customised Research Bulletin
16, as compared to an 11 per cent growth in the However, ARRs to continue to slide with increasing
competition
previous two years. Supply is moderating mainly on
account of project delays and postponements in light of
Pan India- ARR and RevPAR
the stress being felt by players. In an environment of
room oversupply and falling RevPARs, the payback (Rs per
day)
period for new hotels has almost doubled to 10-12,
years causing many plans for new hotels to be shelved
7100
or delayed. 7050
4150 4250
…ORs likely to improve
Though pan-India supply will far exceed demand…
2014-15 F
2015-16 F
2006-07
2007-08
2008-09
2009-10
2013-14
2012-13
2010-11
2011-12
(nos) (per cent)
80,000 73 80
71 ARR RevPAR
60,000 65 65 70
61 62 61 59 59 60 F: Forecast
40,000 60
Source: CRISIL Research
20,000 50
0 40
2006-07
2007-08
2008-09
2009-10
2013-14
2014-15 F
2015-16 F
Average room rates (ARRs) for premium hotels are
2010-11
2011-12
2012-13
expected to continue falling in 2014-15 and 2015-16
Room demand (LHS) Room supply (LHS) (after an annual decline of 4 per cent in 2012-13 and
Occupancy rate (RHS) 2013-14). Despite an improvement in occupancy rates,
F: Forecast an oversupply of rooms, intense competition (also from
With an uptick in demand and incremental supply moderating branded mid-market hotels) will curb the pricing power
over the next 2 years, occupancy rates are expected to
improve from 2015-16 onwards of hotels. The revenue per available room (RevPAR),
Source: CRISIL Research which takes into account both ARR and ORs, will
remain flat over the next 2 years.
...More rooms to be occupied in both business and
leisure destinations
(per cent)
80
75
70
65
60
55
50
2006-07
2007-08
2008-09
2009-10
2013-14
2014-15 F
2015-16 F
2010-11
2011-12
2012-13
ORs : Business destinations ORs: Leisure destinations
F: Forecast
Source: CRISIL Research
10City-wise forecasts Bengaluru: Room demand, room supply and ORs
(nos) (per cent)
Business destinations 10,000 80
7,717
8,000
70
NCR: Room demand, room supply and ORs
6,000
(nos) (per cent) 4,482 60
20,000 80 4,000
16,000 50
16,000 2,000
70
12,000 0 40
9,250 2012-13 2013-14 2014-15 F 2015-16 F
8,000 Room demand (LHS) Room supply ( LHS)
60 Occupancy rate (RHS)
4,000
F: Forecast
0 50 Source: CRISIL Research
2012-13 2013-14 2014-15 F 2015-16 F
Room demand (LHS) Room supply ( LHS)
Occupancy rate (RHS) Mumbai: Room demand, room supply and ORs
F: Forecast (nos) (per cent)
Source: CRISIL Research
12,000 80
10100
9,000
Chennai: Room demand, room supply and ORs 6,761 70
(nos) (per cent) 6,000
6,000 80 60
5184
3,000
5,000
70
4,000 0 50
2,823 2012-13 2013-14 2014-15 F 2015-16 F
3,000 60
Room demand (LHS) Room supply ( LHS)
2,000 Occupancy rate (RHS)
50
1,000 F: Forecast
0 40 Source: CRISIL Research
2012-13 2013-14 2014-15 F 2015-16 F
Room demand (LHS) Room supply ( LHS)
Occupancy rate (RHS)
F: Forecast
Source: CRISIL Research
Large business destinations such as the National
Capital Region (NCR), Bengaluru and Chennai will see
supply additions far in excess of demand, which will pull
down RevPARs by 3-4 per cent. In contrast, Mumbai
will see relatively fewer room additions and, thus,
RevPARs will increase by 5 per cent over the next 2
years.
11CRISIL CRB Customised Research Bulletin
Ahmedabad: Room demand, room supply and ORs Leisure destinations
(nos) (per cent)
2,000
1708
80 Jaipur: Room demand, room supply and ORs
1,600 (nos) (per cent)
70
5,000 80
1,200 1,020 4225
60 4,000
800 70
50 3,000 2,442
400
60
2,000
0 40
2012-13 2013-14 2014-15 F 2015-16 F 50
1,000
Room demand (LHS) Room supply ( LHS)
Occupancy rate (RHS) 0 40
2012-13 2013-14 2014-15 F 2015-16 F
F: Forecast
Room demand (LHS) Room supply ( LHS)
Source: CRISIL Research Occupancy rate (RHS)
F: Forecast
Hyderabad: Room demand, room supply and ORs Source: CRISIL Research
(nos) (per cent)
6,000
5099
80 Goa: Room demand, room supply and ORs
(nos) (per cent)
4,500 70
6,000 80
2,895 5,152
3,000 60
4,500 70
3,776
1,500 50
3,000 60
0 40
2012-13 2013-14 2014-15 F 2015-16 F
1,500 50
Room demand (LHS) Room supply ( LHS)
Occupancy rate (RHS) 0 40
2012-13 2013-14 2014-15 F 2015-16 F
F: Forecast
Room demand (nos.) Room supply (nos.)
Source: CRISIL Research Occupancy rate (OR) %
F: Forecast
Among smaller business destinations, such Hyderabad Source: CRISIL Research.
and Ahmedabad, where RevPARs have already
declined substantially, an increase of 5-8 per cent is Among the large leisure destinations, Jaipur and Goa
expected over the next 2 years. will also record a rise of 3-5 per cent in RevPARs over
the next 2 years.
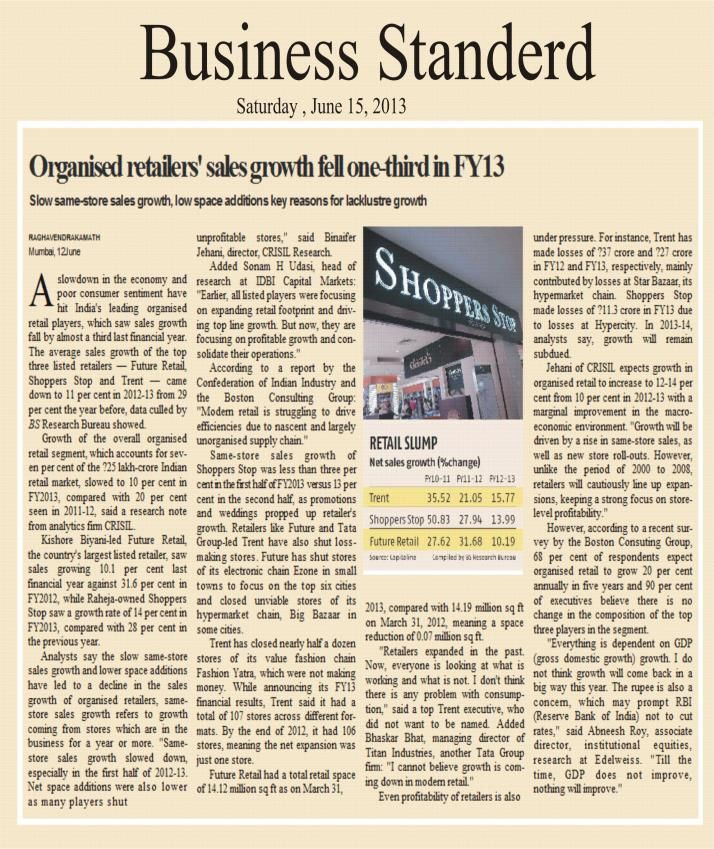
12Industry Overview Organised Retail
Growth in retail industry to improve marginally in Operating margins to improve on continued cost
2014-15 rationalisation measures
The overall retailing industry in India is estimated to be Despite the slowdown in demand, retailers managed to
worth ~Rs 31 trillion in 2013-14. Growth in the industry expand margins by ~100 bps in 2013-14 owing to
sunk to the levels of 10-11 per cent, the slowest in the various cost rationalisation measures such as limited
past 10 years, owing to sluggish economic activities. new store rollouts, closure of unprofitable stores, right
Slowdown in overall retailing growth also affected the sizing of stores, increasing share of private labels, etc.
organised retailers. The growth in the 2.4 trillion We expect operating margins to improve further by
organised retail industry is estimated to have dipped to about 50-100 bps in 2014-15, on the back of rebound in
about 12 per cent in 2013-14, the slowest in the past 10 demand, continued cost rationalisation measures, lower
years on account of weak consumer spending due to discounts and discount days and cautious new store
lower growth in disposable income and limited new rollouts.
store rollouts
Operating margins retail y-o-y growth (RHS)
We expect the economy to pick up in 2014-15, which, in ( per cent) ( per cent)
9.5
turn, will help improve consumer sentiment. As a result, 10.0 8.6 8-9
40
9.0 8.2 8.1
we expect growth in the overall retailing industry to be 35
8.0 6.9
34 30
marginally higher at about 12 per cent. For organised 7.0
6.0 25
retailers, we expect growth to improve to about 13-14 5.0 24 20
per cent, aided by higher same-store sales and new 4.0 20 20 15
3.0
store rollouts. 13-14 10
2.0 12
1.0 5
0.0 0
Organised retail market y-o-y growth (RHS) 2009-10 2010-11 2011-12 2012-13 2013-14 2014-15
E P
(Rs trillion) Operating margins Organised retail y-o-y growth (RHS)
3.0 40%
34% Note: - E- Estimated, P- Projected
35%
2.5 Source: CRISIL Research
24% 30%
2.0
20% 25%
1.5 20% ORP to reach 10 per cent in 2018-19
13-15%
12% 15%
1.0 The overall retailing industry grew at 14-15 per cent
10%
0.5 CAGR during the past 5 years (2008-09 to 2013-14).
5%
1.5 1.8 2.2 2.4 2.8
0.0 0% India’s GDP grew by 6.8 per cent CAGR during the
2010-11 2011-12 2012-13 2013-14 E 2014-15 P period. Over the next 5 years, we expect GDP growth to
Organised retail market y-o-y growth (RHS) slow down marginally to 6 per cent CAGR, pulling down
Note: - E- Estimated, P- Projected overall growth in the retailing industry to 12-13 per cent
Source: CRISIL Research CAGR. We expect the organised sector of the industry
to grow at a CAGR of 17-19 per cent during 2014-15 to
2018-19, slower than the previous 5-year CAGR of 22
13CRISIL CRB Customised Research Bulletin
per cent. Retailers are expected to be more cautious in
terms of new store rollouts, right sizing of the stores and
space rationalisation.
Following the growth in the organised retail segment,
we expect the ORP to reach 10 per cent by 2018-19
from 7.9 per cent in 2013-14.
Long term growth prospects for organised retail
( Rs
trillion)
5.6
2.4 2.8
2.2
0.9
2008-09 2012-13 2013-14 2014-15 2018-19
E P P
ORP 5.8 7.9 10
Note: - E- Estimated, P- Projected
Source: CRISIL Research
Very low ORP expected in food and grocery
segment
The food and grocery segment, the largest segment,
will continue to have very low organised retail
penetration (ORP) as the players continue to face stiff
competition from the unorganised grocery stores. On
the other hand, organised retailers will continue to have
strong presence in verticals such as apparels,
consumer durables, jewellery and footwear..
14Apollo Hospitals Enterprise Ltd
Independent Equity Research Report June 05, 2014
Apollo Hospitals Enterprise Ltd’s (Apollo’s) Q4FY14 results were below CRISIL CFV matrix
Research’s estimates. While revenue growth of 17.7% y-o-y was broadly in line
with our expectations on account of better performance of the pharmacy business Excellent
Fundamentals
(27.6% y-o-y growth), the hospital business reported lackluster performance.
Revenue of the hospital business grew a moderate 12.6% on account of lower 5
occupancy as the ramp-up in the new hospitals has been slower than expected.
Fundam ental Grade
This resulted in an EBITDA margin contraction of 62 bps y-o-y and 85 q-o-q to 4
15%. Subsequently PAT grew by a modest 14.6% y-o-y, and was lower than our
expectations. We have lowered our earnings estimates for FY15 and FY16 3
factoring in slower-than-expected ramp-up in new hospitals and delay in
commissioning of new hospitals While we expect commissioning of 1,000 new 2
beds in the next two years to aid revenue growth, we believe it would result in
temporary margin pressure. We expect the company to go back to its normal 1
margin levels of 16% plus post FY16. We maintain the fundamental grade of 5/5
given its strong positioning in the healthcare sector, established brand and strong Poor
1 2 3 4 5
management.. Fundamentals
Growth across hospitals in Chennai, Hyderabad, tier II/III cities: muted
Valuation Grade
q-o-q, up y-o-y
Dow nside
Strong
Upside
Strong
Inpatient volumes grew by a moderate 6.3% y-o-y on account of slow ramp up in
the new hospitals - Ayanambakkam, Jayanagar and Trichy and decline in
occupancy in the existing hospitals. During the quarter, occupancy across
hospitals was under pressure mainly due to postponement of surgeries. Going
forward, we expect occupancy to improve gradually; this coupled with addition of
beds is expected to drive revenues. Of the capacity addition plan of 2,310 beds,
we expect 560 and 900 beds to be operational by FY15-end and FY16-end KEY STOCK STATISTICS
respectively. We expect the hospitals business’ revenues to grow at a two-year NIFTY/SENSEX 7402/24806
CAGR of 16.2%; new hospitals are estimated to contribute 10% to revenues in
FY16. NSE/BSE ticker APOLLOHOSP
Pharmacy business going strong; expect healthy revenues with margin Face value (₹ per share) 5
improvement Shares outstanding (mn) 139.1
As witnessed in the last few quarters, the pharmacy business maintained strong
Market cap (₹ mn)/(US$ mn) 131,808/2222
growth momentum. Revenues grew by a robust 27.6% y-o-y to ₹3,649 mn on
account of increase in revenue per store (up 17.5% y-o-y to ₹2.24 mn) and Enterprise value (₹ mn)/(US$ mn) 140,548/2369
addition of more than 100 stores during the past one year. EBITDA margin across 52-w eek range (₹)/(H/L) 1,071/801
stores (mature and non-mature) recorded steady improvement driven by growth in
revenue per store; this coupled with higher contribution from private labels led to Beta 0.7
60 bps y-o-y improvement in EBITDA margin to 3.3%. Going forward, we expect Free float (%) 65.7%
strong revenue growth of 21% during FY14-16 driven by an expected 14% growth
in same-store-sales and addition of 100 stores per annum. EBITDA margin is Avg daily volumes (30-days) 224,110
expected to improve to 3.9% in FY16 from 3.3% in FY14. Avg daily value (30-days) (₹ mn) 207.4
Earnings estimates lowered; fair value revised to ₹1,010 per share from
₹1,040 Shareholding pattern
Factoring in lower volumes and delay in capacity addition, we have lowered 100%
FY15-16 EPS estimates by 3.5% and 4.4% respectively. We continue to value 20.3% 20.3% 20.3% 20.3%
Apollo by the discounted cash flow (DCF) method. In line with the revision in 80% 2.9% 3.3% 3.3% 3.8%
earnings estimates, we have lowered our fair value to ₹1,010 from ₹1,040. At the 60%
current market price, our valuation grade is 3/5. 42.4% 42.1% 42.1% 41.6%
. 40%
KEY FORECAST (CONSOLIDATED) 20% 34.4% 34.4% 34.4% 34.4%
(₹ m n) FY12 FY13 FY14# FY15E FY16E 0%
Operating income 31,475 37,697 43,842 51,389 60,203 Jun-13 Sep-13 Dec-13 Mar-14
EBITDA 5,168 6,121 6,724 7,842 9,378 Promoter FII DII Others
Adj net income 2,193 3,044 3,167 3,732 4,458
Adj EPS (₹) 16.3 21.9 22.8 26.8 32.0
Performance vis-à-vis market
EPS grow th (%) 13.3 34.1 4.0 17.8 19.5
Returns
Dividend yield (%) 0.4 0.6 0.6 0.7 0.8
RoCE (%) 12.6 12.8 12.2 12.8 13.7 1-m 3-m 6-m 12-m
RoE (%) 10.1 11.6 11.0 11.9 13.0 Apollo 4% 5% 14% -8%
PE (x) 58.1 43.3 41.6 35.3 29.6 CNX 500 14% 23% 25% 28%
P/BV (x) 5.1 4.8 4.4 4.0 3.7
EV/EBITDA (x) 25.7 22.5 20.9 18.4 15.8
NM: Not meaningful; CMP: Current market price; # : Based on abridged financials.
Source: Com pany, CRISIL Research estim ates
15CRISIL CRB Customised Research Bulletin
Customised Research Services Real Estate
Coverage
Source: CRISIL Research
Key Offerings
Real estate: Residential, Commercial, Malls & Multiplexes, IT/SEZs etc
Feasibility study/ Land development mix
Market potential of a city and Area-wise analysis
Valuation
Education: Play schools, K-12, Coaching Institutes, Engineering Institutes, Management Institutes, etc
Market analysis, Industry sizing and Feasibility Study
Competitive analysis
Franchisee evaluation
Valuation
Healthcare: Speciality, Super-speciality, Multi-speciality, and allied segments like diagnostic centres,
standalone clinics, etc.
Market analysis, Industry sizing and Feasibility Study
Competitor analysis/Benchmarking
Valuation
Studies on allied services like health insurance, medical colleges, pharmacies and diagnostic centres
Hospitality: Premium, budget hotels, Service apartments, Quick-service restaurants, coffee shops, etc.
Market analysis and Feasibility study
Valuations
Management company/Franchisee evaluation
16Media Coverage
17Our Capabilities
Making Markets Function Better
Economy and Industry Research
n Largest team of economy and industry research analysts in India
n Coverage on 70 industries and 139 sub-sectors; provide growth forecasts, profitability analysis,
emerging trends, expected investments, industry structure and regulatory frameworks
n 90 per cent of India's commercial banks use our industry research for credit decisions
n Special coverage on key growth sectors including real estate, infrastructure, logistics, and financial
services
n Inputs to India's leading corporates in market sizing, demand forecasting, and project feasibility
n Published the first India-focused report on Ultra High Net-worth Individuals
n All opinions and forecasts reviewed by a highly qualified panel with over 200 years of cumulative
experience
Funds and Fixed Income Research
n Largest and most comprehensive database on India's debt market, covering more than 15,000
securities
n Largest provider of fixed income valuations in India
n Value more than Rs.53 trillion (USD 960 billion) of Indian debt securities, comprising outstanding
securities
n Sole provider of fixed income and hybrid indices to mutual funds and insurance companies; we
maintain12 standard indices and over 100 customised indices
n Ranking of Indian mutual fund schemes covering 70 per cent of assets under management and
Rs.4.7 trillion (USD 85 billion) by value
n Retained by India's Employees' Provident Fund Organisation, the world's largest retirement scheme
covering over 60 million individuals, for selecting fund managers and monitoring their performance
Equity and Company Research
n Largest independent equity research house in India, focusing on small and mid-cap companies;
coverage exceeds 125 companies
n Released company reports on 1,442 companies listed and traded on the National Stock Exchange; a
global first for any stock exchange
n First research house to release exchange-commissioned equity research reports in India
n Assigned the first IPO grade in IndiaContact us
Binaifer Jehani Prosenjit Ghosh
Phone: +91 22 3342 4091 | Mobile: +91 88791 25243 Phone: +91 22 3342 8008 | Mobile: +91 99206 56299
E-mail: binaifer.jehani@crisil.com E-mail: prosenjit.ghosh@crisil.com
Our Offices
Ahmedabad Hyderabad
706, Venus Atlantis 3rd Floor, Uma Chambers
Nr. Reliance Petrol Pump Plot No. 9&10, Nagarjuna Hills
Prahladnagar, Ahmedabad - 380015, India (Near Punjagutta Cross Road)
Phone: +91 79 4024 4500 Hyderabad - 500 482, India
Fax: + 91 79 2755 9863 Phone: +91 40 2335 8103/05
Fax: + 91 40 2335 7507
Bengaluru
W-101, Sunrise Chambers Kolkata
22, Ulsoor Road Horizon, Block 'B', 4th Floor
Bengaluru - 560 042, India 57 Chowringhee Road
Phone: +91 80 2558 0899 Kolkata - 700 071, India
+91 80 2559 4802 Phone: +91 33 2289 1949/50
Fax: +91 80 2559 4801 Fax: + 91 33 2283 0597
Chennai Pune
Thapar House 1187/17, Ghole Road
43/44, Montieth Road, Egmore Shivaji Nagar
Chennai - 600 008, India Pune - 411 005, India
Phone: +91 44 2854 6205/06 Phone: +91 20 2553 9064/67
+91 44 2854 6093 Fax: +91 20 4018 1930
Fax: + 91 44 2854 7531
Gurgaon
Plot No. 46
Sector 44
Opp. PF Office
Gurgaon - 122 003, India
Phone: +91 124 6722 000
Stay Connected | Twitter | LinkedIn | YouTube | Facebook
CRISIL Limited
CRISIL House, Central Avenue
Hiranandani Business Park, Powai, Mumbai - 400 076. India
Phone: +91 22 3342 3000 | Fax: +91 22 3342 8088
www.crisil.com
CRISIL Ltd is a Standard & Poor's companyYou can also read