WHAT ARE YOU OFFERING ME? MEASURING CLICK-THROUGH INTENTIONS WHEN OFFERING INCENTIVES
←
→
Page content transcription
If your browser does not render page correctly, please read the page content below
MASTER THESIS

  WHAT ARE YOU OFFERING ME?

    MEASURING CLICK-THROUGH
    INTENTIONS WHEN OFFERING
            INCENTIVES

Gabriela Donis Arriaza

FACULTY OF BEHAVIOURAL, MANAGEMENT AND SOCIAL SCIENCES

COMMUNICATION STUDIES

EXAMINATION COMMITTEE

Dr. A. D. Beldad

Dr. I. van Ooijen

JANUARY 2020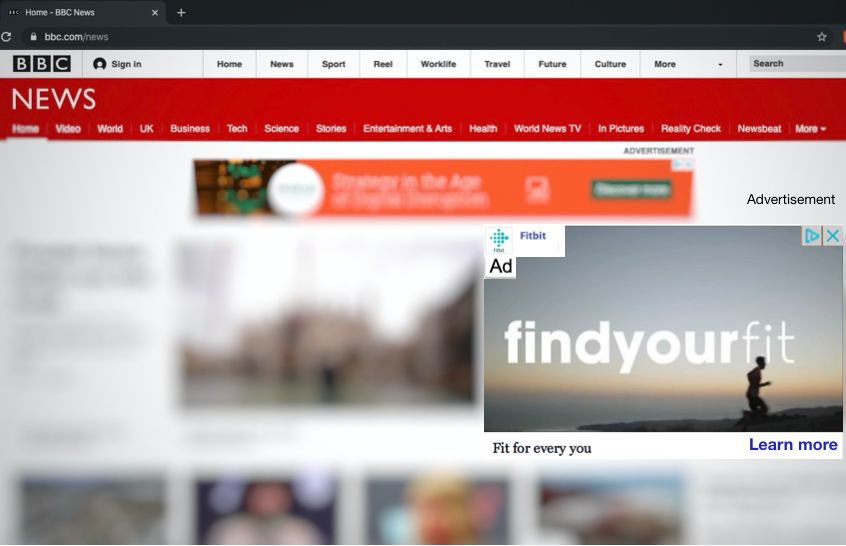
Abstract

Purpose: Personalized advertisements are everywhere when browsing the internet.
Personalization is the most used strategy by marketers, for the reason that they are able to show
customers and possible customers the products or services they may find interesting or attractive.
However, internet users have become more and more aware of the fact that marketers are using
their online footprints to tailor these ads. This leads consumers to develop reactance such as less
click-through intentions, unfavorable attitudes towards the advertisement and privacy concerns,
mainly because they encounter personalized advertisements on websites that they do not know or
they consider as untrustworthy. Various studies have investigated how levels of personalization
have an effect on click-through intentions, and how tailoring advertisement accordingly to the
consumer needs is an important trait for engagement. However, little is known about the role of
incentives in personalized advertisement and its placement in a website that is considered as
trustworthy. Thus, this research examines the effect of lower and higher levels of personalization,
rewards, website trust and attitudes on click-through intentions.

Method: To the test the hypotheses a 2 (i.e., low personalization vs. high personalization) x 2 (i.e.,
reward vs. no reward) x 2 (i.e., less trustworthy website vs. more trustworthy website) between
subjects experiment was performed. The experiment contained 8 different conditions and 210
participants from around the world.

Results: the results of the MANOVA analysis showed no three-way interaction between levels of
personalization, website trust and reward on attitudes towards the advertisement. However, it
showed a direct effect of website trust on click-through intentions and a direct effect of reward on
click-through intentions. The findings suggested that people are more inclined to click on a less
trusted website (Facebook) and when the advertisement is less personalized. The results also
showed greater click-through intentions when a reward was offered. Thus, this research provides
practical implications for marketers as it is important to consider which information is truly
relevant for internet users to match their needs and create less invasive advertising.

Keywords

Personalization, advertisement personalization, web trust, click-through intentions, attitudes,
online advertisement, online incentives, rewards.
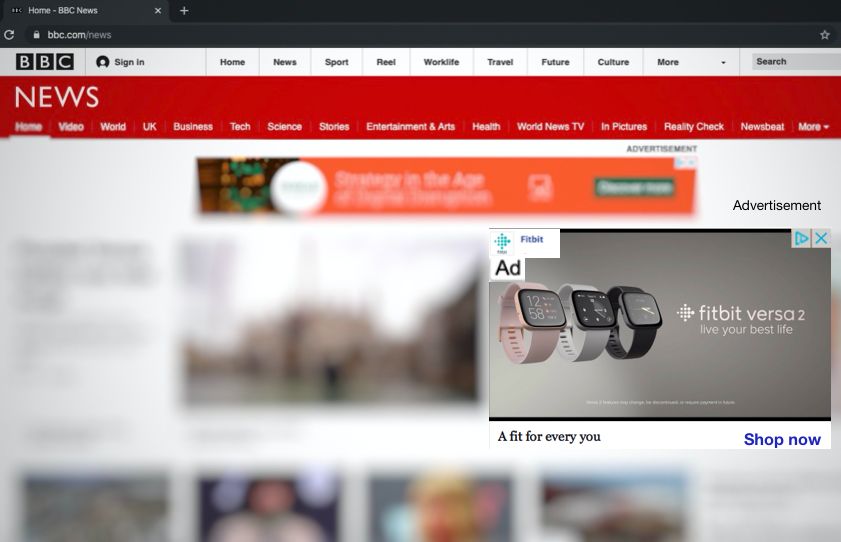
Table of Contents

   1. Introduction......................................................................................................................3
   2. Theoretical framework....................................................................................................6
      2.1 Personalized advertisement..........................................................................................6
      2.2 Levels of advertisement personalization......................................................................6
      2.3 Attitudes towards personalization................................................................................8
      2.4 Reward as moderator....................................................................................................9
      2.5 Website trust as moderator..........................................................................................10
      2.6 Conceptual model........................................................................................................12
   3. Method..............................................................................................................................13
      3.1 Procedure.....................................................................................................................13
      3.2 Stimuli material...........................................................................................................13
      3.3 Pre-test.........................................................................................................................15
      3.4 Participants..................................................................................................................16
      3.5 Manipulation check.....................................................................................................18
      3.6 Measures......................................................................................................................19
   4. Results...............................................................................................................................20
      4.1 Test between subjects design effects (MANOVA) ....................................................20
      4.2 Main effect of personalized advertisements on the dependent variable......................21
      4.3 Interaction of personalized advertisements on attitudes towards the advertisements.21
      4.4 Interaction of website trust on attitudes towards the advertisements..........................22
      4.5 Interaction of reward on attitudes towards the advertisements....................................22
      4.6 Interaction of attitudes toward advertisements on click-through intentions................22
   5. Discussion.........................................................................................................................24
   6. Theoretical implications..................................................................................................26
      6.1 Practical implications............................................................................................................27
   7. Limitations and future research.............................................................................................27
   8. References....................................................................................................................................29
   9. Appendices...................................................................................................................................34
      Appendix A. Pre-test survey.......................................................................................................35
      Appendix B. Stimulus material for the pre-test.................................................................37
      Appendix C. main study survey.........................................................................................40
      Appendix D. Stimulus Material for Main Study................................................................45
      Appendix E. Overview of items to measure constructs.....................................................53
      Appendix F. The outcomes of the validity analysis...........................................................54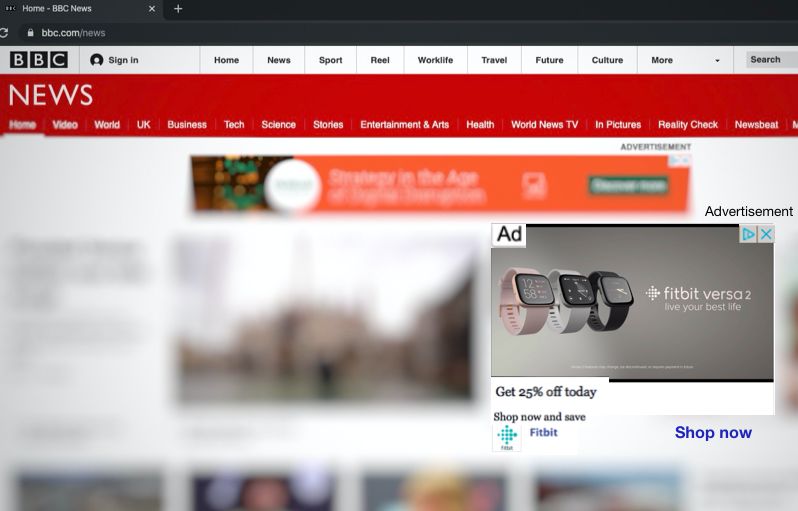
3

1. Introduction

The internet has given marketers multiple tools and opportunities to communicate, sell and engage
with their online target groups. In the past decade, the way of creating marketing strategies has
changed drastically. Nowadays, marketers have access to a massive amount of data on consumers
online behavior, clicking attitudes, and browsing habits (Shanahan, Tran & Taylor, 2019). With
this information, marketing specialists are able to create profiles of each consumer using their
browsing behaviors and information based on their digital footprints. Thus, they are capable of
showing advertisements that internet users are most likely to find attractive, as marketers have
found this to be a good strategy for increasing engagement (Matz, Kosinski, Nave & Stillwell,
2017). This type of advertisement is called personalized advertisement. The main goal of
personalization is to build relationships between a firm, its customers and potential customers.
Moreover, personalized advertisement has been investigated as a successful strategy to increase
sells, engagement and click-throughs (Gironda & Korgaonkar, 2018; Matz, Kosinski, Nave &
Stillwell, 2017).

        Many scholars have studied personalization as it has become one of the main topics of
discussion in the marketing literature. On one hand, some research has found that showing
advertisements with high levels of personalization has been consider as a threat to consumers’
freedom, as they feel that they are being observed by the organizations (Perez & Steinhart, 2013;
Bleier & Eisenbeiss, 2015). For example, a research conducted by Aguirre, Mahr, Grewal, de
Ruyterv & Wetzels (2015) found that showing tailored messages could be seen as intrusive and
internet users may develop negative responses such as privacy concerns. Furthermore, they also
found that website trust is a major factor influencing consumers’ privacy concerns. On the other
hand, researchers have acknowledged the importance of personalizing ads in ways that consumers
find attractive as this not only increases click-throughs but changes customers’ attitudes and
behaviours.(Gironda & Korgaonkar, 2018; Matz et al., 2017). Moreover, Perez & Steinhart, 2013,
examined the effectiveness of different levels of personalization and found that using high levels
of personalization showed to be more effective than no personalization. Some studies used
different methods to compare the different level of personalization (e.g. De Keyzer, Dens & De
Pelsmacker, 2015; van Doorn & Hoekstra, 2013). However, these researches yielded inconsistent
results about what motivates consumers to actually engage in click-through attitudes. Studies
conducted by Bang, Choi, Wojdynski & Lee (2019) and Ünal, Ercis & Keser (2011) showed that
consumers have favorable responses to highly personalized advertisement and have better attitudes
towards advertisement when it matches their needs. Other researchers suggested that offering
incentives can help changing consumers’ attitudes when encountering personalized advertisement.
Beldad, de Jong & Steehouder (2011) indicated that consumers may be less reluctant to click-
through on advertisements when they are offered a reward, as they do not estimate the costs of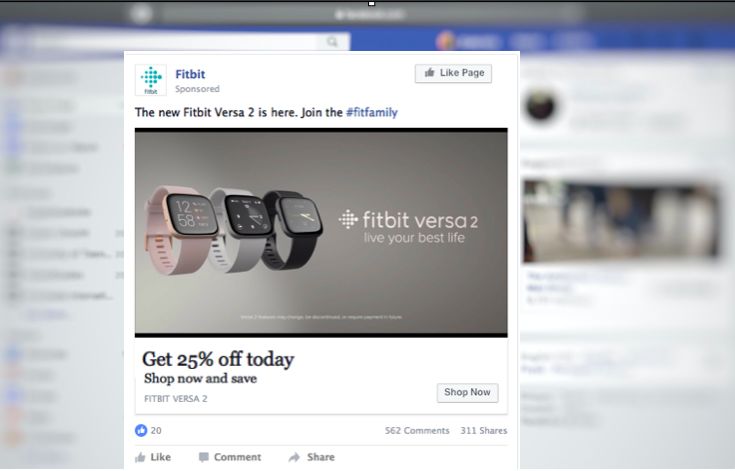
4

clicking-through and see it as an exchange of goods. The findings by Hui, Tan & Goh (2006) are
similar and indicated that tangible rewards trigger consumers’ willingness to engage with the
advertisement. Conversely, contradictory results were reported in a research conducted by Aguirre,
Mahr, Grewal, de Ruyter, and Wetzels (2015) showing that higher levels of personalization lead
to less click-through intentions. Thus, further exploration into the impact of offering a reward using
personalized advertisement is needed.

        Furthermore, another important trait in online marketing is the website where the
advertisement is placed, as a less trusted website may lead to more privacy concerns because
internet users do not have enough information about the organizations ’website, but they are
encountering personalized ads. Thus, this could lead consumers to be more reluctant, decreasing
their willingness to click-thought and have less favorable attitudes (Aguirre et al., 2015). Xie, Teo
&Wan (2004) found that a good way to make consumers engage with a website is showing
advertisements offering incentives. Beldad, et al., (2011) described that tangible rewards can
include vouchers, cash or gifts. While intangible rewards could include joining a social network
or opening an email account. Moreover, Lambe, Wittmann & Spekman (2001), argued that
intangible rewards include emotional satisfaction, values or sharing the same ideas. Hence, placing
highly personalized advertisements on less trustworthy websites and offering incentives can be
therefore a way of changing consumers’ attitudes towards the advertisement and the website.
Moreover, the inconsistency between consumers’ privacy concerns and their actual behaviors of
clicking-through when they are offered incentives could be explained by one of the self-disclosure
theories such as social exchange theory (SET) which explains why some behaviors are interpreted
by a cost and benefit analysis. SET explains that the outcomes from the interaction are not only
measured by tangible rewards but also intangible reward such as obtaining something for
emotional satisfaction, values or sharing the same ideas (Lambe, Wittmann & Spekman, 2001).

        Personalized advertisements have been extensively studied. However, in the literature the
concept of offering rewards is relatively new, and it remains to be to further explored. Thus, the
current study intends to examine in what context personalized advertisement offering a reward
may have an effect on click-through intentions. More specifically, it aims to provide insights into
the extent to which website trust and reward moderates the effects of attitudes towards the
advertisement on click-through intentions. Leading to the following research question:

RQ: To what extent do level of personalization, reward and website reputation affect consumers’
                                   click through intentions?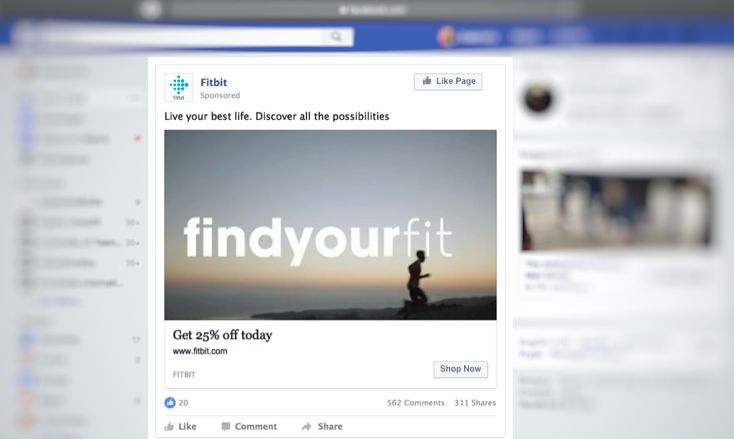
5

        Academic research has been done in the past on the different types of personalized
advertisements and website reputation on the effect it has on consumers’ click-through intentions.
However, academic research on the effect of personalization, reward and website reputation is
lacking. Therefore, this research is needed to provide a better understanding of the role of offering
incentives in online advertisement, bridging the gap between the personalized advertisement and
incentives. Moreover, not many research has focused on purely examining the effect of
personalization and reward, neither in combination with website trust. Thus, this research aims to
shed some light in the marketing literature to better understand the role of website trust, reward
and personalization. Furthermore, this research provides practical implications as marketers need
the have a better overview of consumers attitudes and what motives them to click-through on
advertisement. Moreover, this research suggests that giving consumers something in return for
being exposed to a personalized advertisement will make them less reluctant and click-through
intentions will increase. Thus, by comparing different levels of personalization in combination
with website trust and reward, marketers can better understand consumers’ attitudes towards
advertisement and customize ads more accurately taking into consideration their needs, attitudes
and concerns.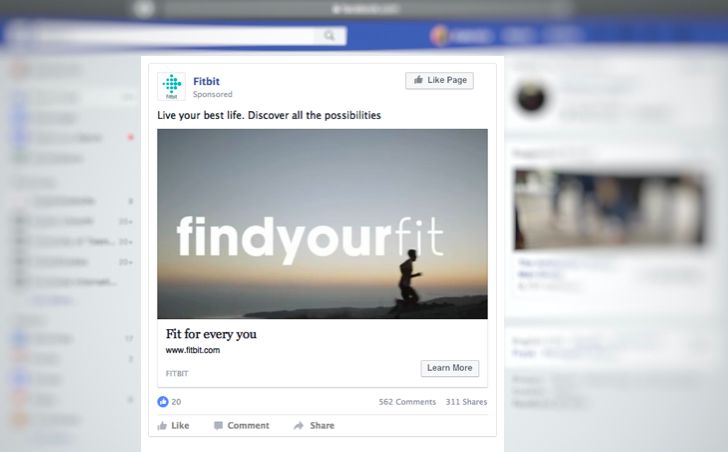
6

2. Theoretical Framework

2.1 Personalized advertisement

Nowadays companies have been using online advertisement to promote their products and
services. One of the most used methods is personalization which aims to deliver more accurate
and unique messages to online customers. Personalization refers to the development of web
content that meets the needs of consumers at the right time to maximize business opportunities
(Tam & Ho, 2006). Personalized advertisement allows companies to tailor ads using consumer’s
past behaviors. This information helps marketers to improve online experiences by showing
products or services matching their customers preferences while they are browsing the internet
(Aguirre et al., 2015). Furthermore, personalization is used to create relationships with internet
users and most of the times can be effective as organizations have access to a massive amount of
data on purchase behavior, preferences and web browsing habits. All the information is used to
ideally create engagement, loyalty, higher click-through rates and purchase behavior by
highlighting products users are likely to find attractive or have previously shown interest in
(Shanahan, Trang & Taylor, 2019).

2.2 Levels of advertisement personalization

Various research has examined the levels of personalization, ranging from zero to different levels
or ‘dimensions’ and the possible consequences of using personalized ads (Gironda & Korgaonkar,
2018; Aguirre et al., 2015; Perez & Steinhart, 2013; De Keyzer et al., 2015). For instance, Gironda
& Korgaonkar (2018) argued that personalized messages are crafted on the basis of the gathered
information about consumers, and organizations are able to customize the ads accordingly to their
target groups with the data they have available such as name, buying behavior, demographics,
location, lifestyle interests, user profiles, browsing and search history. A research conducted by
Matz et al., (2017) found that tailoring advertisements in ways that matches consumers’
psychological profiles can be more effective in influencing their behavior. For example, using
consumers’ profiles to gather information about their likes could reveal their personality, thus,
users encountering personalized advertisement matching their psychological traits are most likely
to change their behavior and choices leading to more click-throughs and buying behaviors.
Correspondingly, some studies (Bang et al., 2019; Maslowska, Smit & van den Putte, 2016) have
found that organizations are able to personalize their ads using different dimensions or
personalization. For example, using the name of the consumer, social identity, general information,
cues about their social identity such as ethnicity and social status, or targeting them as individuals
(e.g. email, birthday) or sending messages according to the social group they are identified with
(e.g. gender) leads to more click-through intentions.
7

        Moreover, these results are close to the findings in a research conducted by Perez &
Steinhart (2013), tailored advertisements are more effective than non-personalized ads, but only
when approaching internet users with lower levels of personalization. The research described three
levels of personalization that can be taken into consideration, namely (I) name appeal (high level
of personalization), (II) social identity (moderated level of personalization; e.g., age & gender) and
(III) general (low level of personalization). In this light, De Keyzer, Dens & De Pelsmacker (2015),
stated that personalization can be categorized into ‘no personalization’ or general including
approaching internet users by their relationship status and ‘full personalization’ exposing
consumers to advertising based on their location, browsing behavior, name and visits to specific
pages. Thus, ideally, the different levels of personalization influence consumers’ click through
intentions. Furthermore, a research by Aguirre et al., (2015) about online advertisement
effectiveness (measured by levels of personalization on click through intentions and website trust)
found that higher levels of personalization lead to lower click throughs. However, previous
research by Malheiros, Jennett, Patel, Brostoff and Sasse (2012) examined the effectiveness and
acceptability of rich-media personalized advertising and results showed that internet users feel less
comfortable when they encounter highly personalized ads and feel discomfort for not knowing
how the organization has obtained the data used to tailor these ads.

         Perez & Steinhart (2013), found similar results: higher levels of personalization as
mentioning consumers’ name, strengthens privacy concerns, leading to reactance towards click
through intentions. Nonetheless, the results from a study conducted by White, Zahay,
Thorbjørnsen and Shavitt (2007) found that only when consumers have a justification on why they
are seeing highly personalized advertisement (e.g. the ad is offering something they perceived as
useful) results in more favorable click throughs. However, these research yields inconsistent
results. Thus, to further investigate the impact of personalization on click-through intention, in this
research, lifestyle interests, browsing behavior, search history (Gironda & Korgaonkar, 2018) and
visits to specific pages (De Keyzer et al., 2015) are selected as the dimensions of highly
personalized advertisement leading to more click-through intention. Based on these findings the
following questions is proposed:

RQ1: To what extent do personalized advertisements lead to more click-through intentions?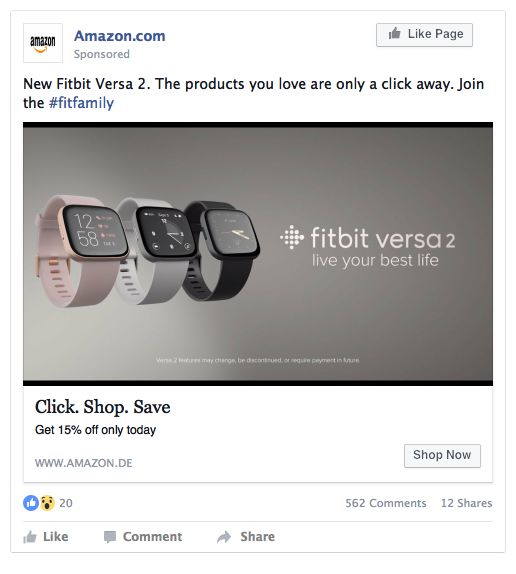
8

2.3 Attitudes towards personalization

While the usage of personalized advertisement is becoming more and more popular as a frequently
used tool by marketers, there is enough evidence that proves that consumers do not feel
comfortable and show unfavorable responses such as reactance when encountering ads (Goldfarb
& Tucker, 2011; Liu & Matilla, 2017). Attitudes towards personalization have been considered to
be one important trait in measuring consumers’ responses to ads, as their attitudes determine the
way they perceive the information provided and decide how to act upon it (Mir, 2011). Attitudes
towards advertisements was defined by Lutz (1985) as the disposition to respond favorable or
unfavorable to marketing stimulus during a specific exposure occasions. Moreover, attitudes are
important in the marketing literature as they have been considered as the predisposition for
consumers to behave in a specific way (Fishbein & Ajzen, 1975).

         Although, some users do not respond to personalization in a positive way, other internet
users may perceive value from the advertisement and it can be related to the perception they have
about the benefits they can obtain from it (Carlson, O’Cass & Ahrholdt, 2015). Accordingly, a
research conducted by Karjaluoto, Shaikh Saarijärvi & Saraniemi (2019), argued that consumers
can interpret advertisement personalization as “the aggregation of benefits that the customer is
seeking, expecting, or experiencing, as well as the possible undesired consequences resulting from
them” (p. 253). This ‘aggregation’ can also be seen as the experience they have while encountering
the ad, if it is attractive and personalized in a way that meets their preferences, they can show more
favorable responses towards the brand and more disposition to click-through (Steenkamp &
Geyskens, 2006).

        Moreover, a research conducted by Shavitt, Lowrey & Haefner (1998), showed that
consumers find advertisement informative and helpful for their decision-making process. Even
when they do not trust advertisement, they have favorable responses when the ad matches their
needs. O’Donell & Cramer (2015) examined people’s perceptions of personalized ads, and the
results showed that major life events such as looking for a weddings dress, graduation gifts or other
milestones in consumers’ life have positive effects on how they react to advertisement. Thus,
brands tailoring ads to match these life events have more positive attitudes towards clicks-throughs
as the advertisement serves to the purpose of planning a specific event. In similar vein, previous
research by Ünal, Ercis & Keser (2011) about attitudes towards mobile advertisement has shown
that when the advertisement is personalized, informative and entertaining, consumers have better
attitudes leading to click-through intentions. Correspondingly, in a study conducted by Hassan,
Fatima, Akram, Abbas & Hasnain (2013) about determinants of consumer attitude towards social-
networking sites found similar results: when consumers believe the advertisement is credible,
informative, trustworthy and they perceive value from it they have more favorable attitudes
towards advertisement.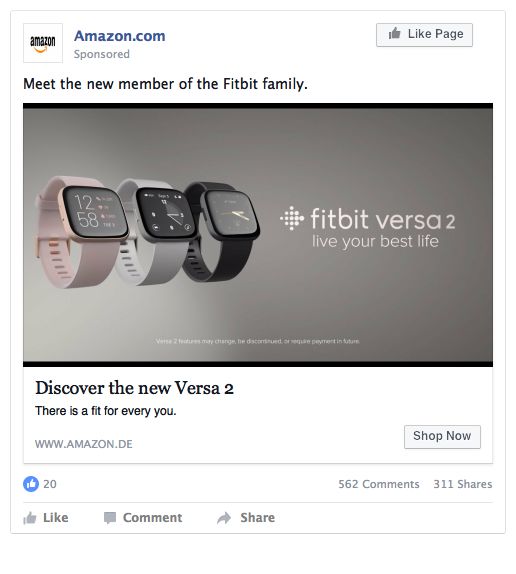
9

        However, the study conducted by O’Donell & Cramer (2015) also found that consumers’
attitudes towards click-through intentions can be affected by past bad experiences and they may
develop less favorable attitudes towards advertisement. For example, getting malware or viruses
for clicking on advertisement from unknown websites. Furthermore, they argued that recognizing
the brands’ name is an important role for trusting the advertisement. Similarly, in a research
conducted by Cho, Lee & Tharp (2001) about forced exposure to banner advertisement, it was
hypothesized that the forced exposure to advertisement make consumers develop less favorable
attitudes towards advertisement. They based this hypothesis on the theory of reasoned action by
Fishbein and Ajzen (1975) and argued that the unfavorable attitudes to the forced exposure can be
transferred to unfavorable attitudes towards the advertisement and the brand. Nevertheless, the
results yield different outcomes and found that people have favorable attitudes towards
advertisement even when they are forced to encounter advertisement because they have to pay
more attention to the information presented in the ad. Therefore, it can be predicted that attitudes
is a mediator for click-through intentions. Thus, the present research hypothesizes the following:

H1: People’s attitudes towards advertisement will be more positive when they encounter highly
personalized advertisement compared to when they encounter less personalized advertisement.

H2: The effect of advertisement personalization on click-through intentions is mediated by
attitudes towards the advertisement.

2.4 Reward as moderator

Personalized advertisement oftentimes rewards consumers with coupons or gifts to stimulate
buying behavior of certain products or services. These rewards can be tangible or intangible. A
research conducted by Beldad, et al., (2011) described that tangible rewards can include vouchers,
cash or gifts while intangible rewards could include creating a social network profile or opening
an email account. Moreover, research conducted by Lambe, Wittmann & Spekman (2001) argued
that intangible rewards include emotional satisfaction, values or sharing the same ideas. Similarly,
a study by Kaul (2016) argued that non-monetary incentives can include assistance, exclusive
access or any other benefits that cannot be sold for money. Hence, both tangible and intangible
rewards may encourage costumers’ willingness to click-through on the advertisement to obtain
these incentives.

        Moreover, a study conducted by Hui, Tan & Goh (2006), found that when consumers are
offered a reward, their perceived value is triggered, especially when they are offered tangible
benefits such as monetary discount, vouchers or gifts; driving consumers’ motivation to commit
to the advertisement presented, thus, directly influencing their willingness their attitudes and their
click-through intentions. Nevertheless, a study by Goldfarb & Tucker (2011) showed that
10
consumers might have different levels of tolerance towards personalized advertisement but only
when they perceive the advertisements as useful and provides information and the novelty of the
product. However, this tolerance can be affected by the levels of personalization used to approach
customers. Even when internet users are offered something in return (i.e. rewards), they may feel
that the ad is obtrusive and manipulative, affecting their attitudes and click-through intentions.
Furthermore, research conducted by Komulainen, Nadeem, Satokangas & Salo (2013)
examined rewards in-game banner ad clicks with tangible incentives and found that the usage of
incentives in banners such as discount coupons make consumers feel more connected to the
company and to the brand, leading to more favorable attitudes as a result of the offered price.
Similarly, Ünal, Ercis & Keser (2011) found that advertisements offering a reward positively
affects attitudes towards the advertisements. Moreover, in a study conducted by Mir (2011) the
results showed that users hold negative attitudes towards mobile personalized advertisement.
However, this changes when the advertisement offers monetary incentives, their attitudes shifts,
and they have more favorable attitudes towards advertisement.
A study on the impact of sample offer by Hupfer & Grey (2005) argued that banners
including incentives are more likely to get more click-through rates than the ones without
promotional incentives. Correspondingly, previous research by Xie, Donthu, Lohtia &
Osmonbekov (2004) investigated the effectiveness of including incentives in online advertisement
and found that offering a reward does increase and have an effect on click-throughs and attitude,
but in their research, this effect was moderated by positive emotional appeals. However, there are
no conclusive answers from earlier studies in advertisement personalization offering tangible
reward. These contrary results indicate an opportunity for further research on the influence of
reward on attitudes towards the advertisement. And it can be predicted that reward moderates the
effect of levels of personalization and attitudes towards the advertisement.
2.5 Website trust as moderator
One of the main traits for consumers to engage with advertisements is trust. Web trust plays an
important role in click-through attitudes. There are many strategies that organizations can perform
to build a trustworthy website and be recognized as trusted among its visitors. A trustworthy
website reduces internet users’ uncertainty and they may develop more favorable attitudes towards
advertisements and may be more willing to click-through on advertisements presented on those
websites that they recognize as trustworthy, as they believe the organization would never
jeopardize its reputation by ‘betraying’ its consumers trust. A study conducted by Coles & Smart
(2011), found that organizations’ efforts to gain internet users’ trust in their websites could include
using techniques such as encryption as an effort to make the website more secure. Moreover, in a
research conducted by Casado, Dimoka & Sánchez (2019) borrowing information from Tan &11
Thoen (2000), described website trust as the transaction that will be influenced by the subjective
trust internet users have in the organizations’ reputation.
Similarly, a research conducted by Hollenbeck & Macky (2019) defined online trust as the
perception users have of how believable is the information provided by the website and the
expectation they have from it. Thus, when consumers trust the organization and its website, they
may be less reluctant and show more positives attitudes towards click-through intentions, as the
firm has built a reputation to protect (Beldad et al., 2011). Moreover, in a research conducted by
Xie, Teo & Wan (2004) about volunteering personal information on the internet, the effects of
reputation, privacy initiatives, and reward on online consumer behavior, found that when an
organization website has not built trust and does not have a good reputation, presenting
advertisements offering a reward might be used as a strategy to attract consumers to interact with
the website thus, gaining internet users’ trust. However, encountering personalized advertisements
may have a counterproductive effect, as showing highly personalized advertisements on less
trustworthy websites may arouse online privacy related problems (Acquisti & Grosskalgs, 2007).
Internet users may trust the organization and the website, mainly because they have
previously interacted with the firm or have purchased a product from them. However, when
encountering advertisements offering areward, the levels of personalization used to approach the
consumers and the type of reward offered may lead consumers to have more or less tolerance
towards the personalized advertisements (Yang & Wang, 2009). Thus, organizations’ trust is an
important trait for consumers to decide if they should or should not commit to the behavior of
clicking-through, but only perhaps when the ad matches consumers’ interests and offers them an
incentive that they consider as valuable, changing their attitudes towards the advertisement,
especially when the advertisement is placed in a trustworthy website. In this light, previous
research by O’Donoghue & Rabin (1999), argued that people are impatient and want to get an
immediate reward and face the consequences later. They refer to this impatient attitude as present
bias. Internet users’ clicking-through on personalized advertisement offering them a reward in a
less trusted website, could be explained by present bias. This behavior depends on whether a
reward or cost are immediate. People experiencing present bias are only aware of the benefit they
are getting, the immediate reward, whereas any cost will be delayed (e.g. getting more highly
personalized advertisement in the future). They also argued that people always give priority and
extra weight to the present over future moments. Thus, it can be predicted that website reputation
moderates consumers’ attitudes towards the advertisement. which leads to the following set of
hypotheses:
H3: Attitudes will be more positive and click-throughs will be higher when people encounter
highly personalized advertisement from a trustworthy website even in the absence of a reward.12 H4: Attitudes will be more positive and click-throughs will be higher when people encounter highly personalized advertisement from a less trustworthy website but offers them a tangible reward. H5: Attitude towards the advertisement will be more positive and click through intention will be higher when people encounter highly personalized advertisement but only when a reward is offered compared when there is no reward. 2.6 Conceptual model To provide an overview of the proposed hypotheses presented in the previous section, all the hypotheses for this research are plotted in a conceptual model (Figure 1). Figure 1: Conceptual model
13
3. Method
The research model used for this research was a scenario-based 2x2x2 between-subjects factorial
experimental design to test the proposed hypotheses and answer to the research question. Before
conducting the main study, a pre-test was performed in order to check whether the manipulations
of level of personalization and website trustworthiness were successful. The manipulations for the
main study were adjusted after obtaining the results from the pre-test.
3.1 Procedure
For the main study and the pre-test, all participants read an informed consent in which was stated
that the experiment was anonymous, and all the information provided would be treated confidential
and only used for this experiment. Next, participants were asked to read carefully the instructions
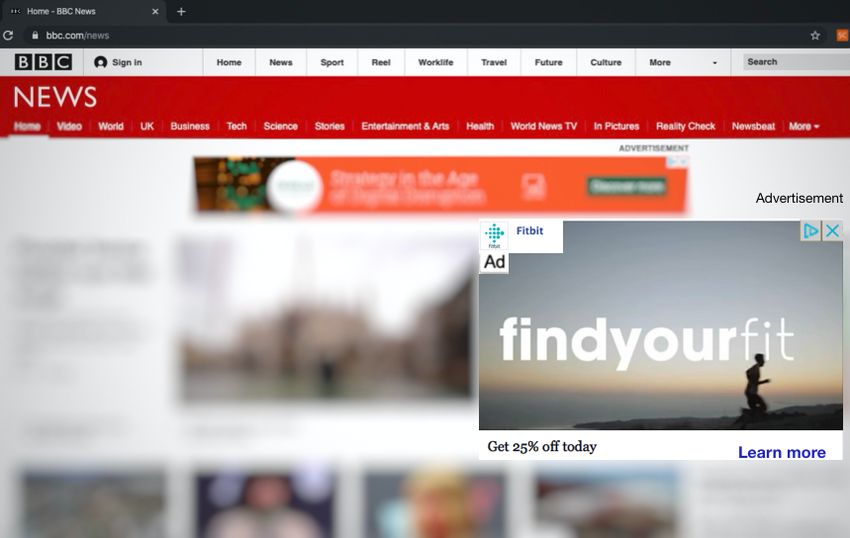
and to imagine the scenario provided for this experiment as if they would encounter these scenarios
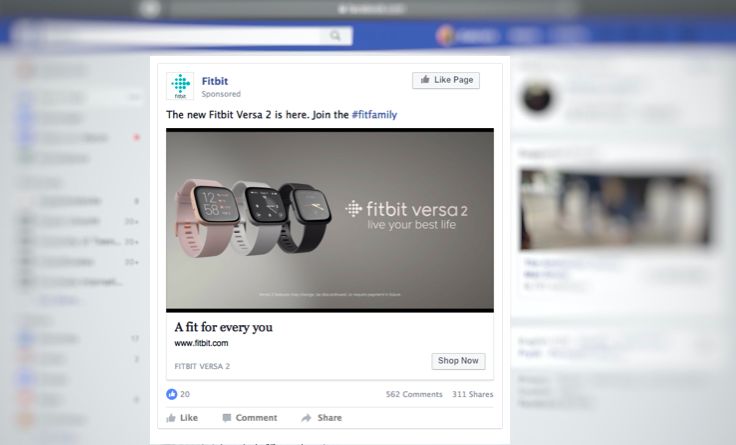
in real life. The next page presented the BBC (most trustworthy) or Facebook (less trustworthy)
page containing one of the eight conditions. In all conditions, participants encountered an Internet
activity scenario where they were searching information about smartwatches because one of their
family members who loves technology and gadgets was going to graduate.
After reading and viewing the advertisement, participants were asked to answer questions
about attitude towards the advertisement, click-through intentions and a manipulation check for
perceived personalization and trustworthiness of the website. To make sure every participant has
answered the questions accordingly, two questions about the content of the advertisement were
asked. Furthermore, participants were asked if they have previously browsed the websites that
were used to present the personalized advertisement. Those individuals with no prior experience
with the websites, were counted as invalid answers.
3.2 Stimuli material
To test the proposed hypotheses and to answer the research question, an online 2x2x2 between
subjects factorial experiment was performed using the software Qualtrics. In which level of
personalization (i.e., low level of personalization vs. high level of personalization), reward (i.e.,
offering a reward vs. not offering a reward) and website reputation (i.e., less trustworthy website
vs. most trustworthy website) were manipulated. Table 1 contains the outcome of the experimental
conditions that were generated. The experimental conditions allowed to measure attitudes towards
these ads, website reputation, rewards and click-through intentions. For this study, the brand
selected was Fitbit and for the placement of the advertisement, BBC and Facebook were selected.
The pre-test results showed that BBC’s website is considered as the most trustworthy and the
Facebook page as the least trustworthy.14
Table 1
Experimental conditions
Experimental condition Level of personalization Reward Website
1 High personalization Offer a reward More trustworthy
2 High personalization No reward More trustworthy
3 Low personalization Offer a reward More trustworthy
4 Low personalization No reward More trustworthy
5 High personalization Offer a reward Less trustworthy
6 High personalization No reward Less trustworthy
7 Low personalization Offer a reward Less trustworthy
8 Low personalization No reward Less trustworthy
One example of the scenarios presented in the manipulations is showed in Figure 2 and the
complete combination of scenarios and advertisement can be found in Appendix D.
Figure 2: Example of the scenario presented in one of the manipulations15
3.3 Pre-test
Prior to the main test, a pre-test was conducted to check the manipulations for the main study. For
each condition, 20 people were gathered to answer to an online survey. In total 60 responses were
recorded for the pre-test. All participants were randomly assigned to one of the 3 different
conditions. Pre-test participants were excluded from the main study. The pre-test survey can be
found in Appendix A.
The participants were asked to fill-in a survey in which three different conditions
containing different levels of advertisement (e.g. none, low and high) were shown. These
advertisements were used to check if the manipulations of level of personalization were successful.
The three conditions contained the same questions but differed in scenarios. The different
scenarios presented to the participants can be found in Appendix B.
First, participants had to read a scenario which contained an internet activity and the
advertisement. After reading this, all participants were asked to evaluate their perceived
personalization on a seven-point Likert scale (1-Strongly disagree, 7- Strongly agree). The results
from the pre-test showed that the means of no personalization were significantly different from the
means of low and high personalization. Nevertheless, there was no significant difference between
low and high personalization, thus, based on this result the conditions for the main study were
changed. The results of the pre-test can be found in Table 2. The pre-test also included questions
about general attitudes towards advertisement. Participants held a neutral attitude towards
personalization (M=4.61) and a neutral attitude towards advertisement (M=4.19).
Table 2
Descriptive statistics of the perceived personalization of the different conditions
M SD N
No personalization 3.16bc 1.87 20
Low personalization 5.35a 1.40 20
High personalization 5.32a .89 20
Note
a Significantly different from the no personalization condition
b Significantly different from the low personalization condition
c Significantly different from the high personalization condition
All dependent variables measured on a 7-point Likert scale (1=strongly disagree- 7=strongly agree)16
For the main study it was necessary to find two websites to be used in the manipulation and in
which the different advertisement conditions were placed. The pre-test showed ten different
websites that show advertisement as their marketing strategy and participants were asked to
evaluate the trustworthiness of each website on a seven-point Likert scale (1-Strongly disagree, 7-
Strongly agree). The results showed that BBC (M=5.90, SD=0.49) was selected as the most
trustworthy website and Facebook (M=2.81, SD=0.84) as the least trustworthy website. The
results showed that the trustworthiness of the BBC website was significantly higher than Facebook
with a mean difference of 1.900 (p=.000). Furthermore, participants were asked to also evaluate
their attitudes towards the websites. This was asked to prevent their attitudes to have an influence
on the trustworthiness of each website. The pre-test showed that participants held somewhat
positive to neutral attitudes towards BBC (M=5.55) and neutral attitudes towards Facebook
(M=4.00). Based on these results, both websites were used for the main study.
Moreover, the brand selected for the manipulations was Fitbit. Thus, participants were
asked to describe their attitudes and trustworthiness towards the brand in a seven-point Likert scale
(1-Strongly disagree, 7- Strongly agree). The pre-test results showed that participants held a neutral
attitude towards Fitbit (M=4.96) and the brand was considered somewhat trustworthy (M=5.08).
Hence, Fitbit was the selected brand for the main study.
Based on the results from the pre-test, the scenarios and advertisement manipulations were
changed accordingly to ensure a successful main test.
3.4 Participants
The participants for the main study were scouted through the personal network of the researcher.
All the participants participated in this research voluntarily and they did not receive any
compensation.
In order to collect reliable results, at least 25 people were needed for each condition. Thus,
a total number of 200 were required for all of the 8 conditions. At the end, a total number of 278
responses were recorded. From the total number of participants, 68 have never browsed BBC or
Facebook (depending on the group condition), thus these participants were not considered for this
experiment. A total number of 210 responses were used for this test of whom 81 were males
(38.1%) and 125 were females (60%) ranging from the age of 18 to 66 with different educational
levels: Bachelor = 42.9%, Pre-master = 7.6%, Master = 49%, Doctorate = 0.5%. The demographic
information can be found in Table 3 and 417
Table 3
Descriptive statistics of age and gender of the participants
Condition N Age Gender
M SD Male Female Prefer not to say
1 25 27.72 8.25 10 14 1
2 25 26.40 5.62 16 9 0
3 27 32.15 10.85 14 13 0
4 31 30.81 9.74 10 21 0
5 25 30.06 11.21 10 15 0
6 25 31.88 11.61 8 17 0
7 28 28.43 9.14 10 16 2
8 24 31.75 11.85 3 20 1
Total 210 81 125 4
Percentage 38.1% 60.0% 1.9%
Table 4
Descriptive statistics of the demographics of the respondents
Condition Education N
Bachelor degree Pre-master Master degree Doctorate degree
1 11 0 14 0 25
2 12 2 11 0 25
3 13 2 12 0 27
4 10 4 17 0 31
5 12 2 11 0 25
6 10 1 14 1 25
7 10 3 15 0 28
8 12 4 8 0 24
Total 90 17 102 1 210
Nationality N Percentage
Dutch 70 33.3%
Guatemalan 40 19.0%
German 33 15.7%
Indian 14 6.7%
Mexican 8 3.8%
Other 45 21.4%
Total 210 100%18
All the participants answered to an online questionnaire and were randomly assigned to
one of the eight conditions by using the randomizer option on Qualtrics. The collection of the data
took place from 22 November 2019 until 11 December 2019. The survey of the main study can be
found in Appendix C.
3.5 Manipulation check
A manipulation check was added to the experiment to ensure that participants understood the
experiment conditions correctly.
In order to evaluate their perception about personalization, participants were asked to
respond questions about their perceived personalization on a seven-point Likert scale from 1
(strongly disagree) to 7 (strongly agree). The constructed used to measure perceived
personalization contained four items from previous research done by Zhao (2009). The statements
used were: 1. “I think this advertisement is tailored specifically for me”, 2. “the advertisement
takes into account my current situation”, 3. “I recognize my own needs in the information provided
by the advertisement’, 4. “This advertisement contains my personal situation.”. The reliability
results showed a reliable alpha value (α = .900).
The manipulation check results are shown in Table 5. In which the means of low personalization
were different from the means of high personalization.
Table 5
Descriptive statistics of personalization for the manipulation check
M SD N
Low personalization 4.82 1.39 110
High personalization 5.43 1.49 100
Furthermore, to check the manipulation of website reputation, the different combinations of
advertisement were placed in two different websites and participants were asked to evaluate their
level of trustworthiness of the advertising website on a seven-point Likert scale ranging from
1 (strongly disagree) to 7 (strongly agree). The measure used to measure trustworthiness of the
website were adapted from previous research by Li (2014). The statements were: 1. “I think the
BCC (or Facebook) website has a good reputation”, 2. “I think the BCC (or Facebook) website has
good reputation compared with other rival websites”, 3. “I think the BCC (or Facebook) website
has good reputation for offering good services”, 4. “I think the BCC (or Facebook) website has a
reputation for being respectful to its visitors”. The results from the reliability test showed a reliable19
result (α = .958). Results from the T-test indicated a significant difference between trustworthiness
of the website between Facebook (M = 2.96, SD = 1.43, n =103) and the BCC website (M = 5.50,
SD = .93, n = 107).
To ensure that no other factors might influence the manipulation of personalization,
participant’s attitudes towards Fitbit and Fitbit trustworthiness were measured. The desirable
results of the measurement were either strongly positive nor strongly negative. The results can be
found in Table 6 and they met the desirable expectations. Therefore, the manipulations for this
study were successful.
Table 6
Descriptive statistics of possible factors which might influence the manipulations
M SD N
Attitudes towards Fitbit 4.97 1.02 210
Trustworthiness of Fitbit 4.44 1.00 210
3.6 Measures
The constructs to measure the variables of attitudes towards advertisement, click-through
intentions and perceived personalization are presented below together with their reliability scores.
All the questions were measured on a seven-point Likert scale from 1 (strongly disagree) to 7
(strongly agree). Each of the constructs and their sources are listen in Appendix E.
Attitudes towards advertising. The items used to measure attitudes towards the
advertisement were adapted from previous work done by Lee, Loo, Peng & Xian (2014), and
included the statements: 1. “I consider advertising is useful as it promotes the latest products.” 2.
“I refer to advertising because it allows me to enjoy the best deals.” 3. “I support advertising
because it plays an important part in my buying decision.” 4. “My general opinion of advertising
is favorable.” The reliability analysis showed a reliable alpha value (α = .878).
Click-through intentions. The construct for click-through intentions contained three
statements, from previous research conducted by Zhao (2019). And state: 1. “I am inclined to click
on this advertisement”, 2. “The probability of me clicking on this advertisement is high”, 3. “I
have no problem clicking on this advertisement”. The construct proved to be reliable (α =.963).20
4. Results
To test the proposed hypotheses for this research (Figure 1), a multivariate analysis of variance
(MANOVA) was performed to determine any differences across the eight different conditions.
Moreover, Table 7 shows the outcomes of the multivariate test. A Wilks’ Lambda test was
performed to examine the differences of the mean scores, standard deviations and the interaction
effects between all conditions.
Table 7
Outcome of the multivariate test for variance (GLM / MANOVA)
Wilks' Lambda F-value Sig.
Levels of personalization .892 1.81 0.16
Website trust .973 2.82 0.06
Reward .887 12.78 0.00
Levels of personalization*Website trust (interaction) .993 0.73 0.48
Levels of personalization* Reward (interaction) .994 0.62 0.53
Level of personalization*Website trust*Reward .999 0.09 0.91
4.1 Test between subjects design effects (MANOVA)
The outcomes of the Wilks’ Lambda test of between subjects design are presented in Table 8
below and shows the significant effects at alpha (a =.05).21
Table 8
Outcome of the test of between-subjects effects
F-value Sig.
Levels of personalization Attitudes towards the advertisement 2.21 0.13
Click-through intentions 3.48 0.06
Website trust Attitudes towards the advertisement 0.02 0.87
Click-through intentions 3.74 0.05*
Reward Attitudes towards the advertisement 0.25 0.61
Click-through intentions 17.69 0.00*
Levels of personalization*Website trust Attitudes towards the advertisement 0.03 0.85
Click-through intentions 1.07 0.30
Levels of personalization* Reward Attitudes towards the advertisement 0.10 0.74
Click-through intentions 0.39 0.53
.
Level of personalization*Website trust*Reward Attitudes towards the advertisement 0.17 0.67
Click-through intentions 0.11 0.73
Note: *Significant at a.=.05
Dependent variable measured on a 7-point Likert scale (1=strongly disagree-7=strongly agree)
4.2 Main effect of personalized advertisements on the dependent variable
The multivariate between subject design tests showed significant effects across the two levels of
personalization on click-through intentions. The high level of personalization conditions showed
a significant mean difference (M=3.97, SD=1.99) from the low level of personalization conditions
(M=4.42, SD=1.95). Therefore, these results can be used to answer to the research question 1,
concluding that people of the experiment are more willing to click-through on personalized
advertisements but only when they are approached by advertisements using lower levels of
personalization. Table 9 below shows the mean scores and standard deviation distribution of the
independent variables.
4.3 Interaction of personalized advertisements on attitudes towards the advertisement
The results of the analysis showed that the mean scores of the high personalization conditions were
not significantly different on attitude towards the advertisement (M=3.83, SD=1.50) than the low
personalization conditions (M=4.13, SD=1.47). Furthermore, the study showed no two-way
interaction between levels of personalization and attitudes towards the advertisements on the
dependent variable. Hence, based on the results hypotheses 1 and 2 are not supported.22
Table 9
Outcomes of the descriptive statistics from the MANOVA test
N Level of personalization Website Trust Reward M SD
Attitudes 110 Low personalization Less trustworthy No reward 4.20 1.41
Low personalization Less trustworthy Reward 4.08 1.49
Low personalization More trustworthy No reward 4.04 1.53
Low personalization More trustworthy Reward 4.25 1.50
100 High personalization Less trustworthy No reward 3.78 1.29
High personalization Less trustworthy Reward 3.96 1.65
High personalization More trustworthy No reward 3.71 1.38
Total 210 High personalization More trustworthy Reward 3.88 1.71
Click-through 110 Low personalization Less trustworthy No reward 3.91 1.86
intentions Low personalization Less trustworthy Reward 5.20 1.57
Low personalization More trustworthy No reward 3.69 1.97
Low personalization More trustworthy Reward 4.95 2.02
100 High personalization Less trustworthy No reward 3.77 1.72
High personalization Less trustworthy Reward 4.91 2.15
High personalization More trustworthy No reward 3.18 1.52
Total 210 High personalization More trustworthy Reward 3.93 2.15
4.4 Interaction of website trust on attitudes towards the advertisements
The study showed that the there was no significant moderation effect of website trust (F=0.02,
p>0.05) on attitudes towards the advertisement. (Table 8).
4.5 Interaction of reward on attitudes towards the advertisements
The MANOVA analysis showed that there was no significant moderation effect of reward on
attitudes towards the advertisements (F=0.25, p>0.05). (Table 8).
4.6 Interaction of attitudes toward advertisements on click-through intentions
The study showed no three way interaction effects between level of personalization, website and
reward on attitudes towards the advertisements. Moreover, highly personalized advertisement
placed in a less trustworthy website offering a reward showed no significant mean difference
(M=3.96, SD=1.65) from the low personalization condition (M=4.08, SD=1.49) on attitudes
towards the advertisement. Furthermore, the mean differences between high personalization from
a less trustworthy website offering a reward condition (M=4.91, SD=2.15) and the low
personalization condition (M=5.20, SD=1.57) on the dependent variable (click-through intentions)
were not significant. Therefore, hypothesis 3 and 4 are not supported. However, there is an
interaction between website trust (F=3.74, Sig.=0.05) and the dependent variable as the outcome
of the analysis showed that click-through intentions are always slightly higher for the less
trustworthy website conditions.
Furthermore, the results from the multivariate between subject design test showed no
significant difference between high personalization offering a reward (M=3.91) and in the absence
of it (M=3.75) on attitudes towards the advertisement. However, there was a significant mean23
difference on click-through intentions when the high personalization condition offers a reward
(F=17.69, Sig.=0.000, M=4.42) compared to when there is no reward (M=3.48). Thus, hypothesis
5 is partially supported.
The outcomes of hypotheses tested in this research are summarized in Table 10 below.
Table 10
Outcomes hypotheses testing
Hypothesis Outcome
H1 People’s attitudes towards advertisement will be more positive Not supported
when they encounter highly personalized advertisement compared
to when they encounter less personalized advertisement.
H2 The effect of advertisement personalization on click-through Not supported
intentions is mediated by attitudes towards the advertisement.
H3 Attitudes will be more positive and click-throughs will be higher Not supported
when people encounter highly personalized advertisement from
a trustworthy website even in the absence of a reward.
H4 Attitudes will be more positive and click-throughs will be higher Not supported
when people encounter highly personalized advertisement from
a less trustworthy website but offers them a tangible reward.
H5 Attitude towards the advertisement will be more positive and Partially supported
click-through intention will be higher when people encounter
highly personalized advertisement but only when a reward is
offered compared to when there is no reward.24
5. Discussion
The aim of this study was to experimentally investigate the effects of high and low levels of
personalization, website trust, reward, and attitudes towards the advertisement on click-through
intentions. The study investigated whether offering tangible incentives such as discounts would
lead consumers to have more favorable attitudes towards highly personalized advertisements,
increasing click-through intentions. First, it is essential to know that previous research in which
this research based its hypotheses, had mostly investigated the effect of highly personalized
advertisement on attitudes and click-through intentions but not in combination with a reward.
Additionally, website trust and reward were investigated as possible moderators to understand
whether more trustworthy website or less trustworthy website offering or not a reward would
moderate the effect of the independent variable on the mediator (attitudes) and the dependent
variable. The following section discusses the findings of this research and identifies the possible
implications.
Based on previous studies on personalization (De Keyzer, Dens & De Pelsmacker 2015;
White et al., 2007; Gironda & Korgaonkar, 2018), this research hypothesized that highly
personalized advertisement would lead to more click-through intentions. However, the results from
this study did not provide substantial evidence that approaching consumers using high levels of
personalization lead to more click-through intentions. The findings indicated that lower levels of
personalization have a much greater effect on click-through intentions. This result affirms that
consumers are more willing to click on the advertisement only when they are approached with
lower levels of personalization. The result is in line with the findings of research conducted by
Perez & Steinhart (2013) and Aguirre et al., (2015).
One possible reason for this result could be that highly personalized advertisement triggers
consumers privacy concerns. Consumers have become more aware of personalization techniques
that marketers are using online to increase click-throughs and they may perceive these attempts of
persuasion as invasive. This finding is supported by the study conducted by Malheiros et al.,
(2012), the research examined the effectiveness and acceptability of rich-media personalized
advertising and confirmed that internet users feel less comfortable when they encounter highly
personalized advertisement and feel discomfort for not knowing how the organizations have
obtained their information. Similarly, results obtained by Perez & Steinhart (2013), support this
finding as they found that high levels of personalization strengthen privacy concerns, leading to
reactance towards click-through intentions. Thus, participants may have been thinking about their
general online privacy concerns when encountering highly personalized advertisement when they
were asked to answer questions about their click-through intentions, especially those who were
exposed to the highly personalized advertisement conditions without being offered a reward.You can also read