101 Building the Leading Digital Platform for Consumer Healthcare - GoodRx investor relations
←
→
Page content transcription
If your browser does not render page correctly, please read the page content below

101
Building the Leading   Building the Largest
Digital Platform for   Digital Healthcare
Consumer Healthcare    Marketplace
September 2021         MARCH 2020
Disclaimer
This presentation contains forward-looking statements within the meaning of the Private Securities Litigation Reform Act of 1995. All statements contained in this presentation that do not relate to matters of historical fact should be
considered forward-looking statements, including without limitation statements regarding our future operations and financial results, the underlying trends in our business, our market opportunity, competitiveness of our prices, our
potential for growth, demand for our offerings, our strategic growth priorities and future offerings and our strategy. These statements are neither promises nor guarantees, but involve known and unknown risks, uncertainties and other
important factors that may cause our actual results, performance or achievements to be materially different from any future results, performance or achievements expressed or implied by the forward-looking statements, including, but
not limited to, risks related to our limited operating history and early stage of growth; our ability to achieve broad market education and change consumer purchasing habits; our ability to continue to attract, acquire and retain
consumers in a cost-effective manner; our reliance on our prescription offering and ability to expand our offerings; changes in medication pricing and pricing structures; our inability to control the categories and types of prescriptions for
which we can offer savings or discounted prices; our reliance on a limited number of industry participants; the competitive nature of industry; risks related to pandemics, epidemics or outbreak of infection disease, including the COVID-
19 pandemic; the accuracy of our estimate of our total addressable market and other operational metrics; the development of the telehealth market; our ability to maintain and expand a network of skilled telehealth providers; risks
related to negative media coverage; our ability to respond to changes in the market for prescription pricing and to maintain and expand the use of GoodRx codes; our ability to maintain positive perception of our platform and brand;
risks related to our material weaknesses in our internal control over financial reporting and any future material weaknesses; risks related to use of social media, emails, text messages and other messaging channels as part of our
marketing strategy; our ability to accurately forecast revenue and appropriately plan our expenses in the future; risks related to information technology and cyber-security; compliance with government regulation of the internet, e-
commerce and data and other regulations; our ability to utilize our net operating loss carryforwards and certain other tax attributes; management’s ability to manage our transition to being a public company; our ability to attract,
develop, motivate and retain well-qualified employees; risks related to general economic factors, natural disasters or other unexpected events; risks related to our acquisition strategy; risks related to our debt arrangements;
interruptions or delays in service on our apps or websites; our reliance on third-party platforms to distribute our platform and offerings; our reliance on software as-a-service technologies from third parties; systems failures or other
disruptions in the operations of these parties on which we depend; changes in consumer sentiment or laws, rules or regulations regarding tracking technologies and other privacy matters; risks related to our intellectual property; risks
related to operating in the healthcare industry; risks related to our organizational structure; as well as the other important factors discussed in our Annual Report on Form 10-K for the year ended December 31, 2020 as updated by our
Quarterly Report on Form 10-Q for the quarter ended June 30, 2021, and our other filings with the SEC. These factors could cause actual results to differ materially from those indicated by the forward-looking statements made in this
presentation. Any such forward-looking statements represent management’s estimates as of the date of this presentation. While we may elect to update such forward-looking statements at some point in the future, we disclaim any
obligation to do so, even if subsequent events cause our views to change.

This presentation also contains estimates and other statistical data made by independent parties and by the Company relating to market size and growth and other data about the Company’s industry. This data involves a number of
assumptions and limitations, and you are cautioned not to give undue weight to such estimates. Neither the Company nor any other person makes any representation as to the accuracy or completeness of such data or undertakes any
obligation to update such data after the date of this presentation. In addition, projections, assumptions and estimates of our future performance and the future performance of the markets in which the Company operates are necessarily
subject to a high degree of uncertainty and risk.

In light of the foregoing, you are urged not to rely on any forward-looking statement or third-party data in reaching any conclusion or making any investment decision about any securities of the Company.

This presentation includes certain financial measures that are not presented in accordance with generally accepted accounting principles in the United States, ("GAAP"), such as Adjusted EBITDA and Adjusted EBITDA Margin, to
supplement financial information presented in accordance with GAAP. There are limitations to the use of non-GAAP financial measures and such non-GAAP financial measures should not be construed as alternatives to financial
measures determined in accordance with GAAP. The non-GAAP measures as defined by the Company may not be comparable to similar non-GAAP measures presented by other companies. The Company's presentation of such
measures, which may include adjustments to exclude unusual or non-recurring items, should not be construed as an inference that the Company's future results will be unaffected by other unusual or non-recurring items. A reconciliation
is provided elsewhere in this presentation for each non-GAAP financial measure to the most directly comparable financial measure stated in accordance with GAAP.

                                                                                                                                                                                                                                                    2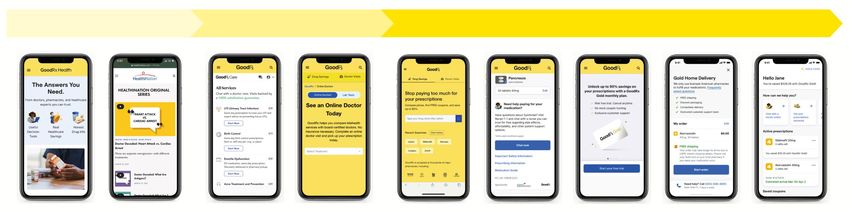
3

4

Today’s large consumer spending markets are served by successful
           consumer-focused, tech-enabled solutions

                                           $0.8Tn                                                       $1.2Tn                                     $1.5Tn     $1.5Tn       $2.8Tn
                                     Restaurants1                                              Transportation2                                     Travel3   Education4   Real Estate5

1.    Statista: 2017 total US restaurants food and drink sales.
2.    Bureau of Transportation Statistics: 2016 expenditures on transportation.
3.    Statista: 2017 contribution of travel and tourism to GDP in the United States.
4.    Zion Market Research: 2020 projection.                                                                                                                                             5
5.    Euromonitor Report: 2019 annual spending on Real Estate in the United States.
Note: Spend figures indicate total spend in these markets – not spend for the specific platforms shown or spend through online platforms at all.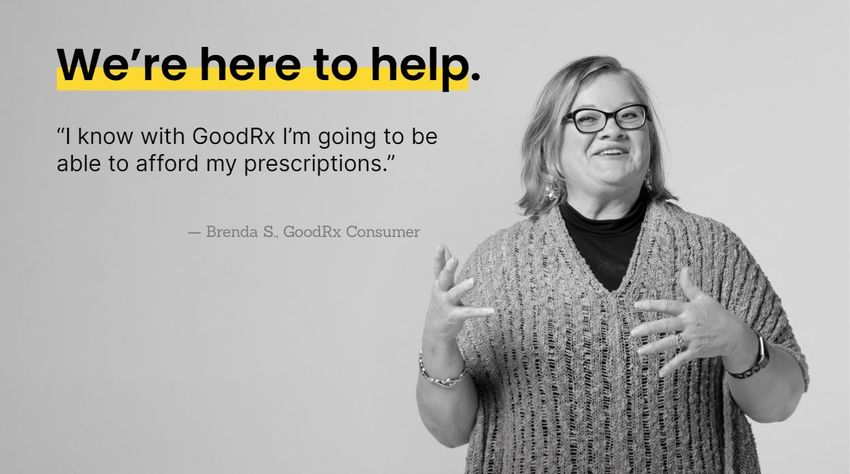
Healthcare spending is significantly higher than in other consumer markets

                            $0.8Tn                                      $1.2Tn        $1.5Tn      $1.5Tn        $2.8Tn         $4.0Tn
                   Restaurants1 Transportation2                                       Travel3   Education4   Real Estate5   Healthcare6

1.   Statista: 2017 total US restaurants food and drink sales.
2.   Bureau of Transportation Statistics: 2016 expenditures on transportation.
3.   Statista: 2017 contribution of travel and tourism to GDP in the United States.
4.   Zion Market Research: 2020 projection.                                                                                               6
5.   Euromonitor Report: 2019 annual spending on Real Estate in the United States.
6.   Centers for Medicare & Medicaid Services (CMS): 2020 projection.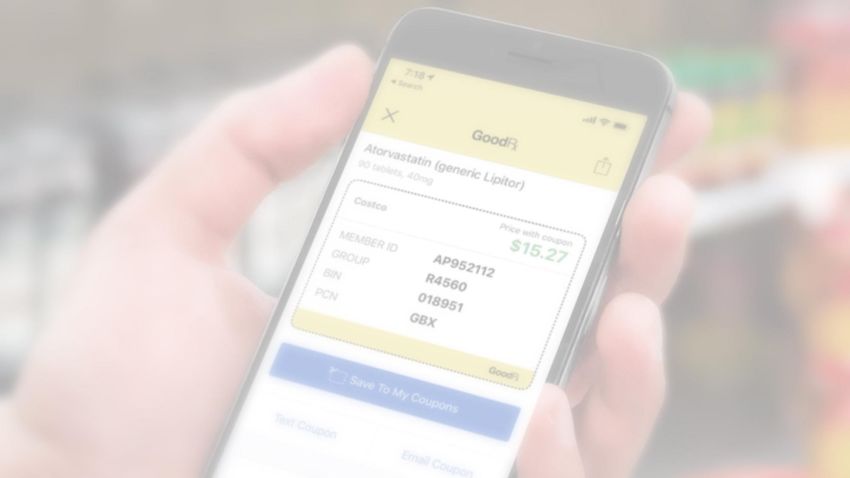
High level of spend does not drive results
                                 United Kingdom                                                                        1

                  healthcare quality1…
           lowestAustralia                                                                                             2
                                                                                                                                                                              …with some of the highest costs2
                                 Netherlands                                                                           3

                                 New Zealand                                                                           4

           Health CareNorway
                       System Performance Rankings                                                                     5                                                                                              per capita spend on healthcare by
                                 Sweden                                                                                6
                                                                                                                   OVERALL
                                                                                                                   RANKING
                                                                                                                                                                                             2x                       Americans compared to citizens of
                                                                                                                                                                                                                      other OECD countries3
                                 Switzerland                                                                           7

                                 Germany                                                                               8

                                 Canada                                                                                9

                                 France                                                                               10                                                                                              of all personal bankruptcies are linked
                                                                                                                                                                                         66%                          to medical costs4
                                 United States                                                                        11

Source: Lancet 2018 Human Capital Study; American Public Health Association 2019 Study; OECD Data
1.    Commonwealth Fund: 2017 study (as compared to Australia, Canada, France, Germany, the Netherlands, New Zealand, Norway, Sweden, Switzerland, and the United Kingdom)
2.
3.
      Peterson-KFF Health System Tracker; CMS; Commonwealth Fund: 2017 study (as compared to Australia, Canada, France, Germany, the Netherlands, New Zealand, Norway, Sweden, Switzerland, and the United Kingdom)
      Commonwealth Fund: 2017 study (as compared to Australia, Canada, France, Germany, the Netherlands, New Zealand, Norway, Sweden, Switzerland, and the United Kingdom)
                                                                                                                                                                                                                                                            7
4.    Study published in American Journal of Public Health; 2013-2016
Challenges exist for both insured and uninsured, and the cost is significant

             GoodRx helps insured & uninsured consumers1
                                                                                                                                                                              20-30% of prescriptions in the U.S. not filled2
                                                                  Uninsured
                                                                     26%

                                  Medicaid                                                                                                                                $   Nearly $300Bn in cost from non-adherence3
                                    4%
                                                                                                                                 Medicare
                                                                                                                                   34%                                        Someone dies every 4 minutes in the U.S.
                                                                                                                                                                              from not taking prescribed medicine as
                                                                                                                                                                              directed or at all4
                                    Commercial
                                       36%

1.   GoodRx survey, July 2020
2.   Internal estimate; Annals of Internal Medicine: The incidence and determinants of primary nonadherence with prescribed medication in primary care: a cohort study.                                                   8
3.   New England Journal of Medicine: Taking Our Medicine — Improving Adherence in the Accountability Era; 2018
4.   American Journal of Health System Pharmacy: Meta-analysis of trials of interventions to improve medication adherence.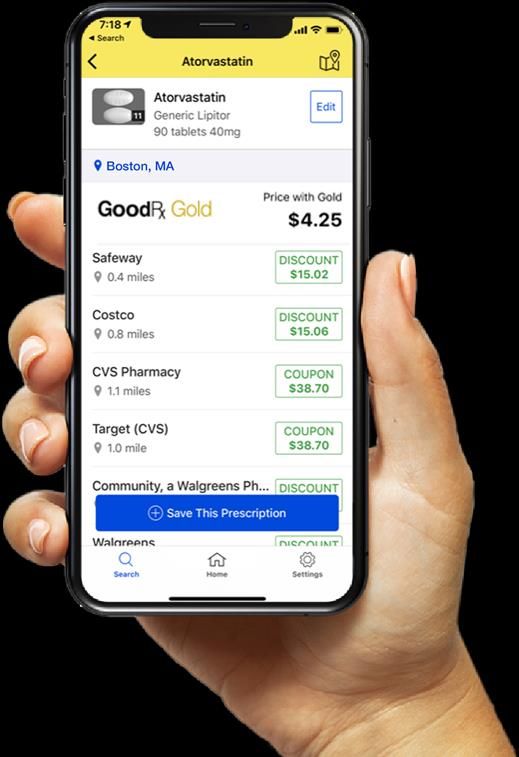
Help Americans get the
healthcare they need at a
price they can afford

Our Mission                 9
We started with prescriptions
          and have expanded our platform
                                                                                                                                                                                                                                                                     ▪ 5Bn+ annual
                                                                                                                                                                                                                                                                       prescriptions2
            US healthcare market
            $4.0 Trillion1                                                                                                                                                                                                                                           ▪ 800M+ annual physician
                                                                                                                                                                                                                                                                       visits3

                                                                                                                                                                                                                                                                     ▪ We estimate that most
                                                                                                                                                                                                                                                                       healthcare interactions
                                                                                                                                                                                                                                                                       with consumers occur at
                                                                                                                                                                                                                                                                       the pharmacy

                                       Telehealth4                                                                                                                                                                                                                   ▪ Fragmented marketplace
                                       $250Bn
                                                                                                                                                                       Prescription Drugs4
                                                                                                                                                                                                                                                                     ▪ Limited technology
                                                                                                                                                                       $524Bn
                                                                                                                                                                                                                                                                       innovation in the last 20
                                                                                                                                                                                                                                                                       years
                                                                                                            Manufacturer Solutions4
                                                                                                            $30Bn

1.   CMS: 2020 projection
2.   Drug Channel Institute; measured in 30-day equivalent prescriptions: 2018 data
3.   KFF.org and CDC: 2018 data                                                                                                                                                                                                                                                               10
4.   Prescription drugs market size based on CMS projected 2020 market size + company estimate regarding unfilled prescriptions; Manufacturer solutions market size based on 2016 medical marketing and advertising spend published in Journal of the American Medical Association in 2019;
     Telehealth market size based on 2020 projection by McKinsey & Company
GoodRx continues to expand, encompassing more of the consumer
healthcare journey
Prevention & Research Diagnosis Treatment & Adherence
GoodRx Health HealthiNation GoodRx Care Marketplace Prescription Pharma Subscription Mail Delivery Rx Refill
Savings Manufacturer Programs Reminders
Solutions and Dashboard
Content & Insights Telehealth Prescriptions
Our growing extensible platform allows us to continue to add valuable services for the millions of healthcare
providers and consumer visitors that use our platform
11Our success through the numbers
~20M 70,000+ 2M+ 90 90
Monthly Visitors1 Pharmacies with Prescribers have a Provider Consumer
up-to-date prices2 patient who has used Net Promoter Score3 Net Promoter Score3
GoodRx
$30Bn+ 80%+ $631M 43% 33%
Estimated cumulative Repeat Activity5 2Q21 LTM Revenue 2Q21 YoY 2Q21 LTM Adjusted
consumer savings4 Revenue Growth EBITDA Margin6
1. Monthly Visitors is the number of individuals who visited our apps and websites in a given calendar month. Visitors to our apps and websites are counted independently. As a result, a consumer that visits or engages with our platform through both apps and websites will be counted
multiple times in calculating Monthly Visitors. When presented for a period longer than a calendar month, Monthly Visitors is averaged over each calendar month in such period. As of 1Q21.
2. As of September 2021.
3. Consumer NPS based on survey ran in July 2021. Provider NPS based on survey ran in September 2021.
4. As of May 13, 2021. Savings are measured as the difference between the pharmacy list price and the price the consumer pays using GoodRx. Because consumers of our website and mobile application may switch pharmacies if they find a better discount, our consumer savings
calculation includes an estimate of savings achieved based on switching pharmacies.
5. Repeat activity refers to the second and later use of our discounted prices by a single GoodRx consumer; 2016-June 30, 2021.
6. Adjusted EBITDA is a non-GAAP financial measure. We calculate Adjusted EBITDA, for a particular period, as net income (loss) before interest, taxes, depreciation and amortization, and as further adjusted for acquisition related expenses, cash bonuses to vested option holders, 12
stock-based compensation expense, payroll tax expense related to stock-based compensation, loss on extinguishment of debt, financing related expenses, loss on abandonment and impairment of operating lease assets, charitable stock donation and other expense (income), net.
For a reconciliation of net income (loss), the most directly comparable GAAP financial measure, to adjusted EBITDA, see reconciliation slide in the appendix.Build the leading digital platform for consumer healthcare Our Vision 13
GoodRx provides solutions across the healthcare journey

                                                                                          Pharma
         Content                   Prescriptions             Subscriptions                                             Telehealth
                                                                                    Manufacturer Solutions

 A next-generation online         Price discovery,          Membership plans         Brand drug awareness,      Online primary care visits
   health resource where      comparison and discounts        for discounted         access and adherence       and lab-testing services
 doctors, pharmacists and         on prescriptions        prescriptions with even    solutions for healthcare
  editorial experts provide                                 higher savings and        providers and patients
 answers to thousands of                                 additional home delivery
      health questions                                    and telehealth benefits

                                                                                                                                             14
GoodRx provides solutions across the healthcare journey
Pharma
Content Prescriptions Subscriptions Telehealth
Manufacturer Solutions
A next-generation online Price discovery, Membership plans Brand drug awareness, Online primary care visits
health resource where comparison and discounts for discounted access and adherence and lab-testing services
doctors, pharmacists and on prescriptions prescriptions with even solutions for healthcare
editorial experts provide higher savings and providers and patients
answers to thousands of additional home delivery
health questions and telehealth benefits
15Introducing GoodRx Health. The health answers you need.
350+
Health conditions covered
GoodRx Personalized Video Health
2,500+
Videos in GoodRx library
Answers Newsletters Explainers Wizards
Thousands of articles Information on the Easy to understand Custom tools using
with research-backed conditions and topics guidance from data to help navigate
answers to health users care about, healthcare experts tough choices
questions delivered every week
16Content-driven top of funnel expansion helps fuel consumer acquisition and
engagement and further propels pharma manufacturer solutions growth
Massive demand for health and wellness information… …creates opportunities across the GoodRx platform
Consumer insights
Educate users and build pre-transaction readiness
Conversion to MAC and Subscribers
Reach consumers interested in healthcare research with price
3.1B discovery and discounts
Broader audiences for pharma manufacturers
Enable bigger, broader awareness opportunities within the
Monthly healthcare GoodRx ecosystem for new and existing partners
information
Cross-selling to other GoodRx products
searches1
Provide additional telehealth cross-sell opportunities
Enables new M&A opportunities
Broader consumer and provider audiences and needs create
new M&A opportunities
Our COVID Vaccine Finder exemplifies our massive reach and ability to create pre-transaction relationships;
used by 15M+ Americans and adding 2.5M+ contactable visitors to our database in a few months
1. Calculated based on the around 7% of Google’s daily health related searches as of March 2019, which is equivalent to 70,000 every minute. Source: https://www.telegraph.co.uk/technology/2019/03/10/google-sifting-one-billion-health- 17
questions-day/GoodRx provides solutions across the healthcare journey
Pharma
Content Prescriptions Subscriptions Telehealth
Manufacturer Solutions
A next-generation online Price discovery, Membership plans Brand drug awareness, Online primary care visits
health resource where comparison and discounts for discounted access and adherence and lab-testing services
doctors, pharmacists and on prescriptions prescriptions with even solutions for healthcare
editorial experts provide higher savings and providers and patients
answers to thousands of additional home delivery
health questions and telehealth benefits
18Complexity creates inefficiency at the consumers’ expense
Highly complex healthcare ecosystem Consumer faced with wide variance in price and lack of
results in lack of consistency in consumer price transparency into available alternatives
Pharmacy A
$A
Manufacturers
Pharmacy B
$B Consumer
Employers/ PBMs
Insurers
Distributors
Pharmacy C
$C
19
Note: Represents illustrative drivers of Rx pricing and end consumer purchase decision.Complexity also creates significant price variability in the same geography
GoodRx prices in Santa Monica, CA as of 9/21/21
GENERICS Price Variability
Atorvastatin
Generic Lipitor $20.90 $14.99 $9.90 $12.84 $21.15 $15.00 113%
30 capsules, 40mg
Carvedilol
Generic Coreg $33.40 $10.99 $10.45 $8.67 $36.89 $4.00 822%
60 capsules, 25mg
Bimatoprost
Generic Latisse $50.00 $95.66 $50.50 $108.08 $59.49 $144.20 188%
1 bottle (0.03%), 5ml
Aripiprazole
Generic Abilify $225.78 $10.99 $12.95 $10.17 $252.77 $19.59 2,385%
30 tablets, 5mg
BRAND
Lantus
Brand drug $336.15 $336.15 $336.15 $336.15 $336.15 $336.15 Free with co-pay assistance
1 carton
Proair
Brand drug $80.00 $80.74 $80.75 $82.35 $84.55 $81.46 Point of Sale rebate
1 hfa inhaler
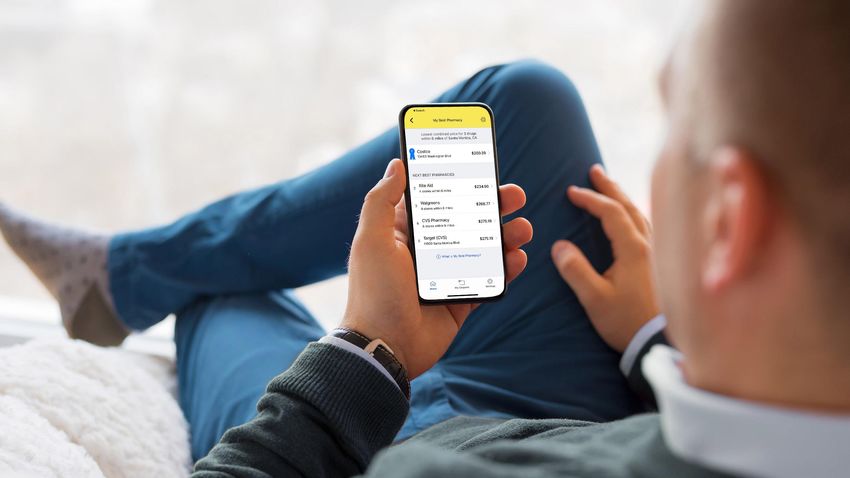
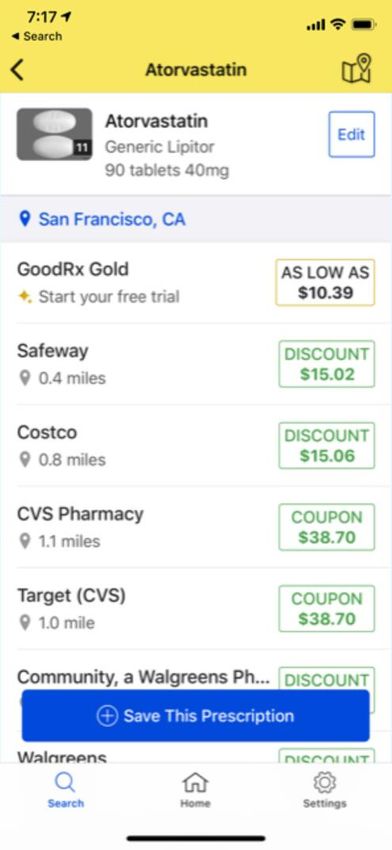
20GoodRx empowers the consumer
PBMs
▪ Single access point
Pharmacy A Pharmacy B Pharmacy C
$15.02 $38.70 $159.48
Pharmacies ▪ Greater transparency
▪ Convenience
Manufacturers Proprietary
Doctor Doctor Doctor
Technology ▪ Accelerating cost
Consumer Visit A Visit B Visit C
savings
Medicare
On-Demand On-Demand On-Demand
Patient Assistance Consult A Consult B Consult C
Programs
21
Note: Represents illustrative drivers of Rx pricing and end consumer purchase decision.We combine a complex backend with simple, elegant consumer app
Data sources Engine
Proprietary Constant
Pharmacy saving programs pricing engine data refresh
U&C prices
Medicare prices
Secure
230bn+ Living
daily pricing data database
Pharmaceutical Manufacturers points distilled
into real-time
data
Patient assistance programs
Multiple PBM networks Scalable AI / ML
22Getting pharmacy right is not easy
Store-Specific Pharmacy Dispensing Days Supply / Pharmacy PBM / Pharmacy
Supply Chain Data Tendencies Quantity Decisions Groupings System Communication
Pharmacies switch suppliers / Dispensing decisions to combine Rxs with the same quantity can PBMs price groups of pharmacies PBMs don't always provide
manufacturers frequently, or split bulk quantities be priced differently based on the differently, which is especially accurate data to retailers -
causing price variability impact price prescribed days supply relevant for multi-banner retailers GoodRx proactively overrides
and pharmacy consolidation inaccuracies for consumers
U&C Predicting State-specific Pet Pharma Manufacturer
Management Consumer Behavior Exceptions Meds Discount Programs
List prices Consumers frequently don't Taxes and regulations Pet med prescriptions require Eligibility, enrollment procedures,
vary by pharmacy, understand dosages or forms vary by state specific exclusions and pricing and program details
which can impact price of a drug can vary – GoodRx and can impact price changes as compared constantly change
predicts this for consumers to human meds
GoodRx manages over 230 billion of data points daily, has dedicated pricing experts (ex-
McKesson, ex-Express Scripts, etc.), and employs machine learning to constantly refine the
consumer experience and price accuracy
23Simple and powerful for consumers…
Free to use
Significant
consumer savings
Improves
consumer health
Benefits industry
stakeholders
Value-added
adjacencies
24… and providers
Developing provider specific
features/tools
Access pricing
data
Digital tools to
communicate
savings to patients
Educational
materials and
collateral
EHR integrations
25Consumers and healthcare providers love us “My patients with chronic care conditions pay
LESS for their meds by paying cash through
NPS Scores1
GoodRx than by going through insurance.”
902 902
Marguerite Duane, MD
“Without GoodRx’s low prices I’d never be able
64
61
to afford my medications...they basically help
50 50 to save my life month after month.”
40 KT, Patient3
32
4.8 Stars on >800K reviews4
Among Healthcare Among
Professionals Consumers
1. Non-GoodRx NPS sourced from Consumer Gauge. Netflix, 2018; Amazon, 2017; Disney, 2013; Google, 2017; UnitedHealth Group, 2018; Humana, 2014.
2.
3.
Consumer NPS based on survey ran in July 2021. Provider promoter score based on survey ran in September 2021.
Consumer Reviews from Better Business Bureau website.
26
4. As of September 24, 2021.GoodRx delivers value to multiple constituents, starting with consumers and
health care providers
Increased
$30B+ Foot Traffic
All-Time
Consumer Customer
Savings1 Consumer Pharmacies Satisfaction
Proven Growth
Channel
90
Net Promoter Long-term
Score2 Pharmacy Benefit Partnerships
Physicians Managers (PBMs)
Engage & Convert
High-Intent Users
$300B
Costs From Targeted Advertising
Non-Adherence3 to High Intent
Payers Manufacturers Consumers
1. As of May 13, 2021. Savings are measured as the difference between the pharmacy list price and the price the consumer pays using GoodRx. Because consumers of our website and mobile application may switch pharmacies if they find a better discount, our consumer savings calculation
includes an estimate of savings achieved based on switching pharmacies 27
2. GoodRx survey, September 2021
3. New England Journal of Medicine: Taking Our Medicine — Improving Adherence in the Accountability Era; 2018Our network strengthens with every transaction
Leading Platform Trusted Brand
Feedback loop
creates a
Product Expansion Scale Further Improves Pricing
hard-to-replicate
virtuous cycle
Expanding Unit Economics Strong Consumer Savings
28GoodRx unlocks incremental GMV in an
already large market
$164Bn $524Bn ▪ U.S. prescription drug spend is
projected to grow 5.7% per year2
▪ Increasing GoodRx discounts
$360Bn (79% in 2020, up from 59% in
2016) further drive accessible
Assumes 100% TAM by beating insured prices
Fill Rate
▪ Increase in utilization
20-30% management, rising copays and
Of prescriptions Are
Not Filled deductibles makes insured
benefits less rich and more
Cost challenging to use
Is a Leading Reason
Prescription Medication TAM Opportunity on Unfilled Prescriptions Total Prescriptions TAM1
1. Prescription drugs market size based on CMS projected 2020 market size of $360 Bn + company estimate regarding unfilled prescriptions
29
2. Source: CMS. Growth projection is for years 2020 through 2028We help both insured and uninsured consumers1
Uninsured
26%
Medicaid ▪ GoodRx beat the average
4% copay price 55% of the time,
saving an average of 52%,
Medicare for top drugs2
34%
Commercial
36%
1.
2.
GoodRx visitor survey, July 2020
Based on a GoodRx study, The GoodRx Effect, comparing the discounted GoodRx price to the cash/Usual & Customary price charged by pharmacies. In 2020, over 55% of prescriptions filled using GoodRx (including our Gold and Kroger membership savings programs) were
30
cheaper than the average commercial insurance copays for the 100 most purchased medications, based on industry data. When GoodRx users paid less than average commercial insurance copays, they saved on average 52% off average commercial insurance copays in 2020.Strong and improving per transaction economics
CONSUMER PBM2
▪ Take rate improved to
Discounted
GoodRx Price Portion of ~15-16% in 2021
(GMV1) Admin Fee
▪ PBM network continues to
Admin Fee
expand
▪ PBMs are fixed cost players
PHARMACY PRESCRIPTION
TRANSACTIONS that benefit from incremental
REVENUE
volume
Consumers present GoodRx at one of 70,000 pharmacies
(or refill at their preferred pharmacy with stored GoodRx information3)
for an average discount of 79%4 off their prescription medication
1. GMV represents gross merchandise value, which is the aggregate price paid by our consumers who used a GoodRx code available through our platform for their prescriptions during such period. GMV excludes any prices paid by consumers linked to our other offerings, including our
subscription offerings.
2. PBM refers to a pharmacy benefit manager. PBMs aggregate demand to negotiate prescription medication prices with pharmacies and pharma manufacturers. PBMs find most of their demand through relationships with insurance companies and employers. However, nearly all PBMs
also have consumer direct or cash network pricing that they negotiate with pharmacies for consumers who choose to purchase prescriptions outside of insurance. 31
3. When a consumer uses GoodRx, their profile is saved at the pharmacy. From then on, GoodRx typically applies to all future refills as well as, in many cases, fills for other prescriptions at that location, without the consumer having to re-present their GoodRx information.
4. Based on internal data; average discount in 2020, comparing the GoodRx discounted price to the usual and customary, or cash priceMulti-fill recurring usage drives repeat activity
First fill Refills (same prescription) Refill + new prescriptions
Most prescriptions are for chronic medication
The consumer presents GoodRx applies GoodRx applies to refills and
80%+
GoodRx1 at a pharmacy to to future refills new prescriptions without the Repeat
receive a discount without the consumer consumer having to re-
having to re-present it present it
Activity2
GoodRx is saved to the The consumer continues to The consumer continues to
consumer’s profile at the save and GoodRx continues to save and GoodRx continues to
pharmacy earn fees earn fees
1. GoodRx provides adjudication information that is stored by the pharmacy
32
2. Repeat activity refers to the second and later use of our discounted prices by a single GoodRx consumer; 2016-June 30, 2021.Strong consumer growth and reach
Monthly Active Consumers1 (M):
Effect of
COVID
stockpiling • Monthly Active Consumers
(MACs): the number of unique
consumers who use our Prescription
Transactions offering to save money
at a pharmacy in a given month.
6.0
5.6
5.7 • When presented for a quarter, it is
the average of the monthly MACs in
4.9 4.9
4.3 4.4 that quarter.
3.8
3.2 3.5
2.4 2.7
2.0 2.2
1.5 1.7
1.1 1.3 1.3
1.0
0.7 0.9
1. Refers to the number of unique consumers who have used a GoodRx code to purchase a prescription medication in a given calendar month and have saved money compared to the list price of the medication. A unique consumer who uses a GoodRx code more than once in a calendar month to
purchase prescription medications is only counted as one Monthly Active Consumer in that month. A unique consumer who uses a GoodRx code in two or three calendar months within a quarter will be counted as a Monthly Active Consumer in each such month. Monthly Active Consumers do not
include subscribers to our subscription offerings, consumers of our pharmaceutical manufacturers solutions offering, or consumers who used our telehealth offerings. When presented for a period longer than a month, Monthly Active Consumers is averaged over the number of calendar months in such
period. Beginning in the fourth quarter of 2020, our Monthly Active Consumers number includes consumers we acquired through the acquisition of Scriptcycle in August 2020. Monthly Active Consumers from acquired companies are only included beginning in the first full quarter following the 33
acquisition.Over 40% year-over-year user growth in
our prescription-related offerings
Exited the quarter with
Monthly Active Consumers (excl. RxSaver)1
Q2 ‘21 6,002K +36% YOY
Q2 ‘20 4,418K 1 7.5M+
Consumers of our
prescription-related
offerings
Subscription Plans2
Q2 ‘21 1,051K +86% YOY
June MACs +
Q2 ‘20 564K
subscription user count
1. Monthly Active Consumers (MACs) represent the number of unique consumers who have used a GoodRx code to purchase a prescription medication in a given calendar month and have saved money compared to the list price of the medication. Beginning in the fourth quarter of 2020, our
Monthly Active Consumers number includes consumers we acquired through the acquisition of Scriptcycle in August 2020. Monthly Active Consumers from acquired companies are only included beginning in the first full quarter following the acquisition; RxSaver’s MAC count is therefore not
included. Monthly Active Consumers do not include subscribers to our subscription offerings, consumers of our pharma manufacturer solutions offering, or consumers who used our telehealth offerings. When presented for a period longer than a month, Monthly Active Consumers is averaged over
the calendar months in such period. 34
2. Represents the ending subscription plan balance across both of our subscription plans, GoodRx Gold and Kroger Savings Club.GoodRx provides solutions across the healthcare journey
Pharma
Content Prescriptions Subscriptions Telehealth
Manufacturer Solutions
A next-generation online Price discovery, Membership plans Brand drug awareness, Online primary care visits
health resource where comparison and discounts for discounted access and adherence and lab-testing services
doctors, pharmacists and on prescriptions prescriptions with even solutions for healthcare
editorial experts provide higher savings and providers and patients
answers to thousands of additional home delivery
health questions and telehealth benefits
3586% YoY subscriber growth further extends our prescription user reach
Paid Subscriptions: Plan1 and Member Count (M): Prescription Transactions Subscriptions
Low Friction Relationship
One size fits all Personalized
Plans
1.5
1.4
Incremental Family
Members
1.2
1.0
1.1
0.9
0.9
0.7 0.8
0.7
0.6
0.5
Q1'20 Q2'20 Q3'20 Q4'20 Q1'21 Q2'21
1. Represents the ending subscription plan balance across both of our subscription plans, GoodRx Gold and Kroger Savings Club.
36Subscription products deliver more value to Gold
consumers and drive higher lifetime value to us Monthly Plan
1,000+ prescriptions
under $10 at up to 90%
savings off list prices
Free Mail Delivery
Discounted Access to
Telehealth Services
Kroger
Annual Plan
100+ medications for
Prescription Home Discounted free, $3, or $6 and
Savings Delivery Telehealth additional discounts on
1,000+ other
We plan to continue to increase value for Gold subscribers by prescriptions
adding additional benefits over time
37Subscriptions deliver more value to consumers and drive
higher lifetime value to us
Prescription Funnel Prescription Transactions (MAC)
▪ No registration or user info required
▪ Frequency of use (and monetization) varies based on Subscription plans, which
consumer needs:
typically come from the
▪ Acute vs. chronic
▪ 30 day fills vs. 90 day fills
same prescription funnel
▪ Other financial considerations as MACs, give us a closer
relationship with the
Subscription Plans consumer, higher
▪ Registration required and credit card on file monetization frequency,
▪ Frequency of monetization is higher
and therefore higher LTV
▪ Kroger annual subscription offers revenue certainty
throughout the year
▪ Strong renewal rates in Kroger and Gold
40
38GoodRx provides solutions across the healthcare journey
Pharma
Content Prescriptions Subscriptions Telehealth
Manufacturer Solutions
A next-generation online Price discovery, Membership plans Brand drug awareness, Online primary care visits
health resource where comparison and discounts for discounted access and adherence and lab-testing services
doctors, pharmacists and on prescriptions prescriptions with even solutions for healthcare
editorial experts provide higher savings and providers and patients
answers to thousands of additional home delivery
health questions and telehealth benefits
39Pharma Manufacturer Solutions is GoodRx’s fastest growing offering with the
most attractive economics
~20M Attractive
High Intent
Monthly Visitors1
~3X Economics 150%+
YTD YoY Revenue Capitalizing on Net Revenue
Growth4 Existing Traffic Retention5
20%
of GoodRx Searches
are for Brand Drugs2
10x+ 19 100+ 85%
Of Top 20 Pharma Brands of Revenue Substantially
More Traffic than Pharma Manufacturers We Work With2 Flat Fee Based6
Pharma Manufacturer’s Work with Us2
own Drug Sites3
1. As of Q1’21.
2. Based on internal data as of YTD Q2 2021.
3. Based on internal analysis comparing the top 100 brand drug volume to GoodRx drug pages compared to the volume on the manufacturer’s own savings portion of their drug sites. Figure reflects avg of all ratios.
4. Reflects YTD revenue growth H1 2021 over H1 2020. 40
5. YTD 2Q21 Net Revenue Retention compares total revenue generated from all clients in the YTD period ended 6/30/20 to total revenue generated from the same clients in the YTD period ended 6/30/21 (i.e., excludes new client relationships beyond 6/30/2020).
6. Based on internal data. Reflected revenue that is not variable/volume based.Our deep provider and consumer relationships position us uniquely with
pharma manufacturers
GoodRx for GoodRx for
Providers Consumers
400K+ HCPs and HCP offices distribute GoodRx Materials1 Access to medication improved according to 93% of HCPs5
88% awareness with HCPs & ~80% recommended GoodRx2 Patient adherence improved according to 87% of HCPs4
25% of platform visitors are HCPs3 GoodRx beats insurance 50%+ of the time by an avg of 50%+6
2M+ prescribers have a patient who used GoodRx1 GoodRx users have saved over $30B to date7
HCP NPS of 904 Consumer NPS of 904
“GoodRx is giving patients access to medicines that they wouldn't otherwise be able to afford.”
— Dr. Joe Flores, California
1. Based on internal data.
2. Based on an internal survey run in July 2020.
3. Based on an internal survey run in September 2021.
4. Net Promoter Score. Consumer NPS based on survey ran in July 2021. Provider NPS based on survey ran in September 2021.
5.
6.
Based on an internal survey run in July 2021.
Based on a GoodRx study, The GoodRx Effect Comparing the discounted GoodRx price to the cash/Usual & Customary price charged by pharmacies. In 2020, over 55% of prescriptions filled using GoodRx (including our Gold and Kroger membership savings programs) were
41
cheaper than the average commercial insurance copays for the 100 most purchased medications, based on industry data. When GoodRx users paid less than average commercial insurance copays, they saved on average 52% off average commercial insurance copays in 2020.
7. Comparing the discounted GoodRx price to the cash/Usual & Customary price charged by pharmacies.The specific issues surrounding branded medications create challenges for
pharma manufacturers, patients and HCPs
Pharma Manufacturers
$30B ▪
▪
Looking to increase utilization of robust patient support and affordability solutions
Pharma rep interactions down 70% in 20204
Medical marketing and
advertising spend by ▪ IDFA and a cookieless world may limit the ability to digitally engage the right audience
pharma manufacturers1
Patients
69% ▪ Branded medication costs have increased 78% since 20145
Of patients have made personal ▪ Patient awareness and utilization of existing manufacturer support programs is very low6
sacrifices to afford medications2 ▪ 30% of prescriptions in the US are left unfilled at the pharmacy and the main reason is cost⁷
70% HCPs
Of HCPs say high cost is ▪ 77% of patients think it is very important to discuss affordability options with their doctor8
the number one reason ▪ HCPs spend an average of 14.6 hours per week on administrative tasks for therapy access9
patients don’t pick up
prescriptions3 ▪ 87% of HCPs do not want in person pharmaceutical sales rep visits10
1. Medical Marketing in the United States (https://jamanetwork.com/journals/jama/fullarticle/2720029)
2. CoverMyMeds Patient and Provider Surveys, 2020 (https://www.prnewswire.com/news-releases/new-data-reveals-nearly-70-of-patients-make-personal-or-financial-sacrifices-to-afford-medications-301081467.htm)
3. https://www.optimizerx.colm/hubfs/OptimizeMDs/OptimizeMD_Survey_010821_by_OptimizeRx_and_THINK_Health.pdf
4. https://www.mckinsey.com/industries/pharmaceuticals-and-medical-products/our-insights/ready-for-launch-reshaping-pharmas-strategy-in-the-next-normal
5. GoodRx List Price index (https://www.datawrapper.de/_/NeZUf/)
6. https://www.fiercepharma.com/marketing/pharmas-return-5-billion-spent-yearly-patient-support-programs-only-3-use-survey; CoverMyMeds Patient Survey, 2020 (https://insights.covermymeds.com/patient-experience/affordability/finding-prescription-affordability-options-amid-a-flood-of-cards)
7.
8.
https://www.ncbi.nlm.nih.gov/pmc/articles/PMC6045499/
Based on 2016 medical marketing and advertising spend published in Journal of the American Medical Association in 2019
42
9. https://www.ama-assn.org/practice-management/sustainability/prior-authorization-major-practice-burden-how-do-you-compare
10. https://newsroom.accenture.com/news/pharma-companies-have-improved-how-they-engage-with-healthcare-providers-during-covid-19-finds-new-research-from-accenture.htmPharmaceutical manufacturers invest in Awareness, Access and Adherence
strategies along the patient journey
Adherence Strategies
Access Strategies
▪ Refill reminders
▪ Copay cards and free drug programs
▪ Patient coaching and support to
▪ Large call center operations answer questions or concerns
▪ Decentralized clinical trial model
Awareness Strategies
▪ TV, online and offline (including
within physicians’ offices)
▪ Material shift to the mix from offline
to online channels
▪ Reaching the right audience at the
right point in time is critical
43GoodRx has Awareness, Access and Adherence solutions to meet
pharma manufacturer, patient and HCP needs
Current
Access
AdherenceCurrent
Solutions
Solutions
Access Solutions
• Refill reminders Adherence
▪ • Patient
Copay Navigator
cards and free drug programs
▪ Clinical trialcenter
enrollment • Patient coachingSolutions
and support to
• Large call operations
▪ Care Portals ▪ Tech-enabled NurseorChat
answer questions concerns
• Decentralized clinical trial model
▪ Data driven adherence platform
Awareness Solutions
Current
• TV, online and offline (including within
Awareness
the physicians office)
Solutions
• Material shift to the mix from offline to
▪ GoodRx editorial content
online channels
▪ HealthiNation from GoodRx
• video
Reaching the right audience at the
content
right point in time is critical
▪ Sponsored listings and fixed
placement advertisement
44Improving Awareness, Access and Adherence drives better outcomes for all
stakeholders
Manufacturer Benefit Consumer Benefit HCP Benefit
Ability to easily find HCP reviewed
Awareness Ability to promote innovative and life Ability to easily find and recommend
authoritative educational resources
Solutions saving products and services educational resources to patients
for their medications and conditions
Access Ability to enable incremental Ability to easily find savings and Ability to easily find and recommend
Solutions consumers to start on therapy support resources to start on therapy savings and support resources to
patients
Adherence Ability to increase adherence, Provides consumers a highly trusted
delivering increased LTV for patients and confidential liaison to help them Creates confidence patients will stay
Solutions
on therapy through their patient journey on therapy and offloads work
Value propositions
Pharma Manufacturers convert Consumers receive savings and HCPs drive better patient
high LTV patients at a better support they need to start and outcomes and patient satisfaction
ROI than alternative solutions stay on therapy while saving administrative time
45We are at the early stages of penetrating the pharma manufacturer
opportunity
Opportunity
3
10% of 550 1.5
Current U.S. manufacturers
relationships1
with pharma Successfully
manufacturers upselling Avg. solutions sold Avg. solutions sold
Opportunity 95% of Top 20 per brand one year per brand today
U.S. manufacturers ago
8
5
Significant
brand Innovating our
Opportunity
expansion solution set
runway Only 4% of ~1,000
brands of top 20 manufacturers Available solutions Available solutions
one year ago today
1. Working with GoodRx for at least one brand. 46GoodRx provides solutions across the healthcare journey
Pharma
Content Prescriptions Subscriptions Telehealth
Manufacturer Solutions
A next-generation online Price discovery, Membership plans Brand drug awareness, Online primary care visits
health resource where comparison and discounts for discounted access and adherence and lab-testing services
doctors, pharmacists and on prescriptions prescriptions with even solutions for healthcare
editorial experts provide higher savings and providers and patients
answers to thousands of additional home delivery
health questions and telehealth benefits
47Telehealth provides an additional entry point to our platform and two-way
cross-sell opportunities
Additional entry point focused on low cost, 60% of Care visits driving incremental revenue
prescription associated conditions through our other offerings
20% of consumers 2
do not have a prescription See a provider via
at the time of their telehealth and receive
GoodRx search1 a prescription if necessary
Visits start at $19 for Gold
Gold Upsell Integrated coupon Home Delivery
Members and $39 for others
1. Internal data, as of August 2020.
48
2. HeyDoctor by GoodRx rebranded as GoodRx Care in Q1 2021.How GoodRx makes money
Prescription Transactions Revenue Telehealth Revenue
Discounted Admin Fee Portion of Admin Fee for Telehealth visit
GoodRx Price Fee (as low as $19 for
CONSUMER (GMV1) PHARMACY PBM2 PRESCRIPTION Gold subscribers and
GOODRX CARE TELEHEALTH
TRANSACTIONS REVENUE PATIENT $39 for all others) REVENUE
(Other Revenue)
Subscription Revenue
Prescription needed?
Monthly Fee Annual Fee3
($36 for an individual and Uses GoodRx at Pharmacy
($5.99 for an
$72 for a family, (Prescription Transactions
GOLD Individual and SUBSCRIPTION KROGER
$9.99 for a family) a portion shared with SUBSCRIPTION Revenue example) PRESCRIPTION
SUBSCRIBER REVENUE SUBSCRIBER Kroger) REVENUE
TRANSACTIONS REVENUE
Pharma Manufacturer Solutions Revenue OR
Primarily Flat Fees Selects Mail Order and Pays
(85% of fees are Service Fee
PHARMA flat rate) PHARMA MANUFACTURER TELEHEALTH
MANUFACTURER SOLUTIONS REVENUE REVENUE
(Other Revenue) (Other Revenue)
1. GMV represents gross merchandise value, which is the aggregate price paid by our consumers who used a GoodRx code available through our platform for their prescriptions during such period. GMV excludes any prices paid by consumers linked to our other offerings, including our subscription
offerings.
2. PBM refers to a pharmacy benefit manager. PBMs aggregate demand to negotiate prescription medication prices with pharmacies and pharma manufacturers. PBMs find most of their demand through relationships with insurance companies and employers. However, nearly all PBMs also have
consumer direct or cash network pricing that they negotiate with pharmacies for consumers who choose to purchase prescriptions outside of insurance.
23
49
3. The portion kept by GoodRx is recognized over the 12 month subscription period.Strong revenue growth uniquely coupled with high profitability
Investing in product and
marketing to accelerate
growth in 2022 and
Adj. EBITDA ($M)1 beyond
Revenue ($M)
54% 61%
CAGR
CAGR
$631
$551 $203 $208
$388 $160
$128
$250
$157 $63
$99 $30
2016 2017 2018 2019 2020 LTM Q2'21 2016 2017 2018 2019 2020 LTM Q2'21
1. Adjusted EBITDA is a non-GAAP financial measure. We calculate Adjusted EBITDA, for a particular period, as net income (loss) before interest, taxes, depreciation and amortization, and as further adjusted for acquisition related expenses, cash bonuses to vested option holders, stock-
based compensation expense, payroll tax expense related to stock-based compensation, loss on extinguishment of debt, financing related expenses, loss on abandonment and impairment of operating lease assets, charitable stock donation and other expense (income), net. For a 50
reconciliation of net income (loss), the most directly comparable GAAP financial measure, to adjusted EBITDA, see reconciliation slide in the appendix.Strong Scale and Reach, with Opportunities to Improve Monetization
Prescription Related Pharma Manufacturer
Top of Funnel Telehealth
Offerings Solutions
• ~20 Million Monthly • 40%+ YoY growth to • 3x YoY growth • 60% cross-sell from
Visitors 7.5m+ users telehealth
• 19 out of top 20
• GoodRx Health • Improved pricing manufacturers, but only • Upside in cross-sell to
4% brand penetration telehealth
• HealthiNation • 80%+ repeat rate
• HCP relationships • Additional entry point
• Brand awareness • HCP relationships
• Strong pipeline
• HCP relationships • Personalization and
customization
• Unpaid traffic
• Home delivery
• Paid marketing
Additional services to monetize visitor base and further improve unit economics, organically and via M&A-based offerings
23
51Enhancing competitive moat while making good on our mission
Increase LTV of existing Move consumers into Expand number of Increase cross-sell Expand access and
consumers and acquire subscription plans to drive partners, enhance our opportunities and maintain coverage through third-
new consumers more savings and higher existing offerings, and additional entry point party partners to further
LTV and increase introduce new integrated deliver on our mission
recurring revenue technology solutions
Prescription Subscription Pharma Telehealth Expand
Transactions Offering Manufacturer Platform
Offering Solutions
Increase brand awareness and drive higher consumer engagement
52Building the leading digital platform for consumer healthcare
Transparency and trust is core to our platform
Consumer first approach is always top of mind
Macro trends drive the need for our solutions and technology
First mover advantage and partnership strategy create deep competitive moat
Every transaction reinforces value proposition to the ecosystem
Unique combination of scale, high-growth and profitability
Opportunity to become the leading digital healthcare platform in the UnitedStates
40
53Thank You
Q&A
Appendix
Our management team is mission-driven and committed to improving
healthcare in America

                                                   Karsten Voermann   Andrew Slutsky     Justin Fengler                   Jim Sheninger
                                                   Chief Financial    President,         SVP, Corporate Strategy          SVP, Pharmacy Strategy
                                                   Officer            Consumer           & Business Operations            Officer

         Doug Hirsch
         Co-CEO

                                                   Bansi Nagji        Jody Mulkey        Babak Azad                       Gracye Cheng
                                                   President,         Chief Technology   Chief Marketing Officer,         Vice President &
                                                   Healthcare         Officer            SVP Marketing & Communications   General Counsel

         Trevor Bezdek
         Co-CEO
                  Biowire      Tryarc
                            acquired by NTT Data

                                                                                                                                             57
Adjusted EBITDA Reconciliation
Year Ended December 31
(dollars in thousands) 2016 2017 2018 2019 2020 LTM
Net Income (Loss) $8,9131 $28,7721 $43,793 $66,048 ($293,623) ($315,577)
Interest income (21) (24) (154) (715) (160) (73)
Interest expense 3,541 6,970 22,193 49,569 27,913 24,291
Income tax expense (benefit) 6,188 10,931 8,555 16,930 (9,827) (75,114)
Depreciation and amortization1 9,089 9,099 9,806 13,573 18,430 23,294
Other expense (income), net 154 (5) 7 2,967 (22) (1)
Loss on extinguishment of debt2 - 3,661 2,857 4,877 - -
Cash bonuses to vested option holders3 - 1,400 38,800 - - -
Financing related expenses4 - - - 463 1,319 328
Acquisition related expenses5 142 2 15 2,170 7,366 12,193
Stock-based compensation expense6 2,002 2,150 1,762 3,747 397,285 480,156
Charitable stock donation7 - - - - 41,721 41,721
Payroll tax expense related to stock-based compensation - - 61 173 12,086 14,849
Loss on abandonment and impairment of operating lease assets8 - - - - 961 1,741
Adjusted EBITDA9, 10 $30,008 $62,956 $127,695 $159,802 $203,449 $207,808
Adjusted EBITDA Margin11 30.2% 40.0% 51.2% 41.2% 36.9% 32.9%
1. 2016 and 2017 were audited using private company standards. Net Income and Depreciation and Amortization presented reflect the elimination of goodwill amortization due to shift away from private company GAAP and to make them comparable to 2018, 2019 and 2020 audited.
2. Related to early repayment of debt.
3. $38.8m in in 2018 reflect bonuses paid to vested option holders in connection with special dividend payments made to stockholders.
4. Financing related expenses include third party fees related to proposed financings.
5. Acquisition related expenses include third party fees for actual or planned acquisitions, including related legal, consulting and other expenditures, retention bonuses to employees related to acquisitions, and change in fair value of contingent consideration.
6. Non-cash expenses related to equity-based compensation programs, which vary from period to period depending on various factors including the timing, number and the valuation of awards.
7. Non-cash expense related to a donation of 1,075,000 shares of our Class A common stock that was made to a charitable foundation in the fourth quarter of 2020.
8. Non-cash loss on the abandonment and impairment of operating lease assets related to certain office space that was abandoned or subleased.
9. Adjusted EBITDA is a non-GAAP financial metric. 58
10. Totals may not sum due to rounding.
11. Adjusted EBITDA Margin is calculated as Adjusted EBITDA divided by revenues.Glossary
GMV (Gross Merchandise Value) - The aggregate price paid by our consumers who used a GoodRx code available through our platform for their
prescriptions during such period. GMV excludes any prices paid by consumers linked to our other offerings, including our subscription offerings.
MACs (Monthly Active Consumers) - The number of unique consumers who have used a GoodRx code to purchase a prescription medication in a given
calendar month and have saved money compared to the list price of the medication. A unique consumer who uses a GoodRx code more than once in a
calendar month to purchase prescription medications is only counted as one Monthly Active Consumer in that month. A unique consumer who uses a
GoodRx code in two or three calendar months within a quarter will be counted as a Monthly Active Consumer in each such month. Monthly Active
Consumers do not include subscribers to our subscription offerings, consumers of our pharma manufacturer solutions offering, or consumers who used our
telehealth offerings. When presented for a period longer than a month, Monthly Active Consumers is averaged over the number of calendar months in such
period. Monthly Active Consumers from acquired companies are only included beginning in the first full quarter following the acquisition.
Medication Adherence - Medication adherence usually refers to whether patients take their medications as prescribed, as well as whether they continue to
take a prescribed medication.
Monthly Visitors - The number of individuals who visited our apps and websites in a given calendar month. Visitors to our apps and websites are counted
independently. As a result, a consumer that visits or engages with our platform through both apps and websites will be counted multiple times in calculating
Monthly Visitors, while family members who use a single computer to visit our websites will be counted only once. Additionally, Monthly Active Consumers
who use a GoodRx code without accessing our apps or websites (since their GoodRx codes were saved in their profile at the pharmacy), will not be counted
as Monthly Visitors. When presented for a period longer than a calendar month, Monthly Visitors is averaged over each calendar month in such period.
PBM (Pharmacy Benefit Manager) - PBMs aggregate demand to negotiate prescription medication prices with pharmacies and pharma manufacturers.
PBMs find most of their demand through relationships with insurance companies and employers. However, nearly all PBMs also have consumer direct or
cash network pricing that they negotiate with pharmacies for consumers who choose to purchase prescriptions outside of insurance.
Repeat Activity - The second and later use of our discounted prices by a single GoodRx consumer, whether refilling an existing prescription or filling a new
prescription.
Subscribers - Our consumers that are subscribed to either of our subscription plans, GoodRx Gold or Kroger Savings Club.
59You can also read