Proposal and Comparative Study of Evolutionary Algorithms for Optimum Design of a Gear System
←
→
Page content transcription
If your browser does not render page correctly, please read the page content below
Received December 17, 2019, accepted December 26, 2019, date of publication December 30, 2019,
date of current version January 7, 2020.
Digital Object Identifier 10.1109/ACCESS.2019.2962906

Proposal and Comparative Study of Evolutionary
Algorithms for Optimum Design of a Gear System
MÁXIMO MÉNDEZ 1 , DANIEL A. ROSSIT                                    2,3 ,   BEGOÑA GONZÁLEZ                   1,

AND MARIANO FRUTOS 2,4
1 Instituto
         Universitario SIANI, Universidad de Las Palmas de Gran Canaria (ULPGC), 35001 Las Palmas de Gran Canaria, Spain
2 Departmentof Engineering, Universidad Nacional del Sur, Bahía Blanca 8000, Argentina
3 INMABB-CONICET, Bahía Blanca 8000, Argentina
4 IIESS-CONICET, Bahía Blanca 8002, Argentina

Corresponding author: Máximo Méndez (maximo.mendez@ulpgc.es)
This work was supported by CYTED (Grant P318RT0165) and the Instituto Universitario SIANI-ULPGC.

   ABSTRACT This paper proposes a novel metaheuristic framework using a Differential Evolution (DE)
   algorithm with the Non-dominated Sorting Genetic Algorithm-II (NSGA-II). Both algorithms are combined
   employing a collaborative strategy with sequential execution, which is called DE-NSGA-II. The DE-NSGA-
   II takes advantage of the exploration abilities of the multi-objective evolutionary algorithms strengthened
   with the ability to search global mono-objective optimum of DE, that enhances the capability of finding
   those extreme solutions of Pareto Optimal Front (POF) difficult to achieve. Numerous experiments and
   performance comparisons between different evolutionary algorithms were performed on a referent problem
   for the mono-objective and multi-objective literature, which consists of the design of a double reduction
   gear train. A preliminary study of the problem, solved in an exhaustive way, discovers the low density of
   solutions in the vicinity of the optimal solution (mono-objective case) as well as in some areas of the POF of
   potential interest to a decision maker (multi-objective case). This characteristic of the problem would explain
   the considerable difficulties for its resolution when exact methods and/or metaheuristics are used, especially
   in the multi-objective case. However, the DE-NSGA-II framework exceeds these difficulties and obtains the
   whole POF which significantly improves the few previous multi-objective studies.

   INDEX TERMS Differential evolution, evolutionary computation, gear train optimization, genetic algo-
   rithms, mechanical engineering, multi-objective evolutionary algorithms, non-dominated sorting genetic
   algorithm-II.

I. INTRODUCTION                                                                                but, it uses computer operators similar to those employed by
Stochastic in nature, evolutionary algorithms (EAs) in their                                   a standard EA. Each population consists of individuals called
version of genetic algorithms (GAs) [1]–[3] have been                                          parameter vectors or genomes. Based on the concept of vector
applied effectively in science, engineering and engineering                                    difference, DE combines with certain probability the compo-
design [4]–[7]. The evolution of a population of solutions,                                    nents of randomly selected and distinct existing individuals to
using a parent selection process first, and reproduction oper-                                 generate new individuals. Particle swarm optimisation (PSO)
ations (crossower and mutation) on the selected parents later,                                 is an efficient population-based search method inspired by the
provides the GAs with great skill to find an approximate opti-                                 behaviour of flocks of birds or schools of fish [13]–[16]. Each
mal solution to problems of high computational complexity.                                     population consists of particles that move over the search
In these algorithms, to ensure the improvement of solutions                                    space. In each iteration of the method, each of the particles
quality, the selection operator is decisive and must be care-                                  in the population moves through the search space at a certain
fully chosen [8], [9]. Differential evolution (DE) is a simple                                 speed according to its own experience (the best individual
yet powered stochastic real-parameter global optimization                                      solution of the particle in the search history) and with the
algorithm [10]–[12]. It is not inspired by natural evolution                                   experience provided by the best global solution found so
                                                                                               far. In order to speed up the PSO convergence, a simplified
    The associate editor coordinating the review of this manuscript and                        PSO, that uses the global best only, called an accelerated
approving it for publication was Bilal Alatas           .                                      PSO (APSO), was proposed in [17]. Also, to increase the

                     This work is licensed under a Creative Commons Attribution 4.0 License. For more information, see http://creativecommons.org/licenses/by/4.0/
3482                                                                                                                                                                 VOLUME 8, 2020
M. Méndez et al.: Proposal and Comparative Study of Evolutionary Algorithms for Optimum Design convergence even further, a simpler version of APSO with Another approach that is based on the synergy between the same order of convergence was proposed in [18]. different algorithms are frameworks methods [38]. Unlike In engineering, many real optimization problems require hybrid methods, frameworks maintain the complete structure meeting, simultaneously, multiple objectives in con- of the intervening algorithms. This allows the frameworks flict. In this multi-objective context, the multi-objective to alternate, in the same optimization process (i.e. a single evolutionary algorithms (MOEAs) [19], [20] have demon- run), different optimization strategies achieving very good strated excellent skills to generate, not a single solution, but results. These methods have shown their potential in various yes an approximate set of non-dominated solutions called optimization problems. For example, in [39] the evolutionary Pareto optimal front (POF). The non-dominated sorting scatter search and PSO are associated to solve a routing genetic algorithm-II (NSGA-II) [21], the multi-objective evo- problem with time windows. While for the same routing lutionary algorithm based on decomposition (MOEA/D) [22] problem but in a multi-objective version, a framework based and the global weighting achievement scalarizing function on MOEA/D and heuristics is proposed [40]. In [41] a genetic algorithm (GWASF-GA) [23] are well-known and framework based on GA and PSO is developed to solve data state-of-the-art MOEAs. NSGA-II is based mainly on two mining problems. Also in the area of detection of cancer mechanisms: Pareto dominance as a criterion to converge to genes framework based methods have been used, as in the the Pareto front and crowding-distance operator as augment- case of [42]. In this case the authors propose a framework ing diversification in the population. MOEA/D uses a strategy based on harmony search and GA. As well there have been of breaking down the multi-objective problem (MOP) into a problems in the chemical industry addressed by frameworks number of scalar subproblems that are solved simultaneously methods, like in [43], where the framework uses APSO and through the evolution of a population of solutions. For the SQP algorithms. Note that in this latter case an EA is associ- scalarization of subproblems MOEA/D can use different ated with an exact method. approaches, such as the Tchebycheff approach which works This work solves the optimal design of a double reduction well for combinatorial problems. GWASF-GA, similar to gear train, which consists of sprockets that engage each other NSGA-II, classifies solutions on Pareto fronts but based to transmit power. Double reduction gears are generally used on the achievement scalarizing function of Wierzbicki [24]. in applications that require very high speeds. A good number Despite the advances made by these and other state-of- of MH have been proposed for the resolution of this type of the-art algorithms, it is still difficult to incorporate diver- systems. The problem considered here (multi-objective case) sity in MOPs, specially, when MOPs have many decision has the special feature of having very low density of solutions variables [25] or many objectives to considers [26], [27]. in some of the areas near to the POF. For tackling this prob- In addition, in [28] the difficulties of convergence of MOEAs lem, a novel metaheuristic framework called DE-NSGA-II when they are applied to problems that present areas with is proposed, which uses a collaborative combination with poor solution densities are pointed out, as will be verified in sequential execution [30] of the DE and NSGA-II algorithms. this paper. This metaheuristic framework allows to diversify the search Hybrid techniques combine heuristics and/or metaheuris- of solutions, especially in areas with low solution density, tics (MH) in order to combine their advantages and obtain and obtain a better approximation of the POF. An original better yields than those obtained by applying each algorithm enumeration study of the problem is also presented, which separately. Several classifications have been proposed for reveals why its resolution is so difficult using both exact hybrid metaheuristics [29], [30], [32]. In fact, a significant and metaheuristic algorithms. Finally, a broad comparison number of hybrid combinations MH + MH have been formu- of performance was made between different EAs (mono- lated. Among the DE + MOEA hybrids, that are an extension objective and multi-objectives), showing the advantages of of DE to solve MOPs, are those based on decomposition DE-NSGA-II for the multi-objective case. strategy such as MOEA/D-DE [33] and MOEA/D-I [34], and This paper has been structured as follows. Section II intro- those that use Pareto-based ranking assignment and crowding duces the problem of optimizing the design of a double reduc- distance such as NSDE [35], DEMO [36] and MODE [37]. tion gear train and presents a small review of the literature MOEA/D-DE uses a DE operator and a polynomial mutation as well as a brief description of some existing algorithms operator to produce new solutions, and also uses two mea- used in the literature to solve this problem. Section III details sures to maintain population diversity. Hybrid-MOEA/D-I the proposed metaheuristic framework. The experiments and optimizes each subproblem by combining GA and DE opera- results achieved are discussed in section IV. Finally, section V tors as a mixed reproduction operator, with the aim of diversi- describes the conclusions and future work. fying the search. In MODE the best individual is added to the population to generate offspring. In DEMO the new solutions II. GEAR TRAIN DESIGN PROBLEM. are immediately inserted in the population allowing them to PRELIMINARY STUDY be candidates to be selected as parents in the next generation. The gear train design problem addressed in this work is NSDE is a simple modification for real representation of a problem well-studied in the literature and was proposed the NSGA-II where crossover and mutation operators are in [44]. The problem consists in the design of a gear train replaced by those adopted in DE. to reduce the entry angular speed of the train, to a lower VOLUME 8, 2020 3483
M. Méndez et al.: Proposal and Comparative Study of Evolutionary Algorithms for Optimum Design

                                                                          behaviour observed in swarms of desert lobsters), the unified
                                                                          particle swarm optimization (UPSO) algorithm [53] (basi-
                                                                          cally, this algorithm articulates the local and global variant
                                                                          of the standard PSO as a unified mechanism), the APSO
                                                                          algorithm [17], the improved accelerated PSO (IAPSO) algo-
                                                                          rithm [54] (in essence, this algorithm is characterized by
                                                                          the replacement of the position of a particle by the best
FIGURE 1. Double reduction gear train.
                                                                          position, giving a memory to the APSO algorithm, and the
                                                                          introduction of two selected functions to ensure a balance of
departure speed. The angular velocity variation, i.e., the                exploration and exploitation, during search process) and the
two-gear transfer ratio, n, is usually described as:                      hybrid PSO-GA algorithm [55] (PSO and GA techniques are
                              ω0     ti                                   combined, in particular, crossover and mutation operators, are
                        n=       =                            (1)
                              ωi     t0                                   included in the standard PSO algorithm).
where ω0 is the angular velocity of the output gear, ωi is                   Using multi-objective optimization concepts, the prob-
the angular velocity of the input gear, and t0 and ti are the             lem (3) can be redefined as a multi-objective optimization
number of teeth of the output and input gears, respectively.              problem as in (4). To this end, a new objective func-
Therefore, the transmission ratio is inversely proportional to            tion, that minimizes the maximum size of any of the four
the number of teeth of the gears. Fig. 1 illustrates the problem          gears, has been added. Initially, this problem was defined
considered for this study, which contemplates 2 pairs of gears            in [56]. The interest now, is not to have a single solu-
(4 gears in total) and aims to bring the transmission ratio as            tion but rather a more balanced set of solutions that could
close as possible to the value 1/6.931. Then, the transmission            interest a potential decision maker, since the new objective
equation (1) can be rewritten for this problem as:                        tends to reduce costs. Only a few authors, and with rel-
                                                                          ative success, have solved this problem. In [56] NSGA-II
                         1        tD tB    x1 x2                          is applied and the Inverted and shrinkable Pareto archived
                  n=          =         =                       (2)
                       6.931      tA tF    x3 x4                          evolutionary strategies (ISPAES) algorithm, which modifies
   On the other hand, Sandgren [44] proposed that none of the             the Pareto archived evolution strategy (PAES) algorithm [57],
gears had less than 12 teeth or more than 60. Thus, the gear              is used in [58].
train design problem seeks to obtain a gear set (x1 , x2 , x3
and x4 ) so that the double reduction gear train is as close                                                1       x1 x2 2
                                                                                            min f1 (x) = [      −          ]
as possible to 1/6.931 and respect the feasibility conditions,                                            6.931 x3 x4
i.e., each design variables xi is an integer in the range [12, 60].                         min f2 (x) = max(x1 , x2 , x3 , x4 )
Formally, this problem can be defined as follows:                                           s.t. 12 ≤ xi ≤ 60 i = 1, 2, 3, 4                    (4)
                                 1    x1 x2 2
                 min f (x) = [      −      ]                                 The problem (4) can be solved by explicit enumeration
                               6.931 x3 x4
                                                                          using 6 bits (which allow to represent 26 = 64 differ-
                 s.t. 12 ≤ xi ≤ 60 i = 1, 2, 3, 4               (3)
                                                                          ent binary solutions) for the binary coding of the values
   The problem (3) was first proposed and solved in [44]                  of each variable xi , i = 1, 2, 3, 4. This implies an explo-
using the branch and bound method (BB) and, later, Kannan                 ration space of 644 = 16, 777, 216 solutions. Considering
and Kramer [45] addressed it using the augmented Lagrange                 that the values of each variable are restricted to the range
multiplier (AL) method. Since then, a good number of meta-                [12, 60] and reducing the numerous solutions of the deci-
heuristic algorithms have been used to solve this problem,                sion space that produce identical solutions in the objective
for example, the combined genetic adaptive search (Gene                   space (overlapping solutions [59]), a total of 662,165 feasible
AS) [46], [47] (the principal difference between Gene AS                  non-overlapping solutions are obtained. Fig. 2 shows the
and GA is the mode the variables are coded and the mode                   feasible non-overlapping solutions of the problem. A poor
crossover and mutation operators are applied), the mine blast             density of solutions can be seen in the area near the Pareto
algorithm (MBA) [48] (whose idea emerges from the analysis                front with low values of f1 (x). This low density may cause
of the landmine explosion), the biogeography-based opti-                  important difficulties to find good solutions in this area for
mization algorithm [49] (inspired by the way in which biolog-             MOEAs, solutions that may be of potential interest to a
ical species are distributed in time and space), the electromag-          decision maker. The 28 solutions that constitute the true POF
netism optimization algorithm [50] (where a hybridization of              are also shown in Fig. 2. Their numerical values and their
the electromagnetism-like mechanism with a descent search                 respective desings (i.e., the value of the decision variables)
is performed) and intelligent swarm-inspired algorithms such              are shown in Table 1. The maximum values found for f1 and
as the cuckoo search (CS) algorithm [51] (which combines                  f2 were, respectively, f1 = 617.807 and f2 = 60. These
the parasitic behaviour of breeding some species of cuckoo                values are used for the estimation of the reference point of
with Lévy’s flight strategy of some birds and fruit flies),               the hypervolume metric [60] used in Section IV to make
the locust search II algorithm [52] (inspired by the gregarious           comparisons.

3484                                                                                                                                  VOLUME 8, 2020
M. Méndez et al.: Proposal and Comparative Study of Evolutionary Algorithms for Optimum Design
population of M s-dimensional real-valued parameter vec-
tors. Each vector forms a candidate solution to the opti-
mization problem. Once the initial population is generated,
the mutation, crossover and selection operators follow each
other iteratively until a stop criterion is met.
Mutation (DE/rand/1). For each i-th target vector from the
current population, Pg , three other distinct parameter vectors,
g g g
say xr1 i , xr2 i and xr3 i are sampled randomly. The indices r1i ,
r2i and r3i are mutually different integers randomly chosen
from the range [1, M ], which are also different from the index
i. Then Eq. (5) is applied:
g g g g
mi = xr1 i + F(xr2 i − xr3 i ), for i = 1, 2, . . . , M (5)
where F ∈ (0, 2] is a real constant factor determined by
the user, which controls the amplification of the differential
FIGURE 2. Pareto optimal front and feasible set of solutions for the g g
double reduction gear train design problem obtained by explicit variation (xr2 i − xr3 i ). The higher the value of F, the more
enumeration. the search space is explored, while the smaller the value of
F, the more the search space is exploited. Finally, if any
TABLE 1. Numerical values of the Pareto optimal front solutions and component of the mutant vector is outside its definition range,
their respective design variables, for the double reduction gear train
design problem, obtained by explicit enumeration. we match it to the nearest bound.
g
Crossover. In this step, the trial vectors ti are generated
by randomly mixing the components of the mutant vectors
g g
mi with those of the target individuals xi , as follows, for
i = 1, 2, . . . , N and j = 1, 2, . . . , s:
g
g mi,j if rand i,j [0, 1] < Cr
ti,j = { g (6)
xi,j if rand i,j [0, 1] ≥ Cr
where Cr ∈ (0, 1) is the crossover constant also determined
by the user and rand i,j [0, 1] is a uniformly distributed random
number lying between 0 and 1. A value of Cr close to the
unit gives rise to trial vectors constructed mainly from the
components of the mutant vectors, while a value close to
zero will generate trial vectors constructed mainly from the
components of the target individuals.
Selection. To keep the population size constant in all gen-
erations, selection is applied to determine, between the trial
vectors and the target ones, which vector goes to the next gen-
eration. Let be f (x) the objective function to be minimized,
the selection operation is described as
g g g
g+1 ti if f (ti ) ≤ f (xi )
xi ={ g g g , for i = 1, 2, . . . , M (7)
xi if f (ti ) > f (xi )
B. NON-DOMINATED SORTING GENETIC ALGORITHM II
Of recognized efficiency, the general operation of NSGA-II
[21] follows the following scheme: (i) random creation of
III. PROPOSED METAHEURISTIC FRAMEWORK a first population of parents P0 of size N , (ii) selection
For addressing the problem described in the previous section, by tournament (best rank and crowding) and application of
a novel metaheuristic framework using a DE algorithm with crossover and mutation operators to create a population of
the NSGA-II is proposed. First, the DE and NSGA-II algo- descendants Qg of size N , (iii) form a combined population
rithms are presented and then the proposed metaheuristic Rg = Pg ∪ Qg , (iv) classify Rg on non-dominated fronts,
framework. (v) then add each front, in increasing order until a front Fk
cannot be fully integrated into the new population Pg+1 of
A. DIFFERENTIAL EVOLUTION ALGORITHM size N , then classifying the Fk front by crowding-distance to
DE searches for a global optimum in a s-dimensional real add solutions until the size Pg+1 equals N , (vi) if the stop
parameter space D ⊆ Rs . It begins with a randomly initiated condition is not met return to step (ii).
VOLUME 8, 2020 3485M. Méndez et al.: Proposal and Comparative Study of Evolutionary Algorithms for Optimum Design
C. DE-NSGA-II FRAMEWORK
The proposed framework improves the ability to search for
the POF of a MOEA when highly complex problems are
solved and, in particular, the one presented in section II. The
basic idea is to take advantage of the skills of a MOEA and
enrich them with the global mono-objective search skills of
DE, in order to find those extreme POF solutions that are
difficult to achieve. In this work, NSGA-II and DE are used,
however another metaheuristic could be used, although the
performance could be different. The general flow chart of
the proposed algorithm (see Fig. 3) consists of the following
steps:
Step 0. Define the initial parameters of both NSGA-II
(N , PCr, PMut, G) and DE (M , F, Cr, GDE ) Step 1. Ran-
domly generate an initial population P0 (NSGA-II popula-
tion) of size N .
Step 2. Assign Pg = P0 .
Step 3. Classify by dominance Pg in Pareto fronts, {Fi }.
Step 4. Generate the initial population of DE, U 0 , from the
M (≤ N ) best solutions of Pg (best rank and crowding)
Step 5. Run DE up to stop criterion is met.
Step 6. Include in Pg the elitist solutions from DE.
Step 7. Obtain Pg+1 .
Step 8. Assign Pg = Pg+1 .
Step 9. If NSGA-II stop criterio is not met, go to Step 3.
Fig. 3 shows how DE and NSGA-II exchange the best
solutions from the mono-objective point of view. Although
in the problem considered in this work it is enough to make
this exchange with only one of the objectives, it can be easily
extended to more or even all the objectives of the problem
considered. Thus, if k is the number of objectives to optimize
and r is the number of objectives represented by the hard-
to-find POF extremes, the complexity of DE-NSGA-II is
O(kN 2 + rMGDE ). Consequently, the greater the number
of objectives, the greater the complexity of the algorithm.
One way to overcome this limitation is to use parallel
programming.
IV. COMPARATIVE RESULTS
In the following subsections, a comparative analysis is per-
formed between some of the most representative algorithms
of both the mono-objective EA family and the MOEA family,
and the DE-NSGA-II framework proposed in this work. All
FIGURE 3. Flow chart of DE-NSGA-II.
experiments are carried out with the problem of designing
a double reduction gear train defined in section II. Each
algorithm has been independently run 100 times for each uses only two parameters (α and β) and the mechanism is
test instance in the same initial conditions, from a randomly simple to understand. In this work a variant of APSO pro-
generated population. The settings and metrics used to eval- posed in [18] has been implemented, which reduces random-
uate the algorithms are presented in subsection IV-A. The ness as iterations progress. In particular, α = δ t is considered
mono-objective problem defined by eq. (3) is solved in sub- where δ ∈ (0, 1) and t represents the current iteration of the
section IV-B and the multi-objective problem raised in eq. (4) algorithm. DE also uses two parameters (F and Cr). In all
is solved in both subsections IV-C and IV-D. the experiments, we will use the same settings of APSO and
DE parameters, that is, we have used the learning parameters
A. SETTINGS AND METRICS β = 0.6 and δ = 1.0, the mutation factor F = 0.3 and
The APSO, DE and NSDE algorithms were implemented the crossover factor Cr = 0.9. Prior to the selection of
with real coding. Comparing with many PSO variants, APSO these parameters, 100 runs of the APSO and DE algorithms
3486 VOLUME 8, 2020M. Méndez et al.: Proposal and Comparative Study of Evolutionary Algorithms for Optimum Design TABLE 2. APSO (N = 50 and G = 100): the best fitness values over 100 independent runs for different values of β and δ. The global optimum is highlighted in bold. TABLE 3. APSO (N = 50 and G = 100): mean values over 100 independent runs for different values of β and δ. Mean values less than 1.e-04 are highlighted in bold. TABLE 4. APSO (N = 50 and G = 100): standard deviation values over 100 independent runs for different values of β and δ. Standard deviation values less than 1.e-04 are highlighted in bold. with a population size N = 50 and a maximum number selection operator, uniform crossover rate of 0.8 and bitwise of generations G = 100 were performed to compare the mutation rate of 1/L were used, where L = 24 is the string different effects of β, δ, F, and Cr in order to find the best length (each variable uses 6 bits). These parameters values results. The experimental results are recorded in Tables 2–7. were used with good performance in [21]. In addition, for the From Tables 2–4, it can be clearly seen that the best values GA the size of the elitist population was 3 and a probabilistic of mean and standard deviation correspond to δ = 1.0. binary tournament selection (the best solution is chosen with However, the results seem insensitive to parameter β but as, probability [0, 0.7]) was adopted [9]. The parameters used for in general, APSO performs slightly differently with different the DE-NSGA-II are a combination of those specified above β, we set β = 0.6. From Tables 5–7, it can be clearly seen that for both the DE and the NSGA-II. the best values of mean and standard deviation correspond to The population sizes, N and/or M , and the maximum Cr = 0.9 and F = 0.3 or F = 0.4. We set F = 0.3. number of generations, G and/or GDE , used in each of the The GA, NSGA-II, GWASF-GA and MOEA/D algorithms algorithms are indicated in the corresponding subsection for were implemented with binary coding, and binary tournament each experiment. As recommended by the authors, the value VOLUME 8, 2020 3487
M. Méndez et al.: Proposal and Comparative Study of Evolutionary Algorithms for Optimum Design

TABLE 5. DE (N = 50 and G = 100): the best fitness values over 100 independent runs for different values of F and Cr . The global optimum is highlighted
in bold.

TABLE 6. DE (N = 50 and G = 100): mean values over 100 independent runs for different values of F and Cr . Mean values less than 1.e-10 are highlighted
in bold.

TABLE 7. DE (N = 50 and G = 100): standard deviation values over 100 independent runs for different values of β and δ. Standard deviation values less
than 2.5e-10 are highlighted in bold.

of the T parameter in GWASF-GA [23] was taken equal to                         are generated, which demand repairing methods. This paper
N and in MOEA/D [22] T = 10%N . In order to obtain                             compares two simple methods to repair the unfeasibility of
a comparison in equal conditions between the DE-NSGA-II                        the designs, namely repair I and repair II, in order to pre-
framework proposed in this work and NSGA-II, it was con-                       serve the viability of the solutions. In repair I method (see
sidered as stopping criterion to reach a maximum number                        Algorithm 1), half of the unfeasible values of the x variables
of objective function evaluations. In all other comparisons                    are setted to the lower bound value, i.e. 12, and the rest of
the stopping criterion was to reach a maximum number of                        unfeasible values are setted to the upper bound value, i.e. 60.
generations, G and/or GDE .                                                    On the other hand, in repair II method (see Algorithm 2), all
   As explained in section II, the gear train design problems                  unfeasible values of the variables x are reassigned with the
defined by eq. (3) and eq. (4) have four integer variables                     upper bound, which is located in the most conflictive region
xi ∈ [12, 60], i = 1, 2, 3, 4. A 6-bit binary encoding                         of the feasible space.
allow us to define 26 = 64 different integer values for                           Mono-objective algorithms were compared in terms of
each variable, but since these values must be within a certain                 statistical results and number of function evaluations (NFEs).
range, unfortunately, unviable designs or unfeasible solutions                 In this paper, the computational cost, which is considered as

3488                                                                                                                                       VOLUME 8, 2020
M. Méndez et al.: Proposal and Comparative Study of Evolutionary Algorithms for Optimum Design

Algorithm 1 Function Repair I: Evaluate Feasibility of
xi i = 1, 2, 3, 4
   Input: Lower bound of x, a = 12, upper bound of x, b =
   60
   Output: Value of x
   1: for i = 1, . . . , 4
   2: if xi ≥ 8 & xi ≤ 56
   3:     xi = xi + 4
   4: elseif xi ≤ 7
   5:     xi = a
   6: elseif xi ≥ 57
   7:     xi = b
   8: end if
   9: end for
                                                                               FIGURE 4. DE vs GA vs APSO (N = 100 and G = 100): box plots of the
                                                                               fitness values.

Algorithm 2 Function Repair II: Evaluate Feasibility of
xi i = 1, 2, 3, 4
   Input: Lower bound of x, a = 12, upper bound of
   x, b = 60
   Output: Value of x
   1: for i = 1, . . . , 4
   2: if xi ≤ 48
   3:     xi = xi + a
   4: else
   5:     xi = b
   8: end if
   9: end for

the best NFEs corresponding to the obtained best solution,                     FIGURE 5. DE vs GA vs APSO (N = 100 and G = 100): evolution of the
                                                                               average fitness (left), evolution of the best fitness (right).
is calculated by the product of the population size (swarm
particle number in APSO) and the maximum number of
iterations or generations (i.e. NFEs = N × G).                                  B. DE VS GA VS APSO
   The hypervolume (HV) indicator suggested in [60] is used                    In this subsection, the DE, GA and APSO algorithms are
as a comparison measure between multi-objective algorithms.                    compared for the mono-objective problem (3). Mean, stan-
The reference point considered for the calculation of HV                       dard deviation (in subscript), and the best and worst fitness
was (620, 65), which guarantees that it is dominated by all                    values achieved by each algorithm (over 100 independent
the solutions generated during the evolution of the algo-                      runs) are shown in Table 8. It can be seen that in all the
rithms. In addition, the attainment surface concept intro-                     experiments performed DE obtains better results than GA,
duced in [61] is used considering the approach suggested by                    and GA obtains better results than APSO.
Knowles [62].                                                                     Figs. 4 and 5 extend the comparative results of the experi-
   Moreover, a Wilcoxon rank-sum test [63] has been per-                       ment with N = 100 and G = 100 from Table 8. Fig. 4 shows
formed to make pairwise comparisons between the algo-                          the box plots of the distribution of fitness values and it is
rithms to study the significance of the results obtained.                      observed that DE solutions are concentrated very close to the
A significance level of 5% has been taken and the null                         global optimum, since its median is 2.3078e-11, GA solutions
hypothesis was ‘‘the two algorithms have the same average                      are farther away from the global optimum with a median
indicator’’, that is, the Wilcoxon test was used to determine                  equal to 1.3616e-09 and APSO solutions are even further
if the difference between both means was statistically sig-                    away from the global optimum with a greater dispersion and
nificant. If the p-value is less than 0.05, the null hypothe-                  a median equal to 1.1173e-08. The advantage of the DE algo-
sis is rejected and, then, we can conclude that the means                      rithm over GA and APSO is also shown in Fig. 5 (left), that
of the two algorithms are comparable. In this case, a new                      presents the evolution of the average fitness of the population
Wilcoxon rank-sum test with one-sided alternative ‘‘greater’’                  per generation for the three algorithms, and in Fig. 5 (right),
(or ‘‘less’’) and the same significance level is performed, that               which shows that DE finds the best fitness value in the first
allows us to conclude which algorithm obtains better results                   generations while GA needs at least 60. In this case, APSO
than the other.                                                                performs better than GA in the first generations.

VOLUME 8, 2020                                                                                                                                  3489
M. Méndez et al.: Proposal and Comparative Study of Evolutionary Algorithms for Optimum Design
TABLE 8. DE vs GA vs APSO: mean, standard deviation (in subscript), and the best and worst fitness values, respectively, over
100 independent runs.
A Wilcoxon rank-sum test has been performed to deter- TABLE 9. DE vs GA vs APSO: Wilcoxon rank-sum test to compare
average fitness.
mine whether the difference between the average fitness
values achieved by the DE, GA and APSO algorithms is
statistically significant. The results are shown in Table 9,
where a symbol 4 indicates that the algorithm in the row has
reached a better average fitness value than the algorithm in
the column. From Table 9, it can be concluded that DE obtains
better average fitness in all cases and AG improves to APSO
in solving the problem discussed in this paper.
In addition, another statistical comparison was developed,
in which the number of times the global optimum is found
in 100 runs is analyzed. This experiment was repeated
100 times, where each experiment consisted of performing
100 runs of DE or GA or APSO. In Fig. 6 the average number
of times the global optimum appears in 100 trials of each
experiment with DE and GA is shown. For example, for The problem (3) has also been used as a reference in
values N = 100 and G = 100, the average number of times other research papers. Table 10 (extended from [54] and [55])
the global optimum appears with DE is 48.24 and with GA shows the results obtained in this work with GA (NFEs =
is only 0.96. All values shown in Fig. 6 confirm that better 800) and DE (NFEs = 800) together with those achieved
results are obtained with DE. In all cases, APSO found the by other metaheuristic methods. It can be seen that DE
global optimum with an average number of times lower than (NFEs = 800) has the best average fitness value followed
the one obtained with GA. by MBA (NFEs = 1120) and IAPSO (NFEs = 800).
3490 VOLUME 8, 2020M. Méndez et al.: Proposal and Comparative Study of Evolutionary Algorithms for Optimum Design
FIGURE 7. NSGA-II vs MOEA/D vs GWASF-GA vs NSDE (N = 100 and
G = 100, repair II): box plots based on the hypervolume metric.
FIGURE 8. NSGA-II vs MOEA/D vs GWASF-GA vs NSDE (N = 100 and
G = 100, repair II): evolution of the average hypervolume (left), evolution
of the average percentage of different solutions in the
population (right).
FIGURE 6. DE vs GA: average number of times the best appears
in 100 trials.
Figs. 7 and 8 show a more detailed comparison between the
four algorithms for the repair II experiment with G = 100 and
Although PSO + GA outperforms the previous ones, its N = 100 from Table 11. Fig. 7 shows the box plots based
reference paper does not clearly indicate the NFEs value, on the hypervolume approximation metric. It is observed
which can be up to a maximum of 20 × 4 × 5000 = 40000. that the best median and the lowest dispersion is obtained
In which case, it should be noted that DE with NFEs = 900 with NSGA-II. The advantage of NSGA-II over the other
(N = 30, G = 30) (see Table 8) already improves the average algorithms is also shown in Fig. 8 (left) that presents the
fitness of the PSO-GA. In any case, in Table 8 we can see that average hypervolume evolution per generation. NSGA-II is
DE with NFEs = 10000 (N = 100, G = 100) reaches the best followed, from best to worst result, by NSDE, GWASF-GA
average fitness value (3.154605e-11). and MOEA/D. Fig. 8 (right) shows the evolution of the
average percentage of different solutions in the population
C. NSGA-II VS MOEA-D VS GWASF-GA VS NSDE (of size N ) and would explain why the different returns of
Four popular MOEAs are compared in this subsection. the algorithms, i.e. the presence of overlapping solutions. For
Table 11 shows the mean, standard deviation (in sub- example, from Fig. 8 (right) it is extracted that at the end
script), and the best and worst hypervolume (HV) indica- of the evolution, NSGA-II and NSDE have similar values of
tors achieved from 100 independent runs. It can be seen the average percentage of different solutions although with
that, in all experiments, the NSGA-II algorithm achieves slightly better hypervolume value for NSGAII (see Table 11),
the best performance. Also, it is noted that all the algo- however in the first generations this value is better for NSDE
rithms implemented with binary representation, case of than for NSGA-II, which justifies that in the first generations
NSGA-II, GAWASF-GA and MOEA/D, achieve better NSDE has better average hypervolume value than NSGA-II
results when use repair II as repairing method for unfeasible (see Fig. 8 (left)). The same analysis can be done with the
solutions. results achieved by GWASF-GA and MOEA/D.
VOLUME 8, 2020 3491M. Méndez et al.: Proposal and Comparative Study of Evolutionary Algorithms for Optimum Design TABLE 10. Comparison and statistical results for gear train model found by different mono-objective methods (NA - not available). TABLE 11. NSGA-II vs MOEA/D vs GWASF-GA vs NSDE (G = 100): TABLE 12. NSGA-II vs MOEA/D vs GWASF-GA vs NSDE: Wilcoxon mean, standard deviation (in subscript), and the best and rank-sum test to compare the hypervolume indicator. worst hypervolume, respectively, over 100 independent runs. Again, a Wilcoxon rank-sum test was performed to deter- mine whether the difference between the average hypervol- ume values reached by each pair of algorithms is statistically significant. The results are shown in Table 12 where a symbol 4 indicates that the algorithm in the row has reached a better average hypervolume than the algorithm in the column, a symbol ∇ indicates that the algorithm in the row has reached a worse average hypervolume than the algorithm in the col- FIGURE 9. NSGA-II vs MOEA/D vs GWASF-GA vs NSDE (N = 100 and umn and again a symbol − indicates that the comparative is G = 100, repair II): 50% attainment surface. not statistically significant. The results obtained by applying repair I indicate that NSDE obtains better average hypervol- In addition, Fig. 9 shows the 50% attainment surface over ume than MOEA/D, GWASF-GA and NSGA-II (between 100 independent runs of NSGA-II, NSDE, GWASF-GA and NSDE and NSGA-II only in one case the difference is not MOEA/D. For a more complete comparison, the true Pareto significant), NSGA-II achieves better average hypervolume front and the feasible solution set are also shown. According than MOEA/D and GWASF-GA and, lastly, GWASF-GA to the results shown in Table 11 and Figs. 7 and 8, in Fig. 9 it achieves better average hypervolume than MOEA/D. Also, is observed that NSGA-II achieves the best 50% attainment from Table 12 (repair II) it is conclude that all tests are surface. However, the 50% attainment surface stagnates for statistically significant, and NSGA-II wins in all cases, NSDE all algorithms in the Pareto front zone with low solution wins MOEA/D and GWASF-GA, and GWASF-GA wins density, highlighting the difficulty of the problem when it is MOEA/D. solved using MOEAs. 3492 VOLUME 8, 2020
M. Méndez et al.: Proposal and Comparative Study of Evolutionary Algorithms for Optimum Design
TABLE 13. DE-NSGA-II (repair II): mean, standard deviation (in subscript), the best and worst hypervolume indicator, over 100 independent runs, with
G = 100 and (M × GDE + N) × G evaluations.
TABLE 14. NSGA-II (repair II): mean, standard deviation (in subscript), the best and worst hypervolume indicator, over 100 independent runs, with
N = 100 and N × G evaluations.
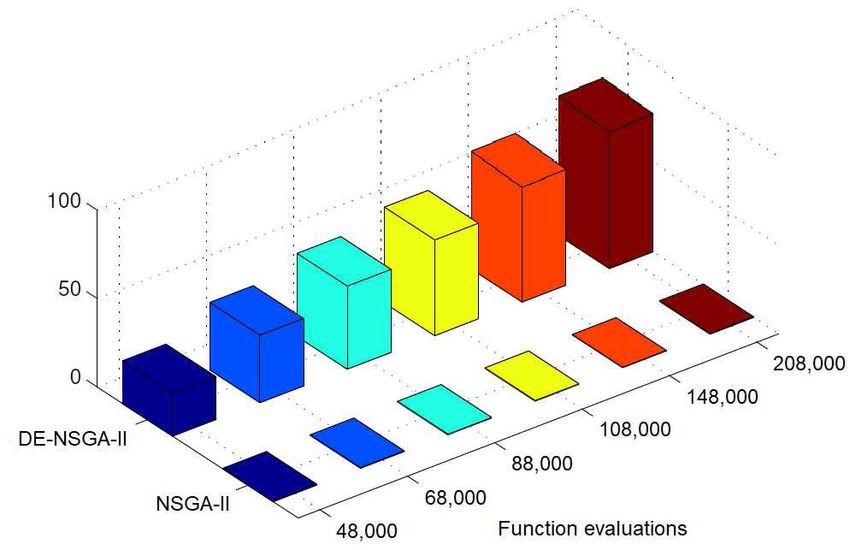
FIGURE 10. DE-NSGA-II vs NSGA-II (208,000 evaluations): box plots
based on the hypervolume metric.
FIGURE 11. DE-NSGA-II vs NSGA-II (208,000 evaluations): average of
hypervolume metric over 100 runs (left), average percentage of different
D. DE-NSGA-II VS NSGA-II (REPAIR II) solutions in the population of size N over 100 runs (right).
In this subsection, the proposed DE-NSGA-II is compared
with the NSGA-II (repair II), since this algorithm proved and N = 80 have been compared with NSGA-II (repair II).
to be the one that obtained the best results in the previous The results obtained with NSGA-II (repair II) are shown
subsection IV-C. In order to have an equitable compari- in Table 14. It is observed that DE-NSGA-II obtains better
son, the stopping criterion for both algorithms was defined results in all cases.
as the maximum number of evaluations of the objective For more detail, the results of the experiment with
functions. 208,000 objective function evaluations (M = 20, N =
Table 13 presents the values of the means, standard devi- 80 and GDE = 100 for DE-NSGA-II (see Table 13) and
ations (in subscript), best and worst hypervolume (HV) indi- N = 100 and G = 2, 080 for NSGA-II (see Table 14)) are
cator reached by DE-NSGA-II for different values of the shown in Figs. 10 and 11. Fig. 10 shows that DE-NSGA-II
number of generations of DE, GDE , and different population achieves better results than NSGA-II (repair II). Fig. 11 (left)
sizes, N for NSGA-II and M for DE. This table shows that shows that although initially NSGA-II obtains better values
the results obtained with M = 20 and N = 80 do not of the average hypervolume, then DE-NSGA-II improves
differ greatly from those achieved in the rest of experiments. those values. This improvement can be explained because
In addition, the number of evaluations of the objective func- DE-NSGA-II achieves, throughout the evolution of the algo-
tions, (M × GDE + N ) × G, is smaller. For this reason, rithm, the best average percentage of different solutions in the
only the results of the experiments performed with M = 20 population of size N (see Fig. 11 (rigth)).
VOLUME 8, 2020 3493M. Méndez et al.: Proposal and Comparative Study of Evolutionary Algorithms for Optimum Design
TABLE 15. DE-NSGA-II vs NSGA-II: Wilcoxon rank-sum test to compare
the hypervolume indicator.
FIGURE 13. DE-NSGA-II vs NSGA-II: Average number of times that the
hard-to-reach extreme solution of the POF appears in 100 trials.
FIGURE 12. DE-NSGA-II vs NSGA-II (208,000 evaluations): 50%
attainment surface.
TABLE 16. DE-NSGA-II vs NSGA-II: Average number of times that the
hard-to-reach extreme solution of the POF appears in 30 trials and
standard deviation (in subscript).
FIGURE 14. POF obtained by DE-NSGA-II, NSGA-II, ISPAES, NSDE,
WASF-GA and MOEA/D algorithms.
the average number of times that this solution was found with
DE-NSGA-II was 76.00 and with NSGA-II only 0.33 times.
Finally, for the problem (4), Fig. 14 shows the POFs
obtained with DE-NSGA-II, NSGA-II, WASF-GA and
MOEA/D in this work, with NSGA-II in [56] (coincide with
Table 15 shows the results obtained with the Wilcoxon those obtained in this work) and with ISPAES in [58], as far
rank-sum test. It can be seen that the proposed algo- as we know all the multi-objective methods that have been
rithm DE-NSGA-II obtains better average hypervolume than applied to this problem (4). It can be seen that DE-NSGA-II
NSGA-II in all cases (4). finds the whole POF A-E, while NSGA-II finds only section
In Fig. 12 the 50% attainment surface obtained by the B-E, NSDE and ISPAES section C-E and WASF-GA and
DE-NSGA-II and NSGA-II algorithms are shown. It is inter- MOEA/D section D-E.
esting to remark that in the area of Pareto’s optimal front
with low density of solutions, the 50% attainment surface V. CONCLUSION AND FUTURE WORK
obtained by DE-NSGA-II wholly dominates the attainment This paper proposes a MH + MH framework (DE +
surface achieved by NSGA-II. NSGA-II) (called DE-NSGA-II) with sequential coopera-
A statistical comparison was made in which each experi- tion. An extensive experimental comparative study between
ment, which consisted of executing each algorithm 100 times, EAs is carried out using mono-objective and multi-objective
was performed 100 times. The results are shown in Fig. 13 approaches, considering as test-bed a double reduction gear
and Table16. Specifically, Fig. 13 shows the average num- system design problem from the literature.
ber of times that the hard-to-reach extreme solution of A preliminary analysis of the problem (solved by enu-
the POF (2.700857148886513e-12, 49) was achieved in meration) reveals that the zone where the optimal solution
the 100 independent runs of each experiment. For exam- for the mono-objective problem is found, which coincides
ple, for 208,000 evaluations of the objective functions, with one extreme zone of the Pareto optimal front for the
3494 VOLUME 8, 2020M. Méndez et al.: Proposal and Comparative Study of Evolutionary Algorithms for Optimum Design
multi-objective problem, is scarcely populated. This explains [6] Q. Zhou, P. Jiang, X. Huang, F. Zhang, and T. Zhou, ‘‘A multi-objective
why exact and metaheuristic algorithms get poor returns robust optimization approach based on Gaussian process model,’’ Struct.
Multidisciplinary Optim., vol. 57, no. 1, pp. 213–233, Jan. 2018.
when they address this problem. [7] C. Dong, Z. Xiong, X. Liu, Y. Ye, Y. Yang, and W. Guo, ‘‘Dual–search arti-
Regarding the mono-objective formulation of the problem, ficial bee colony algorithm for engineering optimization,’’ IEEE Access,
the results obtained when comparing the algorithms DE, vol. 7, pp. 24571–24584, 2019.
[8] T. Blickle and L. Thiele, ‘‘A comparison of selection schemes used in
GA and APSO show that in all the experiments DE obtains evolutionary algorithms,’’ Evol. Comput., vol. 4, no. 4, pp. 361–394,
the best fitness values. Also, for the same number of fitness Dec. 1996.
function evaluations, DE obtains the best yields compared to [9] D. E. Goldberg and K. Deb, ‘‘A comparative analysis of selection schemes
used in genetic algorithms,’’ Found. Genetic Algorithms, vol. 1, pp. 69–93,
other metaheuristic techniques of the literature, followed by Jan. 1991.
the IAPSO algorithm. [10] S. Das and P. N. Suganthan, ‘‘Differential evolution: A survey of the state-
For the multi-objective problem, a rigorous compara- of-the-art,’’ IEEE Trans. Evol. Comput., vol. 15, no. 1, pp. 4–31, Feb. 2011.
[11] R. Storn and K. Price, ‘‘Differential evolution—A simple and efficient
tive analysis was made between state-of-the-art algorithms heuristic for global optimization over continuous spaces,’’ J. Global
(NSGA-II, GWASF-GA, MOEA/D and NSDE) using two Optim., vol. 11, no. 4, pp. 341–359, 1997.
quality indicators: the hypervolume metric measure and the [12] X. Li, H. Zhang, and Z. Lu, ‘‘A differential evolution algorithm based
on multi–population for economic dispatch problems with valve–point
attainment surface concept. In addition, the algorithms pro- effects,’’ IEEE Access, vol. 7, pp. 95585–95609, 2019.
grammed with binary representation were compared using [13] J. Kennedy and R. Eberhart, ‘‘Particle swarm optimization,’’ in Proc. IEEE
two different repair strategies for non-feasible solutions. ICNN, vol. 4, Nov./Dec. 1995, pp. 1942–1948.
[14] X.-S. Yang, Nature-Inspired Metaheuristic Algorithms. Bristol, U.K.:
NSGA-II obtained the best results in all experiments per- Luniver Press, 2008.
formed, followed by NSDE, GWASF-GA and MOEA/D, [15] M. Masood, M. M. Fouad, R. Kamal, I. Glesk, and I. U. Khan,
in that order. ‘‘An improved particle swarm algorithm for multi–objectives based
optimization in MPLS/GMPLS networks,’’ IEEE Access, vol. 7,
Finally, the DE-NSGA-II algorithm proposed in this work pp. 137147–137162, 2019.
was compared with NSGA-II (repair II) using the number of [16] S. Sengupta, S. Basak, and R. A. Peters, II, ‘‘Particle swarm optimization:
evaluations of the objective functions as stop criterion in both A survey of historical and recent developments with hybridization perspec-
tives,’’ Mach. Learn. Knowl. Extraction, vol. 1, no. 1, pp. 157–191, 2019.
algorithms. Clearly, DE-NSGA-II obtained in all performed [17] X.-S. Yang, Engineering Optimization: An Introduction With Metaheuris-
experiments the best average hypervolume value. In addition, tic Applications. Hoboken, NJ, USA: Wiley, 2010.
in the low density zone of the POF solutions, the 50% attain- [18] A. H. Gandomi, G. J. Yun, X.-S. Yang, and S. Talatahari, ‘‘Chaos-enhanced
accelerated particle swarm optimization,’’ Commun. Nonlinear Sci. Numer.
ment surface obtained by DE-NSGA-II wholly dominates Simul., vol. 18, no. 2, pp. 327–340, 2013.
the attainment surface achieved by NSGA-II. Also, in the [19] C. A. Coello, G. B. Lamont, and D. A. Van Veldhuizen, Evolution-
statistical comparison of the number of times that the hard- ary Algorithms for Solving Multi-Objective Problems. Berlin, Germany:
Springer-Verlag, 2006.
to-reach extreme solution of the POF is found, DE-NSGA-II [20] C. Han, L. Wang, Z. Zhang, J. Xie, and Z. Xing, ‘‘A multi–objective
yielded the best average value. In addition, DE-NSGA-II genetic algorithm based on fitting and interpolation,’’ IEEE Access, vol. 6,
finds the whole POF while other multi-objective metaheuris- pp. 22920–22929, 2018.
[21] K. Deb, A. Pratap, S. Agarwal, and T. Meyarivan, ‘‘A fast and elitist
tic techniques only find a section of it, and this section multiobjective genetic algorithm: NSGA–II,’’ IEEE Trans. Evol. Comput.,
corresponds to the area with the highest solution density. vol. 6, no. 2, pp. 182–197, Apr. 2002.
Therefore, our framework proposal constitutes a state-of-the- [22] M. Liu and W.-H. Zeng, ‘‘Memory enhanced dynamic multi–objective
evolutionary algorithm based on decomposition,’’ J. Softw., vol. 24, no. 7,
art method for this problem.
pp. 1571–1588, Jan. 2014.
Extending this research to other real engineering problems [23] R. Saborido, A. B. Ruiz, and M. Luque, ‘‘Global WASF–GA: An evo-
with difficulties similar to those of the problem studied in this lutionary algorithm in multiobjective optimization to approximate the
work, as well as studying other framework designs to com- whole Pareto optimal front,’’ Evol. Comput., vol. 25, no. 2, pp. 309–349,
Jun. 2017.
bine multiple metaheuristics and incorporation of knowledge [24] A. P. Wierzbicki, ‘‘The use of reference objectives in multiobjective opti-
of the problems in the algorithms, are lines of interest to study mization,’’ in Multiple Criteria Decision Making Theory and Applica-
in future works. tions (Lecture Notes in Economics and Mathematical Systems), vol. 177,
G. Fandel and T. Gal, Eds. Berlin, Germany: Springer, 1980, pp. 468–486.
[25] H. Ishibuchi, Y. Nojima, K. Narukawa, and T. Doi, ‘‘Incorporation of
decision maker’s preference into evolutionary multiobjective optimization
REFERENCES
algorithms,’’ in Proc. 8th Annu. Conf. Genetic Evol. Comput. (GECCO),
[1] D. E. Goldberg, Genetic Algorithms in Search, Optimization, and Machine Seattle, WA, USA, 2006, pp. 741–742.
Learning. Boston, MA, USA: Addison-Wesley, 1989. [26] K. Deb and H. Jain, ‘‘An evolutionary many–objective optimization algo-
[2] J. H. Holland, Adaptation in Natural and Artificial Systems. Cambridge, rithm using reference-point-based nondominated sorting approach, part
MA, USA: MIT Press, 1992. I: Solving problems with box constraints,’’ IEEE Trans. Evol. Comput.,
vol. 18, no. 4, pp. 577–601, Aug. 2014.
[3] Z. Wang, J. Li, K. Fan, W. Ma, and H. Lei, ‘‘Prediction method for [27] H. Jain and K. Deb, ‘‘An evolutionary many–objective optimization algo-
low speed characteristics of compressor based on modified similarity rithm using reference–point based nondominated sorting approach, part II:
theory with genetic algorithm,’’ IEEE Access, vol. 6, pp. 36834–36839, Handling constraints and extending to an adaptive approach,’’ IEEE Trans.
2018. Evol. Comput., vol. 18, no. 4, pp. 602–622, Aug. 2014.
[4] P. Rai and A. G. Barman, ‘‘An approach for design optimization of helical [28] K. Deb, ‘‘Multi-objective genetic algorithms: Problem difficulties and
gear pair with balanced specific sliding and modified tooth profile,’’ Struct. construction of test problems,’’ Evol. Comput., vol. 7, no. 3, pp. 205–230,
Multidisciplinary Optim., vol. 60, no. 1, pp. 331–341, Jul. 2019. Sep. 1999.
[5] J. Xiong, B. Chen, Y. Chen, Y. Jiang, and Y. Lu, ‘‘Route network design of [29] L. Jourdan, M. Basseur, and E.-G. Talbi, ‘‘Hybridizing exact methods
community shuttle for metro stations through genetic algorithm optimiza- and metaheuristics: A taxonomy,’’ Eur. J. Oper. Res., vol. 199, no. 3,
tion,’’ IEEE Access, vol. 7, pp. 53812–53822, 2019. pp. 620–629, Dec. 2009.
VOLUME 8, 2020 3495M. Méndez et al.: Proposal and Comparative Study of Evolutionary Algorithms for Optimum Design
[30] J. Puchinger and G. R. Raidl, ‘‘Combining metaheuristics and exact algo- [52] O. Camarena, E. Cuevas, M. Pérez-Cisneros, F. Fausto, A. González, and
rithms in combinatorial optimization: A survey and classification,’’ in A. Valdivia, ‘‘LS–II: An improved locust search algorithm for solving
Artificial Intelligence and Knowledge Engineering Applications: A Bioin- optimization problems,’’ Math. Problems Eng., vol. 2018, Oct. 2018,
spired Approach (Lecture Notes in Computer Science), vol. 3562, J. Mira Art. no. 4148975.
and J. R. Álvarez, Eds. Berlin, Germany: Springer, 2005, pp. 41–53. [53] K. E. Parsopoulos and M. N. Vrahatis, ‘‘Unified particle swarm optimiza-
[31] E.-G. Talbi, ‘‘A taxonomy of hybrid metaheuristics,’’ J. Heuristics, vol. 8, tion for solving constrained engineering optimization problems,’’ in Proc.
no. 5, pp. 541–564, 2002. Int. Conf. Natural Comput., Adv. Natural Comput. (ICNC) (Lecture Notes
[32] E.-G. Talbi, ‘‘Hybrid metaheuristics for multi-objective optimization,’’ in Computer Science), vol. 3612, L. Wang, K. Chen, and Y. S. Ong, Eds.
J. Algorithms Comput. Technol., vol. 9, no. 1, pp. 41–63, 2015. Berlin, Germany: Springer, 2005, pp. 582–591.
[33] H. Li and Q. Zhang, ‘‘Multiobjective optimization problems with compli- [54] N. Ben Guedria, ‘‘Improved accelerated PSO algorithm for mechani-
cated Pareto sets, MOEA/D and NSGA–II,’’ IEEE Trans. Evol. Computat., cal engineering optimization problems,’’ Appl. Soft Comput., vol. 40,
vol. 13, no. 2, pp. 284–302, Apr. 2009. pp. 455–467, Mar. 2016.
[34] Y. Xu, O. Ding, R. Qu, and K. Li, ‘‘Hybrid multi-objective evolution- [55] H. Garg, ‘‘A hybrid PSO–GA algorithm for constrained optimization prob-
ary algorithms based on decomposition for wireless sensor network cov- lems,’’ Appl. Math. Comput., vol. 274, pp. 292–305, Feb. 2016.
erage optimization,’’ Appl. Soft Comput., vol. 68, no. 2, pp. 268–282, [56] K. Deb, A. Pratap, and S. Moitra, ‘‘Mechanical component design for
Jul. 2018. multiple objectives using elitist non-dominated sorting GA,’’ in Parallel
[35] A. W. Iorio and X. Li, ‘‘Solving rotated multi-objective optimization prob- Problem Solving from Nature PPSN VI (Lecture Notes in Computer Sci-
lems using differential evolution,’’ in Advances in Artificial Intelligence ence), vol. 1917, M. Schoenauer, Eds. Berlin, Germany: Springer, 2000,
(Lecture Notes in Computer Science), vol. 3339, G. I. Webb and X. Yu, pp. 859–868.
Eds. Berlin, Germany: Springer, 2004, pp. 861–872. [57] J. D. Knowles and D. W. Corne, ‘‘Approximating the nondominated front
[36] T. Robič and B. Filipič, ‘‘DEMO: Differential evolution for multi- using the Pareto archived evolution strategy,’’ Evol. Comput., vol. 8, no. 2,
objective optimization,’’ in Evolutionary Multi-Criterion Optimization pp. 149–172, Jun. 2000.
(Lecture Notes in Computer Science), vol. 3410, C. A. C. Coello, [58] A. H. Aguirre, S. B. Rionda, and G. Lizarraga, ‘‘ISPAES: Evolutionary
A. H. Aguirre and E. Zitzler, Eds. Berlin, Germany: Springer, 2005, multi-objective optimization with constraint handling,’’ in Proc. 4th Mex.
pp. 520–533. Int. Conf. Comput. Sci. (ENC), Tlaxcala, Mexico, 2003.
[59] Y. Nojima, K. Narukawa, S. Kaige, and H. Ishibuchi, ‘‘Effects of removing
[37] F. Xue, A. C. Sanderson, and R. J. Graves, ‘‘Pareto-based multi-objective
overlapping solutions on the performance of the NSGA-II algorithm,’’ in
differential evolution,’’ in Proc. Congr. Evol. Comput. (CEC), Canberra,
Evolutionary Multi-Criterion Optimization (Lecture Notes in Computer
ACT, Australia, 2003, pp. 862–869.
Science), vol. 3410, C. A. C. Coello, A. H. Aguirre and E. Zitzler, Eds.
[38] J. A. Parejo, A. Ruiz-Cortés, S. Lozano, and P. Fernandez, ‘‘Metaheuristic
Berlin, Germany: Springer, 2005, pp. 341–354.
optimization frameworks: A survey and benchmarking,’’ Soft Comput.,
[60] E. Zitzler and L. Thiele, ‘‘Multiobjective optimization using evolutionary
vol. 16, no. 3, pp. 527–561, Mar. 2012.
algorithms—A comparative case study,’’ in Parallel Problem Solving From
[39] J. Zhang, F. Yang, and X. Weng, ‘‘An evolutionary scatter search particle
Nature (Lecture Notes in Computer Science), vol. 1498, A. E. Eiben,
swarm optimization algorithm for the vehicle routing problem with time
T. Bäck, M. Schoenauer, and H. P. Schwefel, Eds. Berlin, Germany:
windows,’’ IEEE Access, vol. 6, pp. 63468–63485, 2018.
Springer, 1998, pp. 292–301.
[40] Y. Qi, Z. Hou, H. Li, J. Huang, and X. Li, ‘‘A decomposition based memetic [61] C. M. Fonseca and P. J. Fleming, ‘‘On the performance assessment and
algorithm for multi-objective vehicle routing problem with time windows,’’ comparison of stochastic multiobjective optimizers,’’ in Parallel Problem
Comput. Oper. Res., vol. 62, pp. 61–77, Oct. 2015. Solving From Nature—PPSN IV (Lecture Notes in Computer Science),
[41] F. Moslehi, A. Haeri, and F. Martínez-Álvarez, ‘‘A novel hybrid GA-PSO vol. 1141, H. M. Voigt, W. Ebeling, I. Rechenberg, and H. P. Schwefel,
framework for mining quantitative association rules,’’ Soft Comput., Eds. Berlin, Germany: Springer, 1996, pp. 584–593.
vol. 2019, pp. 1–22, 2019. [62] J. Knowles, ‘‘A summary-attainment-surface plotting method for visualiz-
[42] K. Das, D. Mishra, and K. Shaw, ‘‘A metaheuristic optimization frame- ing the performance of stochastic multiobjective optimizers,’’ in Proc. 5th
work for informative gene selection,’’ Informat. Med. Unlocked, vol. 4, Int. Conf. Intell. Syst. Design Appl. (ISDA), Warsaw, Poland, 2005.
pp. 10–20, Jan. 2016. [63] F. Wilcoxon, ‘‘Individual comparisons by ranking methods,’’ Biometrics
[43] F. Dong, J. Zhang, L. Xie, H. Zhao, and X. He, ‘‘An improved APSO–SQP Bull., vol. 1, no. 6, pp. 80–83, 1945.
with adaptive transition strategy for dynamic optimization,’’ IFAC Proc.
Volumes, vol. 47, no. 3, pp. 8152–8157, 2014.
[44] E. Sandgren, ‘‘Nonlinear integer and discrete programming in mechan-
ical design optimization,’’ J. Mech. Des., vol. 112, no. 2, pp. 223–229,
Jun. 1990.
[45] B. K. Kannan and S. N. Kramer, ‘‘An augmented Lagrange multiplier
based method for mixed integer discrete continuous optimization and
its applications to mechanical design,’’ J. Mech. Des., vol. 116, no. 2,
pp. 405–411, Jun. 1994.
[46] K. Deb and M. Goyal, ‘‘A combined genetic adaptive search (GeneAS)
for engineering design,’’ Comput. Sci. Inf., vol. 26, no. 4, pp. 30–45,
Aug. 1996.
[47] K. Deb and M. Goyal, ‘‘A flexible optimization procedure for mechanical
component design based on genetic adaptive search,’’ J. Mech. Des., MÁXIMO MÉNDEZ received the M.Sc. degree in
vol. 120, no. 2, pp. 162–164, Jun. 1998. industrial engineering from the School of Indus-
[48] A. Sadollah, A. Bahreininejad, H. Eskandar, and M. Hamdi, ‘‘Mine blast trial Engineering of Las Palmas, Spain, and the
algorithm: A new population based algorithm for solving constrained
Ph.D. degree in computer science from the Univer-
engineering optimization problems,’’ Appl. Soft Comput., vol. 13, no. 5,
sidad de Las Palmas de Gran Canaria (ULPGC),
pp. 2592–2612, May 2013.
Spain. He is currently an Associate Professor
[49] S. Mirjalili, ‘‘Biogeography-based optimisation,’’ in Evolutionary Algo-
rithms and Neural Networks, vol. 780. Cham, Switzerland: Springer, 2019, with the Department of Informatics and Systems,
pp. 57–72. ULPGC, where he is also a member and Research
[50] A. M. A. C. Rocha and E. M. G. P. Fernandes, ‘‘Hybrid optimization Fellow of the Instituto de Sistemas Inteligentes y
coupling electromagnetism and descent search for engineering problems,’’ Aplicaciones Numéricas en Ingeniería (SIANI).
in Proc. Int. Comput. Math. Methods Sci. Eng. (CMMSE), Murcia, Spain, His research interests include genetic algorithms, metaheuristics for
2008, pp. 533–545. multiobjective optimization, decision analysis, machine learning and real
[51] A. H. Gandomi, X.-S. Yang, and A. H. Alavi, ‘‘Cuckoo search algorithm: applications in mechanical engineering, renewable energies, transportation
A metaheuristic approach to solve structural optimization problems,’’ Eng. planning, and weather prediction. He has published more than 30 technical
Comput., vol. 29, no. 1, pp. 17–35, Jan. 2013. articles in international journals, conferences, and book chapters.
3496 VOLUME 8, 2020You can also read