Landscape Volumetrics and Visualizations of the Butte Mining District, Montana
←
→
Page content transcription
If your browser does not render page correctly, please read the page content below
Landscape Volumetrics and Visualizations of the Butte
                                   Mining District, Montana
                                                        PATRICK KENNELLY1
                       Department of Earth and Environmental Science, CW Post Campus of Long Island
                                   University, 720 Northern Blvd., Brookville, NY 11548

Key Terms: Underground Mining, Open-Pit Mining,                          usages among disciplines. In mining engineering, for
Volumetrics, Cut-and-Fill, Geographic Information                        example, cut-and-fill can refer to various under-
Systems, Visualization                                                   ground mining techniques, such as cut-and-fill stop-
                                                                         ing and undercut-and-fill mining (Hustrulid, 1982;
                                                                         Hustrulid et al., 1989), while in sedimentology, scour-
                          ABSTRACT                                       and-fill structures associated with erosion and depo-
                                                                         sition on channel bottoms have been referred to as
   The topography of the Butte Mining District,                          cut-and-fill structures (Reineck and Singh, 1986).
Montana, has been extensively altered by placer,                            In this study, volumetric analysis is most closely
underground, and open-pit mining since 1864. The                         aligned with cut-and-fill analyses related to earth-
earliest known large-scale topographic mapping show-                     works (Coduto, 1998), especially in the field of
ing the Butte area was conducted by the U.S.                             transportation engineering (Banks, 2001; Papacostas
Geological Survey (USGS) in 1895 and published in                        and Prevedouros, 2000). Such analyses are generally
1897. In 1903, the map coverage was extended several                     done from a planning perspective, and they are
miles east and west, cultural features were revised                      designed to minimize waste (Ferguson et al., 1995).
where necessary, and the map was published in 1904.                      Some studies assume an existing route and consider
The most detailed elevation mapping was produced with                    factors of additional importance such as soil proper-
photogrammetric techniques in 1989 and 1991 by                           ties (Goktepe and Lav, 2004), simulated activity sets
Horizon, Inc. This study uses these two sets of                          (Askew et al., 2002), and refined geometric designs
topographic data to measure and visualize volumetric                     (Goktepe and Lav, 2003; Easa, 1998; and Hassan et
changes of the landscape. Patterns of change associated                  al., 1998). Other methods select and optimize various
with the relatively small volume of material filling                     metrics with computationally intensive applications
Butte’s Missoula Gulch and earthworks for highway                        such as genetic algorithms (Jha and Schonfeld, 2004),
construction unrelated to mining closely match expect-                   simulated annealing (Henderson et al., 2003), and
ed locations, patterns, and thicknesses. The model also                  linear programming (Moreb, 1996; Son et al., 2007).
estimates the area and allows for visualization of large                 Methods that seek to optimize (i.e., minimize)
areas of altered landscape, such as the Berkeley open-                   construction costs have received an understandably
pit copper mine and the Yankee Doodle tailings dam.                      large amount of attention (Alkass and Harris, 1991;
This model provides a visual overview and first-pass                     Liu and Sessions, 1993; Akay, 2003; Yabuki and
assessment tool for an area with multiple environmental                  Shitani, 2005; and Stückelberger et al., 2006).
concerns, including groundwater and soil contamina-                         Geoscientists, however, most frequently use volu-
tion, leaching of metals from mine tailings and waste                    metric analysis to accurately measure changes in
rock, and associated impacts on surface water from                       volumes of earth material resulting from geologic
runoff.                                                                  processes. Examples include volumetric studies of
                                                                         coastal sediment yield and flux (Brown and Arbogast,
                                                                         1999; Newsham et al., 2002), flood-tide delta ba-
                      INTRODUCTION                                       thymetry (Wheeler, 2005; Wheeler and Peterson,
   Calculating and mapping changes in volumes of                         2006), alluvial deposits (Brasington et al., 2000;
earth materials have long been of interest to engineers                  Fryirs and Brierley, 2001), erosion from extreme
and geoscientists. In some cases, such analyses are                      rainfall events and deposition from landslides (Mar-
referred to as cut-and-fill. Although this terminology                   tinez-Casasnovas et al., 2002; Korup et al., 2004),
is commonplace, it is worthwhile to clarify different                    glacial variations with time (Mennis and Fountain,
                                                                         2001), and lava flows (Stevens et al., 1999).
1
  Corresponding author phone: (516) 299-2652 (Office); fax: (516) 299-      Both geoscientists and engineers use geographic
3945; email: Patrick.Kennelly@liu.edu                                    information systems (GIS) in performing such anal-

                       Environmental & Engineering Geoscience, Vol. XVII, No. 3, August 2011, pp. 213–226                   213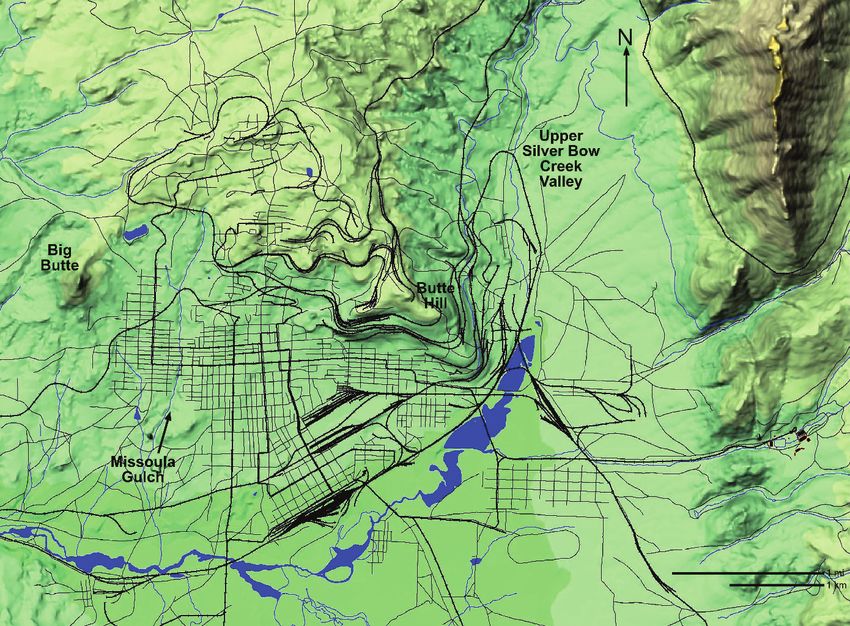
Kennelly

yses. Numerous studies use GIS in computational              as much historical change as possible. Thus, an initial
methods to optimize transportation planning and              DEM of Butte was based on a USGS topographic
earthwork (e.g., Chan and Fan, 2003; Gumus et al.,           map surveyed in 1895 and published in 1897, with
2003; and Jha and Schonfeld, 2004). Mennis and               extensions surveyed in 1903 and published in 1904.
Fountain (2001) explicitly underscore the importance         This map was surveyed using plane table and alidade,
of GIS database development for such temporal                with distances measured with stadia crosshairs and
change studies. Additionally, the ability of GIS to          rods (stadia intercept method), and elevations mea-
provide visualizations of such volumetric changes is         sured by measurements from a Beaman arc reduced
also important (Burton and Shell, 2000; Jha et al.,          to the station level. All of these methods were
2001). Much research focuses on the best use of such         common at the time, but they are naturally crude
visualizations, including using such displays to             compared to modern-day photogrammetric methods,
address complexity/interrelationship/interaction is-         and fraught with potential error. Figure 1 shows the
sues (Buttenfield and Mackaness, 1991; Ervin, 2001;          portion of this map that later became the Berkeley
and Lo and Young, 2002).                                     Pit, including Butte Hill, the topographic high in the
   In this study, volumetric analysis is accomplished        central portion of the map capped by the Mountain
using GIS software to quantify and visualize changes         View mine.
in the landscape of the Butte Mining District,                  This topographic map, a part of the Butte Special
Montana, associated with surface, subsurface, and            Folio of the Geologic Atlas of the U.S. States (U.S.
open-pit copper (and less extensive silver) mining           Geological Survey, 1897), has a contour interval of
since 1895–1903. Previous studies have estimated             20 ft (6 m). It also shows benchmarks, hydrologic
mining volumes associated with mine stockpiles               features, roads, railroads, and buildings. This map was
(Jordan, 2002) and pit excavations (Easa, 1998) by           separate from a geologic map of the area in the same
comparing two modern-day data sets. Other studies            folio, which included geologic units and outcrops of
have looked at properly positioning historical maps in       copper and silver veins. The 1895 (1897) topographic
a GIS environment to quantify change (Balletti, 2000)        map was extended and revised in 1903 and published in
and visualize past landscapes (Fuse et al., 1998;            1904. This extended version of the topographic map
Shimizu et al., 1999; and Shimizu and Fuse, 2003).           was scanned for use in the volumetric model.
This study does both, using mapped data from 1989–              The 1897 and 1904 edition maps were in the
1991 and data from 1895–1903 to obtain detailed              polyconic projection commonly used by the USGS at
volumetric measurements and provide visualizations           that time. It was first necessary to georeference the
of the spatial relationship between landscapes of the        scanned map image to this coordinate system. An
past and present.                                            affine transformation based on 13 control points
   This study reconstructs the relatively undisturbed        including benchmarks and section corners was used
terrain of Butte in the late 1800s to early 1900s by         for optimal placement. Affine transformations are
georeferencing a U.S. Geological Survey (USGS) map           linear operations that allow for scaling, rotation, or
of 1895–1903 and building a terrain model from this          shearing of the original and entire map; no non-linear
source. This landscape is then combined with digital         transformation was used, nor was any additional
elevation models (DEMs) from a 1989–1991 survey to           transformation applied to specific portions of the
document volumetric variations associated with               map. Although the paper source map was more than
mining activities in Butte. A factor of particular           a century old, the georeferenced map achieved a root
interest is the extensive amount of material removed         mean square error (RMS) of 3.14 m (10.3 ft).
from the Berkeley open-pit copper mine (Berkeley                Once georeferenced to the coordinates of the paper
Pit). Much of this material was used in the                  map, the 20 ft (6 m) contours, benchmarks, roads,
construction of the Yankee Doodle tailings dam,              and railroads were digitized into a GIS. These data
although other deposits of mine tailings and waste           layers were then projected from the USGS polyconic
rock are distributed throughout the area.                    to the Montana (North American datum 1983) state
                                                             plane coordinate system. These GIS layers were
                    METHODS                                  overlain with and compared to well-controlled
                                                             federal, state ,and local GIS layers. Butte road layers
  This study focused on changes in the landscape of          based on U.S. Census Bureau (2010) TIGER files
the Butte Mining District, which began with placer           were especially useful for comparisons with historical
mining in 1864. Although much of the most intensive          roads.
changes did not occur until the open-pit copper                 It was necessary to include an offset in the x and y
mining phase, which created the Berkeley Pit between         directions to account for issues with the original map.
1955 and 1982, this study was designed to document           Benchmarks and other control points used in the 1895

214               Environmental & Engineering Geoscience, Vol. XVII, No. 3, August 2011, pp. 213–226
Landscape Volumetrics, Butte Mining District

Figure 1. A portion of the topographic map included in the Butte Special Folio of the Geologic Atlas of the United States, published by the
USGS in 1897 at a scale of 1:15,000. The portion of the map is centered on Butte Hill and the Upper Silver Bow Creek Valley. The 20 ft (6 m)
elevation contours are shown in brown.

and 1903 surveys were assigned coordinates before                        centerlines on the 1904 edition to those roads still
the first North American datum of 1927 and were                          present in Butte and documented in the U.S. Census
based on historical surveying techniques in a local                      Bureau TIGER files.
area. By plotting a number of these control points in                       One efficient method to calculate volumetric chang-
their 1983 datum position, it was possible to calculate                  es is to compare elevation grids from two different
average offsets in the x and y directions of 288 m and                   times. A simple example is included in Figure 2, where
223 m, respectively. Offsets showed variability, but                     the original (A) and final (B) elevation data are stored
applying these average corrections to the projected                      as grids covering the same location at different times. A
map resulted in a satisfactory fit, without requiring                    volumetric map (C) can easily be calculated as the
any variable offsets within the map area, a procedure                    difference between the old and new grids. In
called ‘‘rubber sheeting.’’ Such a process is necessary                  Figure 2C, areas of decreased volume (cut) are
to fit historical data or data that are poorly referenced                represented by hachured patterns, and areas of
spatially (e.g., Shimizu and Fuse, 2003). Indications                    increased volume (fill) are represented by stippled
of quality of fit were examined by matching road                         patterns. Another geographic data model, the trian-

                      Environmental & Engineering Geoscience, Vol. XVII, No. 3, August 2011, pp. 213–226                               215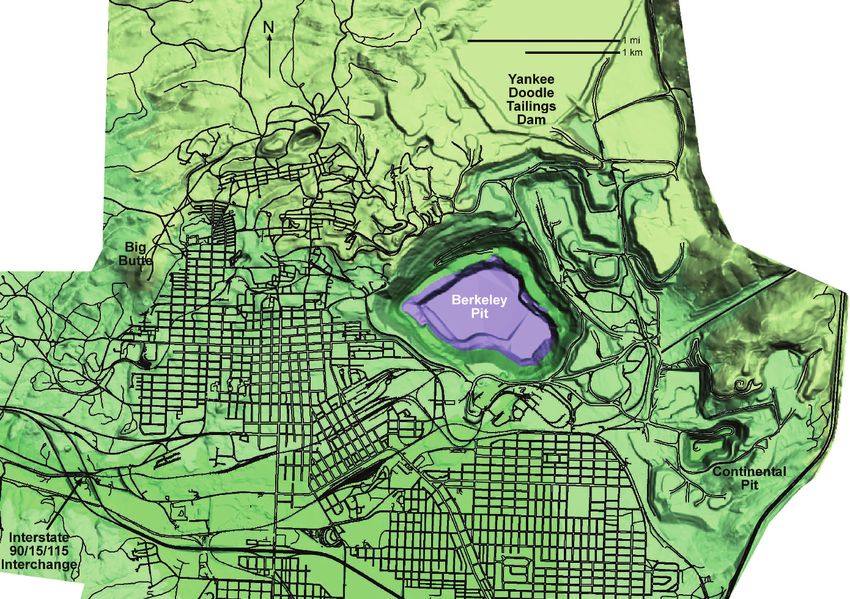
Kennelly

Figure 2. Various GIS data models used to represent terrain. Original topography is represented by a regular grid in (A), with values equal
to elevation. Altered topography is represented by a similar grid in (B), but with new elevation values related to addition or removal of
material. Volume differences are shown in (C), with areas of decreased volume (cut) represented by hachured patterns, and areas of
increased volume (fill) represented by stippled patterns. The triangulated irregular network (TIN) data model is useful for transitioning
between grid and contour formats. The TIN shown in (D) is an alternative representation of the original topography grid (A). Areas lacking
slope or with constant slope can be represented by fewer, larger triangles.

gulated irregular network (Weibel and Heller, 1991;                     modern-day DEM. The TIN uses digitized points
Clarke, 1995; Price, 1999; and DeMers, 2003) or TIN,                    along the contour lines to build a continuous mesh of
is often used to convert grids to contours, or contours                 triangles of various types and sizes. This operation
to grids. Figure 2D is a TIN representation of                          linearly interpolates elevations between points or
Figure 2A. In this example, centers of grid cells are                   vertices of known value, essentially creating triangles
potential vertices of triangles. Flat areas or areas of                 of constant slopes. Each resulting triangle has a
constant slope require fewer, larger triangles.                         known orientation (slope and aspect) in three-
   In a similar manner, the 20 ft (6 m) contours from                   dimensional (3D) space.
the 1904 map were transformed into a TIN and then                          Although TINs are efficient at storing topographic
into a grid for more efficient comparison with a                        data (McCullagh, 1998), they do not offer the optimal

216                   Environmental & Engineering Geoscience, Vol. XVII, No. 3, August 2011, pp. 213–226
Landscape Volumetrics, Butte Mining District
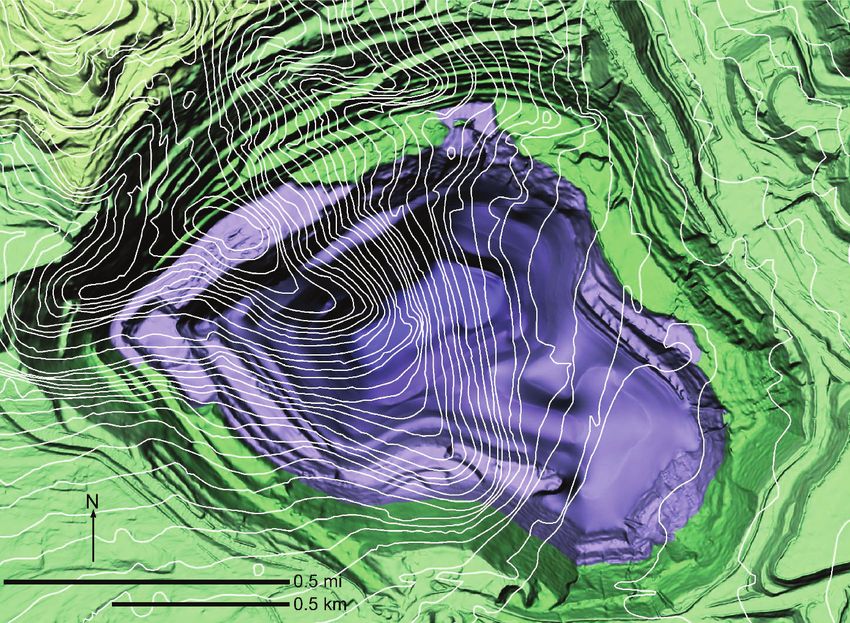
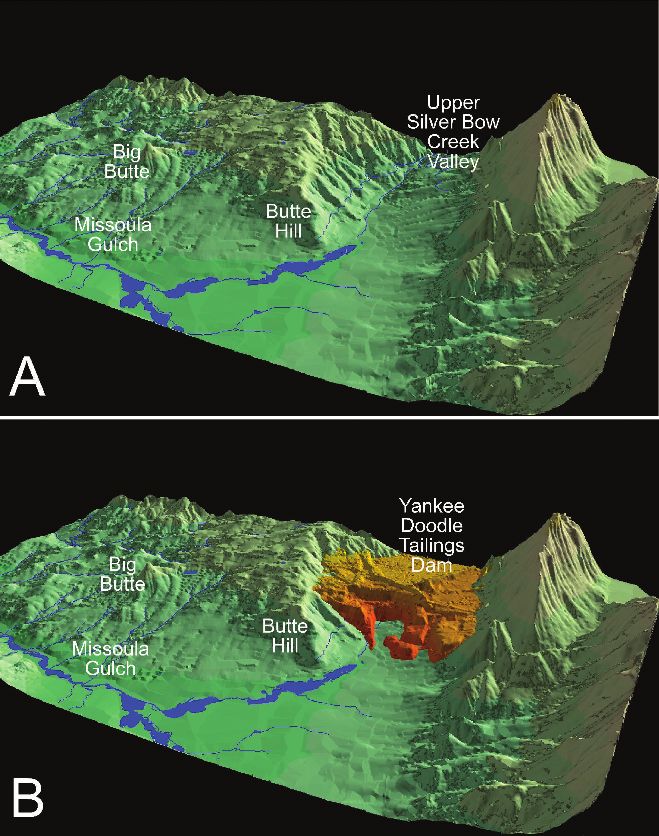
Figure 3. A map displaying the relatively unmodified landscape of the Butte Mining District circa 1897. A gridded digital elevation model
(DEM) was derived from a triangulated irregular network (TIN) built from the historical elevation contour lines shown in Figure 1. The
terrain was layer tinted and hill shaded for improved visualization. Butte Hill is the promontory at the southeast end of the topographic
high. The Upper Silver Bow Creek follows the central blue line to the east of Butte Hill.
data model for comparing surfaces made from resulting data set consisted of 2 ft (0.6 m) contours in
different data sources (Chang, 2009; Longley et al., the Montana state plane coordinate system. These
2011). The TIN was thus converted to a grid format, contours were converted to a TIN and then a grid
consisting of a regular pattern of 10 m by 10 m grid using the same methodology described previously
cells or pixels, each assigned to an interpolated (Figure 4).
elevation value from the TIN. Using this DEM, The only locale within the mapped area for which
overlain with hydrology, roads, and railroads from the Horizon data were not the most detailed available
the 1904 edition map, it was possible to create the was beneath the water surface of the flooded portion
terrain map of the Butte Mining District of 1897/1903 of the Berkeley Pit. Once open-pit copper mining
shown in Figure 3. The DEM shows color varying ended in 1982, active pumping of water to keep the pit
with elevation, a method called layer tinting (Imhof, dry was discontinued (Gammons et al., 2006a). As a
1982; White, 1985; and Kennelly and Kimerling, result, the Horizon surveys of 1989–1991 show
2004), and changes in slope and aspect are shown elevations for the top of the water level at that time
with variable shades of gray, a method called hill in the central pit area (purple area in Figure 4), but
shading (Yoeli, 1965; Horn, 1981; Robinson et al., not the bathymetry beneath. To complete the modern
1995; and Slocum et al., 2008). terrain model, 100 ft (30.5 m) contours from blue line
The most detailed elevation data for the Butte maps compiled in 1977 by the Anaconda Mining
Mining District was collected by Horizon, Inc., in Company (AMC) were used. These contours were
1989 and 1991. With the use of photogrammetry, the combined with the Horizon 1989–1991 data by the
Environmental & Engineering Geoscience, Vol. XVII, No. 3, August 2011, pp. 213–226 217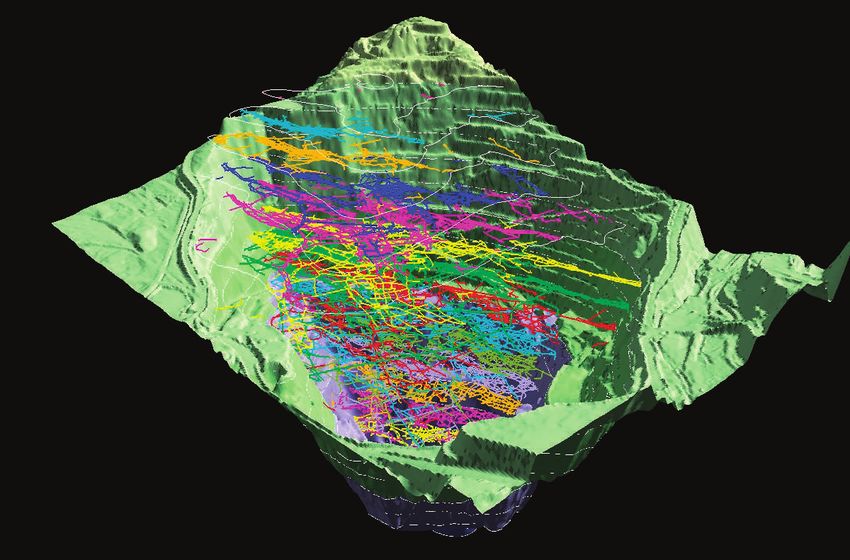
Kennelly

Figure 4. A map displaying the highly modified landscape of the Butte Mining District circa 1991. A gridded DEM was derived from a
detailed survey conducted by Horizon, Inc., between 1989 and 1991. The lake in the Berkeley Pit is colored in purple and represents the
water level near the time of the Horizon survey.

Montana Natural Resource Information System                                                     RESULTS
(NRIS).
   Two separate grids were created from the combined                     Subtraction of the DEM from the Horizon survey
contours. One grid was created using 10 m grid cells so               from the DEM created from the 1904 USGS edition
that each grid cell of the Horizon data would directly                map creates a volumetric model of the Butte Mining
overlie a cell in the grid created from the 1904 edition              District (Figure 6). The geographic extent of the model
map. A second, more detailed grid was generated to                    was determined by the Horizon survey, which fell
show variations that are solely a function of the current             within the extent of the USGS map shown in Figure 3.
terrain mapped by Horizon, Inc. The map shown in                         In creating a volumetric map display, it is
Figure 5 is the result of combining the Horizon and                   important to consider the accuracy of both data sets.
AMC contours using 1 m grid cells.                                    The Horizon data, mapped at a scale of 1:6,400 and a
   For visualizing the modern terrain, however, it is                 2 ft (0.6) contour interval, should easily be the more
desirable to show as much detail as possible. The map                 accurate of the two. The USGS map is at a scale of
shown in Figure 5 was created with the same Horizon                   1:15,000 and has a contour interval of 20 ft (6.1 m).
and AMC contours, but it was mapped with 1 m by                       The accuracy of the elevation data from the USGS
1 m grid cells. This represents the most detailed                     1904 map is uncertain, since it was generated prior to
rendering possible of the current morphology of the                   the U.S. National Map Accuracy Standard of 1941.
Berkeley Pit’s topography and bathymetry. The                         This standard states that 90 percent of all elevation
unlabeled white lines in Figure 5 are 20 ft (6 m)                     data should be within one half the contour interval
contours from the USGS 1897 map, and they include                     used for mapping, and there is no reason to believe it
the highest portion of Butte Hill from Figure 1.                      meets this criterion. The resulting map (Figure 6) uses

218                  Environmental & Engineering Geoscience, Vol. XVII, No. 3, August 2011, pp. 213–226
Landscape Volumetrics, Butte Mining District
Figure 5. A detailed map of the topography and bathymetry of the Berkeley Pit. The hill shading reveals detail from the 2 ft (0.6m)
Horizon, Inc., contours above the pit lake level of 1991. Beneath this level, the smoother, less detailed shading represents surveys contoured
at a 100 ft (30.5 m) interval by the Anaconda Mining Company in 1977, when the Berkeley Pit was being excavated and had not yet begun
to fill with water. Overlying unlabeled white contours are from the 20 ft (6 m) contours from the 1897 USGS topographic map of the area
and are used to show original topography of Butte Hill.
color to show changes in volume for areas with 10 ft Gulch, which is shown in Figure 3, was an historical
or more vertical change; areas with less difference drainage along the western edge of early uptown
display the underlying terrain. Areas of current lower Butte. In the first half of the 1900s, storm sewers were
and higher elevation are assumed to be associated installed along the gulch and overlain with waste rock
with volumes removed and added, respectively. These from underground mining. The Missoula Gulch
changes are classified and shown in darker shades of drainage is delineated on the USGS map, and the
red for the former and blue for the latter in Figure 6. thickness of the fill has been estimated at 40 ft (12 m)
Many features of the Butte landscape are readily by comparing elevation values within and above the
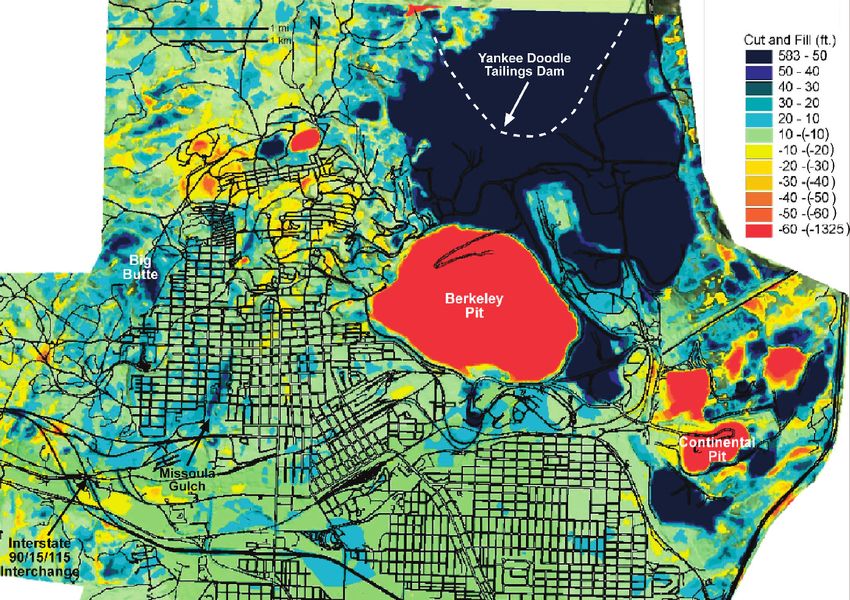
apparent in this map. The dark-blue area to the storm sewers. Figure 7 shows the current volume of
northeast is the Yankee Doodle tailings dam. The material filling Missoula Gulch, as well as the
Berkeley Pit is the large red area just to the southwest location of the creek in 1897. The pattern of the fill
of this dam. The area in the east-central portion of the and its maximum thickness correspond closely to the
map shows volumetric changes associated with the morphology of the gulch and measured thicknesses of
Continental open-pit mine (Continental Pit) as of material above the storm sewers.
1991. Much smaller open-pit mining operations are An example not related to mining in Butte is
evident in the northern portion of the map. earthworks cut-and-fill associated with highway
Two areas allow for simple visual inspection of the construction. Figure 8 shows two maps of the
relative accuracy of the volumetric model. Missoula Interstate 90/15/115 interchange on the southwestern
Environmental & Engineering Geoscience, Vol. XVII, No. 3, August 2011, pp. 213–226 219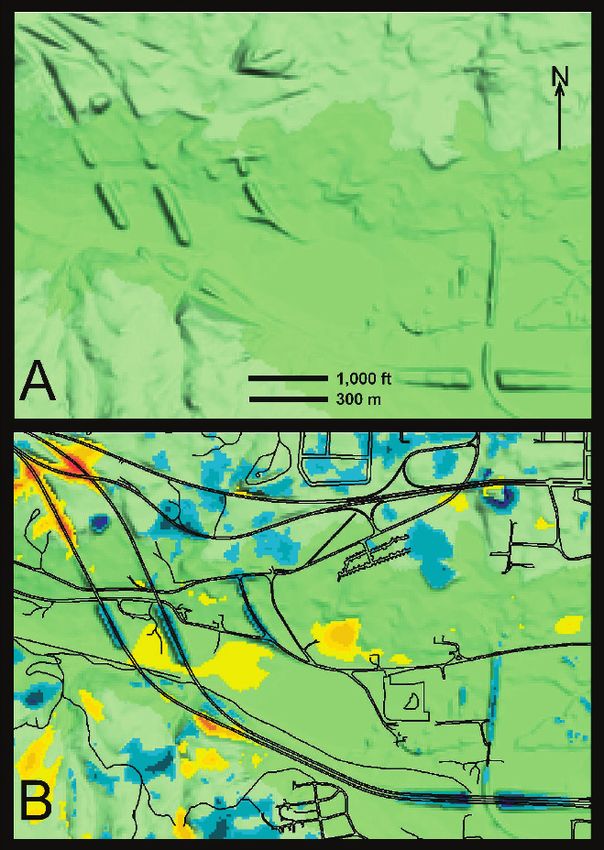
Kennelly

Figure 6. A volumetric model of landscape change in the Butte Mining District. Areas in which more than 10 ft (3 m) of volume have been
added are shown with increasingly darker shades of blue. Areas in which more than 10 ft (3 m) of volume have been removed are shown
with increasingly darker shades of red. Areas experiencing less than 10 ft (3 m) of change generally appear in green.

edge of Butte, without (Figure 8A) and with (Fig-                     Berkeley Pit and after pit operations ceased, are
ure 8B) volumetric changes and modern roads. The                      shown in Figure 9A and B, respectively. Because the
model correctly predicts that there is no (610 ft [3 m])              more detailed grid is used for displaying the base, the
elevation change over most of this area. It also                      top is of noticeably coarser detail.
correctly highlights most areas of cut-and-fill, with                    Using a density of 2.68 g/cm3, 1.251 billion tons of
these areas corresponding closely to those evident                    material are estimated to have been removed by open-
from the hill-shaded map of the area. Volumetric                      pit mining. By comparison, Anaconda Mining
changes result in differences in elevation ranging from               Company haulage estimates indicate 1.324 billion
10 ft (3 m) to 50 ft (15 m) in this area of extensive                 tons were removed. The GIS-based estimate does not
alteration.                                                           include material removed by subsurface mining in the
   The volumetric model appears to be of sufficient                   first half of the 1900s before open-pit copper mining
accuracy to provide estimates of the largest changes in               began. This may constitute 5.3 M m3 of material, or
the Butte landscape, such as the Berkeley Pit. These                  about 1.25 percent of the total volume of material
volumetric estimates indicate that 423.5 M m3 (mil-                   removed in open-pit mining (Duaime et al., 2004).
lion cubic meters) of material were removed from the                  This volume would be associated with the under-
pit. Because the top and bottom of this volume are                    ground workings coincident with the present 3D
represented by the surfaces mapped by USGS 1904                       extent of the Berkeley Pit. These underground mine
edition and Horizon 1989–1991 data, respectively, it                  workings, originally mapped by the Anaconda Mining
is possible to visualize this volume using these DEMs.                Company, were digitized in a GIS format by the
Two 3D perspective views of the Butte Hill, before the                Montana Bureau of Mines and Geology (Duaime et

220                  Environmental & Engineering Geoscience, Vol. XVII, No. 3, August 2011, pp. 213–226
Landscape Volumetrics, Butte Mining District
Figure 7. The pattern of fill shown in blue associated with the
historical Missoula Gulch. The hydrology is from the 1897 USGS
topographic map of the area. The morphology and thickness of
the gulch’s fill closely match the expected pattern and values. See
legend of Figure 6 for values of fill.
al., 2004). A 3D perspective view (Figure 10) shows the
spatial relationship of these underground workings
previously located in the Berkeley Pit.
Most of the mine tailings and waste rock resulting
from mining the Berkeley Pit were deposited in the
Upper Silver Bow Creek Valley, with a portion used to Figure 8. Patterns of earthwork associated with the Interstate 15,
construct the Yankee Doodle tailings dam. The dam is 90, and 115 interchange to the southwest of Butte, showing: (A)
present-day terrain and (B) present-day terrain with predicted cut
named after Yankee Doodle Creek, which flowed into and fill of more than 10 ft highlighted in red and blue, respectively,
the Upper Silver Bow Creek Valley just to the east of and with present-day transportation infrastructure.
Butte Hill (Figures 1 and 3). Above the dam, there is a
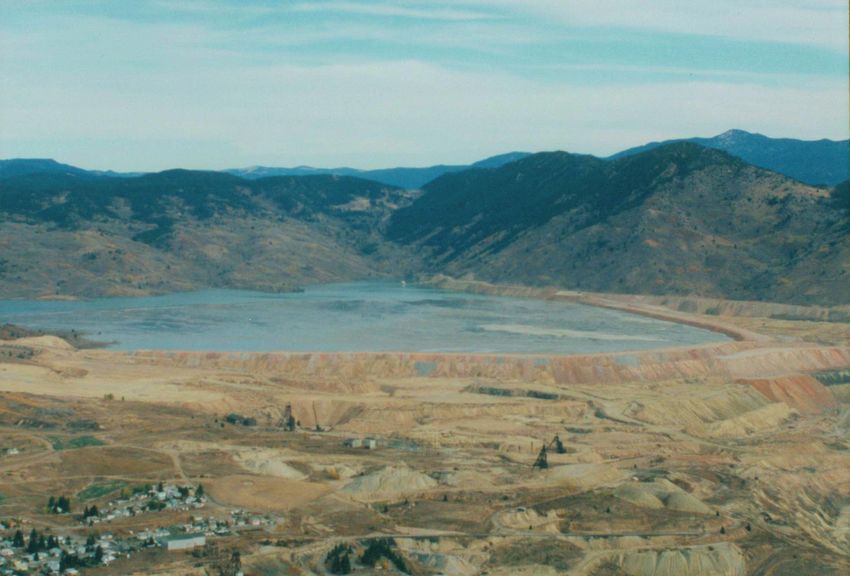
tailings pond (which is currently in use for operations for an estimate of total fill volume. By comparing
at the Continental Pit), which can be seen in the aerial changes in elevation of the DEM from 1904 to the
photograph in Figure 11. The historical path of the 1989–1991 Horizon DEM, however, the height of the
creeks and associated ponds along this drainage can dam in 1991 can be estimated at 168 m. This is
also be seen in the lowest areas of Figure 1. The other comparable with the 1998 height estimate of 174 m
two blue lines that appear to run along the slopes on from the International Commission of Large Dams
either side of the Upper Silver Bow Creek Valley were (ICOLD) survey (Marchuk, 2000). The estimate of
ditches dug in the 1860s to provide water for placer fill height from the GIS model seems reasonable,
mining operations. especially because some additional tailings were
Unlike the Berkeley Pit, it may be more difficult for added in the years between 1991 and 1998.
modern observers to appreciate the volume or extent
of the Yankee Doodle tailings dam. Figure 12A
DISCUSSION
shows a 3D perspective view of the Butte Mining
District as of 1897, including the valley that contained The topographic and volumetric models created in
the historical Silver Bow Creek. Figure 12B shows the GIS for this study are useful for various purposes.
same 3D view, but it now includes the volume of From a volumetric perspective, this cut-and-fill model
waste rock and tailings associated with the Yankee is the only rigorous effort to verify the quantity of
Doodle tailings dam in yellow and orange. Because material removed from the Berkeley Pit during open-
the Horizon survey does not extend to the northern pit mining. This is important because there is no way
end of the Yankee Doodle tailings dam and its to directly verify the completeness or accuracy of the
adjacent waste rock dumps, these data do not allow AMC haulage records. This volumetric model arrives
Environmental & Engineering Geoscience, Vol. XVII, No. 3, August 2011, pp. 213–226 221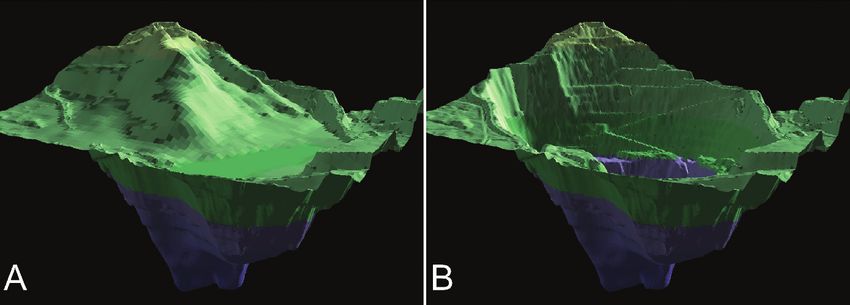
Kennelly

Figure 9. (A) A 3D visualization of the Berkeley Pit using a vertical exaggeration of 33, and with the topography from 1897 added on top.
(B) The same view of the pit, but without the topography from 1897 added on top.

at an independent estimate within 8 percent of                             Volumetric estimates from this study are also of use
previously reported values, even while using very                        in reconnaissance of portions of the Butte Mining
general assumptions and a topographic map pro-                           District overlain with waste rock or mine tailings. It is
duced in 1897/1904.                                                      important to recognize prior land-use practices before

Figure 10. A 3D visualization of the Berkeley Pit, including the location of underground mine workings excavated during open-pit mining
(colors represent depth levels from Anaconda Mining Company maps), using a vertical exaggeration of 33. White contours at an interval of
100 ft (30.5 m) represent the elevation of the base of the pit and the 1897 topography, as illustrated by the volumetric model in Figure 9A.

222                   Environmental & Engineering Geoscience, Vol. XVII, No. 3, August 2011, pp. 213–226
Landscape Volumetrics, Butte Mining District

Figure 11. An aerial photograph (looking northeast) of the uppermost portion of the Yankee Doodle tailings dam and the associated
tailings pond (courtesy of Ted Duaime, Montana Bureau of Mines and Geology).

planning and developing current facilities. As an                  Such displays offer a simple way in which to
example, a skateboard park in Butte was proposed                   understand spatial relationships, and they are well
but not built on a mine tailings site. While material              suited to education and outreach. For example,
from open-pit mining associated with the Berkeley Pit              displays of Butte’s changing morphology are used in
is relatively well documented from 1955 to 1982,                   tours of Butte conducted by faculty at Montana Tech
much material from underground and small open-pit                  of the University of Montana, the Montana Bureau
operations was dispersed throughout the area in the                of Mines and Geology, and the Clark Fork Water-
late 1800s and early 1900s with little or no documen-              shed Education Program.
tation. Although site visits could be used to identify                Butte Hill was the heart of underground mining
the presence of such waste rock or tailings, the                   operations in the early to mid-1900s, and it was a
volumetric model offers a first-pass assessment of                 landform that could be seen throughout Butte. With
areas where larger volumes of such material are most               mining of the Berkeley Pit, however, the highest
likely to be encountered.                                          portion of Butte Hill has been removed. Observers
   A practical application for this model is being used is         unfamiliar with the pre-pit morphology may have
in the maintenance of infrastructure. In some areas of             difficulty visualizing its location and extent. Images
Butte, sewer and water lines are buried in mine waste.             such as Figure 3 and 5 show Butte Hill’s original
In general, these lines undergo more rapid degradation             morphology and its relationship to the Berkeley Pit as
than those not buried in such material. The ground-                a promontory on a northwest-southeast–trending
water in this type of fill is of higher acidity and contains       highland. This ridge trended at a right angle to the
leached metals, which are able to corrode cast iron                deepest portion of the Berkeley Pit, which reflects the
sewer lines and culverts. Recent efforts in Butte to               northeast-southwest orientation of numerous copper
replace thousands of feet of such lines used this                  veins in the area. Also, Butte Hill did not directly
volumetric study to help identify areas where lines                overlie the deepest portion of the Berkeley Pit, but
would most likely be buried in mine waste.                         was located to its northwest. The steep northern wall
   Perhaps the more important utility of this model,               of the pit was a lower portion of the northwest-
however, is the ability to visually represent historical           southeast–trending ridge.
and present-day terrain, as well as the volume of                     For outreach and educational purposes, many
material displaced. Although no new information                    people have a difficult time comprehending large
regarding the location of past or present features was             volumes or areas. Attempts to comprehend a volume
discovered, this study has merit in visually integrating           of 423.5 M m3 could be confounded by not being able
landscape features from Butte’s past and present.                  to visualize the upper surface of material removed.

                     Environmental & Engineering Geoscience, Vol. XVII, No. 3, August 2011, pp. 213–226                      223
Kennelly
displays such as Figure 12 can be used for educational
and outreach purposes to aid in the understanding of
the importance of dam morphology to such issues. In
the case of the Yankee Doodle tailings dam,
Figure 12 highlights the large volume of fill material,
which may be difficult to assess from modern-day
topography (compare with Figure 4). It also high-
lights the relationship between the tailings and
historical drainages. These areas may be more prone
to seepage of contaminants, since they are localized
lows, are composed of higher-permeability tailings,
and have higher concentrations of metals, which are
more susceptible to leaching.
In discussing the utility of such volumetric models,
it is important to point out the limitations of working
with data derived from historical maps. Although an
RMS error of 3.14 m indicates good accuracy of
location throughout the map, there is no systematic
way to measure overall accuracy of elevation. This
study highlights areas in which comparisons with
current elevations and a prior knowledge indicate
useful levels of accuracy, but other areas are more
suspect. One example is the undisturbed area of Big
Butte (Figures 3 and 4), which is an eroded remnant
of a small volcanic vent that sits on the edge of a
much larger volcanic field and which has associated
Figure 12. Two 3D visualizations looking up the valley of Upper lava deposits that lack the surficial copper and silver
Silver Bow Creek using a vertical exaggeration of 33. (A) The veins prevalent throughout the surrounding area.
volume in orange and yellow represents tailings and waste rock
used to create the modern-day Yankee Doodle tailings dam and
Figure 6 shows extensive areas of added volume on its
those adjacent to it. (B) The same view, with the volume of tailings slopes, often in excess of 20 ft (6 m), although no fill is
from Figure 12A removed. View (A) would reflect the landscape known to have been placed there. There is also an
of the Upper Silver Bow Creek Valley in 1897. The middle blue elevation difference in the summit of 9 ft (3 m).
line flowing into the ponds is Silver Bow Creek. The other two Unlike the area of Missoula Gulch or the Interstate
blue lines that appear to run along the valley slopes were ditches
dug in the 1860s to provide water for placer mining operations.
90/115/15 interchange, the volcanic rocks of Big Butte
contained no copper or silver veins. As a result, this
area may not have been as sharp a focus of accurate
The total volume removed is not the Berkeley Pit of mapping as more copper- and silver-prone areas
Figure 9B filled to its rim; it is the volume represented during the 1895/1903 surveys.
by Figure 9A. A model capable of being rotated,
explored, and animated, as is made possible by this
study, may further help people to visualize such large CONCLUSIONS
volumes. This model of volumetric changes in the Butte
The image in Figure 10 underscores the intercon- Mining District illustrates a practical application of
nectivity of the Berkeley Pit with the extensive 3D GIS technology that can also be used to quantify and
underground mine workings that occur throughout visualize extensive landscape changes. The results
the Butte Mining District. Such images can also be found here using maps from near the beginning and
useful for outreach and education about issues end of the 1900s show how historical maps can be
regarding interactions of groundwater with water in useful in volumetric studies. This study concludes that
the Berkeley Pit and the complex network of flooded many resulting patterns of cut-and-fill are consistent
underground mine workings (Gammons et al., with landscape features such as the Missoula Gulch
2006b). fill, the Interstate 90/15/115 earthworks, and the
Various environmental issues of concern to the Yankee Doodle tailings dam. Additionally, the model
public can arise with tailings dams. These problems can be used to make independent volumetric esti-
range from contamination due to seepage (Rosner mates of material removed from open-pit mining of
and van Schalkwyk, 2000) to dam failure. Visual the Berkeley Pit. Finally, visualizations of historical
224 Environmental & Engineering Geoscience, Vol. XVII, No. 3, August 2011, pp. 213–226Landscape Volumetrics, Butte Mining District
terrain and volume changes are useful in illustrating DEMERS, M. N., 2003, Fundamentals of Geographic Information
important alterations in the Butte Mining District for Systems, 2nd ed.: John Wiley & Sons, New York.
DUAIME, T. E.; KENNELLY, P. J.; AND THALE, P. R., 2004, Butte,
outreach and educational purposes. Montana: Richest Hill on Earth, 100 Years of Underground
Mining: Montana Bureau of Mines and Geology Miscella-
neous Contribution 19, 1 sheet(s), scale 1:9,000.
ACKNOWLEDGMENTS EASA, S. M., 1998, Smooth surface approximation for computing
pit excavation volume: Journal of Survey Engineering,
I would like to acknowledge the assistance of Vol. 124, No. 3, pp. 125–133.
numerous individuals at the Montana Bureau of ERVIN, S. M., 2001, Digital landscape modeling and visualization:
Mines and Geology in digitizing and preparing data A research agenda: Landscape and Urban Planning, Vol. 54,
for this study, especially Ted Duaime, Ken Sandau, pp. 49–62.
Paul Thale, Bob Bergantino, and Jennifer Spritzer. I FERGUSON, J.; KERMODE, N.; NASH, C. L.; AND SKETCH, W. A. J.,
1995, Managing and Minimizing Construction Waste:
would also like to acknowledge Gerry Daumiller of the A Practical Guide: Telford Publications, London, U.K.
Montana Natural Resource Information System for FRYIRS, K. AND BRIERLEY, G. J., 2001, Variability in sediment
compiling contours from the Horizon and Anaconda delivery and storage along river courses in Bega catchment,
Mining Company in the area of the Berkeley Pit. NSW, Australia: Implications for geomorphic river recovery:
Geomorphology, Vol. 38, pp. 237–265.
FUSE, T.; SHIMIZU, E.; AND MORICHI, S., 1998, A study on
REFERENCES geometric correction of historical maps: International Ar-
chives of Photogrammetry and Remote Sensing, Vol. 32, Part
AKAY, A. E., 2003, Minimizing Total Cost of Construction, 5, pp. 543–548.
Maintenance, and Transportation Costs with Computer-Aided GAMMONS, C. H.; METESH, J. J.; AND DUAIME, T. E., 2006a, An
Forest Road Design: Ph.D. Dissertation, Oregon State Univ., overview of the mining history and geology of Butte,
229 pp. Montana: Mine Water and Environment, Vol. 25, No. 2,
ALKASS, S. AND HARRIS, F., 1991, Development of an integrated pp. 70–75.
system for planning earthwork operations in road construc- GAMMONS, C. H.; METESH, J. J.; AND SNYDER, D. M., 2006b, A
tion: Construction Management and Economics, Vol. 9, survey of the geochemistry of flooded mine shaft water in
pp. 263–289. Butte, Montana: Mine Water and Environment, Vol. 25,
ASKEW, W. H.; AL-JIBOURIB, S. H.; MAWDESLEY, M. J.; AND No. 2, pp. 100–107.
PATTERSON, D. E., 2002, Planning linear construction GOKTEPE, A. B. AND LAV, A. H., 2003, Method for balancing cut-
projects: Automated method for the generation of earthwork fill and minimizing the amount of earthwork in the geometric
activities: Automation in Construction, Vol. 11, pp. 643–653. design of highways: Journal of Transportation Engineering,
BALLETTI, C., 2000, Analytical and quantitative methods for the Vol. 129, No. 5, pp. 564–571.
analysis of the geometrical content of historical cartography: GOKTEPE, A. B. AND LAV, A. H., 2004, Method for optimizing
International Archives of Photogrammetry and Remote Sens- earthwork considering soil properties in the geometric design
ing, Vol. 33, Part B5, pp. 30–37. of highways: Journal of Surveying Engineering, Vol. 130,
BANKS, J. H., 2001, Introduction to Transportation Engineering: No. 4, pp. 183–190.
McGraw Hill, New York. GUMUS, S.; ACAR, H.; TUNAY, M.; AND ATESOĞLU, A., 2003,
BRASINGTON, J.; RUMSBY, B. T.; AND MCVEY, R. A., 2000, Calculation of cut and fill volumes by GIS in forest road
Monitoring and Modelling Morphological Change in a Braided projecting. In The Conceptual Framework of Wood Logistics
Gravel-bed River Using High Resolution GPS-based Survey: Systems in Turkish Forestry XII, World Forestry Congress,
John Wiley and Sons, Hoboken, NJ. Canada.
BROWN, D. G. AND ARBOGAST, A. F., 1999, Digital photogram- HASSAN, Y.; EASA, S. M.; AND ABD EL HALIM, A. O., 1998,
metric change analysis as applied to active coastal dunes in Highway alignment: Three-dimensional problem and
Michigan: Photogrammetric Engineering & Remote Sensing, three-dimensional solution: Transportation Research Record:
Vol. 65, No. 4, pp. 467–474. Journal of the Transportation Research Board, Vol. 1612,
BURTON, N. R. AND SHELL, C. A., 2000, GIS and visualising pp. 17–25.
the palaeoenvironment: Bar International Series, Vol. 845, HENDERSON, D.; VAUGHAN, D. E.; JACOBSON, S. H.; WAKEFIELD,
pp. 81–90. R. R.; AND SEWELL, E. C., 2003, Solving the shortest route cut
BUTTENFIELD, B. P. AND MACKANESS, W. A., 1991, Visualization. and fill problem using simulated annealing: European Journal
In Maguire, D. J.; Goodchild, M. F.; and Rhind, D. W. of Operational Research, Vol. 145, pp. 72–84.
(Editors), Geographic Information Systems: Principles, Vol. 1: HORN, B. K. P., 1981, Hill shading and the reflectance map:
Harlow Longman Scientific and Technical, Essex, UK, Proceedings of IEEE, Vol. 69, No. 1, pp. 14–47. (originally
pp. 427–443. published 1979, in Workshop on Image Understanding: Palo
CHAN, W. T. AND FAN, T., 2003, Using GIS and genetic algorithm Alto, CA, April, p. 79–120; reprinted 1982, Geo-processing,
in highway alignment optimization: Intelligent transportation Vol. 2, No. 1, pp. 65–146).
systems: Proceedings of IEEE, Vol. 2, pp. 1563–1567. HUSTRULID, W., 1982, Underground Mining Methods Handbook:
CHANG, K., 2009, Introduction to Geographic Information Systems: Society of Mining Engineers of AIME, New York.
McGraw Hill, New York. HUSTRULID, W.; QIANYUAN, Y.; AND KRAULAND, N., 1989,
CLARKE, K. C., 1995, Analytical and Computer Cartography, 2nd Modeling of cut-and-fill mining systems—Näsliden revisited.
ed.: Prentice-Hall, Englewood Cliffs, NJ. In Hassani, F. P.; Scoble, M. J.; and Yu, T. R. (Editors),
CODUTO, D. P., 1998, Geotechnical Engineering: Principles and Innovation in Mining Backfill Technology: Balkema, Rotter-
Practices: Prentice Hall, Upper Saddle River, NJ. dam, The Netherlands, pp. 147–164.
Environmental & Engineering Geoscience, Vol. XVII, No. 3, August 2011, pp. 213–226 225Kennelly
IMHOF, E., 1982, Cartographic Relief Presentation: Walter de ROBINSON, A. H.; MORRISON, J. L.; MUEHRCKE, P. C.; KIMERLING,
Gruyter, Berlin, Germany. A. J.; AND GUPTILL, S. C., 1995, Elements of Cartography, 6th
JHA, M. K.; MCCALL, C.; AND SCHONFELD, P., 2001, Using GIS, ed.: John Wiley and Sons, New York.
genetic algorithms, and visualization in highway develop- ROSNER, T. AND VAN SCHALKWYK, A., 2000, The environmental
ment: Computer-Aided Civil and Infrastructure Engineering, impact of gold mine tailings footprints in the Johannesburg
Vol. 16, No. 6, pp. 399–415. region, South Africa: Bulletin of Engineering Geology and
JHA, M. K. AND SCHONFELD, P., 2004, A highway alignment Environment, Vol. 59, No. 2, pp. 137–148.
optimization model using geographic information systems: SHIMIZU, E. AND FUSE, T., 2003, Rubber-sheeting of historical
Transportation Research Part A, Vol. 38, pp. 455–481. maps in GIS and its application to landscape visualization of
JORDAN, D., 2002, Conceptual regrading using three-dimensional old-time cities: Focusing on Tokyo of the past. In Proceed-
GIS to evaluate mine reclamation: Directions Magazine: ings of the 8th International Conference on Computers in
Electronic document, available at http://proceedings.esri. Urban Planning and Urban Management, Vol. 11A-3.
com/library/userconf/proc01/professional/papers/pap875/p875. SHIMIZU, E.; FUSE, T.; AND SHIRAI, K., 1999, Development of GIS
htm integrated historical map analysis system: International
KENNELLY, P. J. AND KIMERLING, A. J., 2004, Hillshading of terrain Archives of Photogrammetry and Remote Sensing, Vol. 32,
using layer tints with aspect-variant luminosity: Cartography Part 5-3W12, pp. 79–84.
and Geographic Information Science, Vol. 31, No. 2, pp. 67– SLOCUM, T.; MCMASTER, R.; KESSLER, F.; AND HOWARD, H., 2008,
77. Thematic Cartography and Geovisualization, 3rd ed.: Prentice-
KORUP, O.; MCSAVENEY, M. J.; AND DAVIES, T. R. H., 2004, Hall, Inc., Upper Saddle River, NJ.
Sediment generation and delivery from large historic SON, J.; MATTILA, K. G.; AND MYERS, D. S., 2007, Determination
landslides in the Southern Alps, New Zealand: Geomorphol- of haul distance and direction in mass excavation: Journal of
ogy, Vol. 61, pp. 189–207. Construction Engineering and Management, Vol. 131, No. 3,
LIU, K. AND SESSIONS, J., 1993, Preliminary planning of road pp. 302–309.
systems using digital terrain models: Journal of Forest STEVENS, N. F.; WADGE, G.; AND MURRAY, J. B., 1999, Lava flow
Engineering, Vol. 4, No. 2, pp. 27–32. volume and morphology from digitised contour maps: A case
LO, C. P. AND YOUNG, A. K. W., 2002, Concepts and Techniques of study at Mount Etna, Sicily: Geomorphology, Vol. 28,
Geographic Information Systems: Prentice-Hall, Upper Sad- pp. 251–261.
dle River, NJ, 492 p.
STÜCKELBERGER, J. A.; HEINIMANN, H. R.; AND BURLET, E. C.,
LONGLEY, P. A.; GOODCHILD, M. F.; MAGUIRE, D. J.; AND RHIND,
2006, Modeling spatial variability in the life-cycle costs of
D. W., 2011, Geographic Information Systems and Science,
low-volume forest roads: European Journal of Forest Re-
3rd ed.: John Wiley & Sons, Inc., New York, 539 p.
search, Vol. 125, No. 4, pp. 377–390.
MARCHUK, A. N., 2000, Neotectonics and dams: A survey of
U.S. CENSUS BUREAU, 2010, Tiger/Line Shapefiles: http://www.
documents from the International Commission on Large
census.gov/geo/www/tiger
Dams: Power Technology and Engineering (formerly Hydro-
technical Construction), Vol. 34, No. 10, pp. 520–523. U.S. GEOLOGICAL SURVEY, 1897, Geological Atlas of the United
MARTINEZ-CASASNOVAS, J. A.; RAMOS, M. C.; AND RIBES-DASI, M., States, Butte Special Folio, Montana. Folio 38: Government
2002, Soil erosion caused by extreme rainfall events: Mapping Printing Office, Washington, DC.
and quantification in agricultural plots from very detailed WEIBEL, R. AND HELLER, M., 1991, Digital terrain modeling. In
digital elevation models: Geoderma, Vol. 105, pp. 125–140. Maguire, D. J.; Goodchild, M. F.; and Rhind, D. W.
MCCULLAGH, M. J., 1998, Quality, use and visualisation in terrain (Editors), Geographic Information Systems: Principles
modeling. In Lane, S. N.; Richards, K. S.; and Chandler, and Applications: Longman, London, U.K., pp. 269–
J. H. (Editors), Landform Monitoring, Modeling and Analysis: 297.
John Wiley & Sons, Chichester, U.K., pp. 95–117. WHEELER, P. J., 2005, Analysis of pre/post flood bathymetric
MENNIS, J. L. AND FOUNTAIN, A. G., 2001, A spatio-temporal GIS change using a GIS: A case study from the Gippsland Lakes,
database for monitoring alpine glacier change: Photogram- Victoria, Australia: Applied GIS, Vol. 1, No. 3, DOI:10.2104/
metric Engineering and Remote Sensing, Vol. 67, No. 8, ag050024.
pp. 967–975. WHEELER, P. J. AND PETERSON, J. A., 2006, Volumetric change
MOREB, A. A., 1996, Linear programming model for finding in a flood-tide delta: Application of the ‘cut and fill’ process
optimal roadway grades that minimize earthwork cost: flow diagram for decision support in port management at
European Journal of Operational Research, Vol. 93, pp. 148– Lakes Entrance, Victoria, Australia. In Proceedings of
154. SSC2005 Spatial Intelligence, Innovation and Praxis: The
NEWSHAM, R.; BALSON, P. S.; TRAGHEIM, D. G.; AND DENNISS, A. National Biennial Conference of the Spatial Sciences Institute,
M., 2002, Determination and prediction of sediment yields September 2005: Spatial Sciences Institute, Melbourne,
from recession of the Holderness Coast, NE England: Journal Australia.
of Coastal Conservation, Vol. 8, pp. 49–54. WHITE, D., 1985, Relief modulated thematic mapping by com-
PAPACOSTAS, C. S. AND PREVEDOUROS, P. D., 2000, Transportation puter: American Cartographer, Vol. 12, No. 1, pp. 62–68.
Engineering and Planning, 3rd ed.: Prentice Hall, Englewood YABUKI, N. AND SHITANI, T., 2005, A management system for cut
Cliffs, NJ. and fill earthworks based on 4D CAD and EVMS:
PRICE, M., 1999, Terrain modeling with ArcView 3D Analyst: Computing in Civil Engineering, American Society of Civil
ArcUser, Vol. 2, No. 1, Electronic document, available at Engineers Conference Proceedings, No. 179, pp. 152,
http://www.esri.com/news/arcuser/0199/web4.html DOI:10.1061/40794(179)152.
REINECK, H. E. AND SINGH, I. B., 1986, Depositional Sedimentary YOELI, P., 1965, Analytical hill shading: Surveying and Mapping,
Environments: Springer-Verlag, New York. Vol. 25, No. 4, pp. 573–579.
226 Environmental & Engineering Geoscience, Vol. XVII, No. 3, August 2011, pp. 213–226You can also read