International Climate Initiatives - A way forward to close the emissions gap? 31/2016 - Umweltbundesamt
←
→
Page content transcription
If your browser does not render page correctly, please read the page content below

CLIMATE CHANGE

 31/2016

International Climate
Initiatives –
A way forward to close the
emissions gap?
Initiatives’ potential and role under the Paris
Agreement
CLIMATE CHANGE 31/2016

Environmental Research of the
Federal Ministry for the
Environment, Nature Conservation,
Building and Nuclear Safety

Project No. (FKZ) 3715 41 109

International Climate Initiatives – A way
forward to close the emissions gap?
Initiatives’ potential and role under the Paris
Agreement
by

Jakob Graichen, Sean Healy, Anne Siemons
Öko-Institut e.V.
Niklas Höhne, Takeshi Kuramochi, Sofia Gonzales-Zuñiga, Sebastian Sterl
NewClimate Institute
Jan Kersting, Jakob Wachsmuth
Fraunhofer-Institut für System- und Innovationsforschung ISI

On behalf of the Federal Environment Agency (Germany)
Imprint

Publisher:
Umweltbundesamt
Wörlitzer Platz 1
06844 Dessau-Roßlau
Tel: +49 340-2103-0
Fax: +49 340-2103-2285
info@umweltbundesamt.de
Internet: www.umweltbundesamt.de

  /umweltbundesamt.de
  /umweltbundesamt

Study performed by:
Öko-Institut Berlin
Schicklerstraße 5 –7
10179 Berlin

Study completed in:
October 2016

Edited by:
Section I 2.1 International Climate Protection
Judith Voß-Stemping

Publication as pdf:
http://www.umweltbundesamt.de/publikationen

ISSN 1862-4359

Dessau-Roßlau, November 2016

The Project underlying this report was supported with funding from the Federal
Ministry for the Environment, Nature Conservation, Building and Nuclear safety
under project number FKZ 3715 41 109. The responsibility for the content of this
publication lies with the author(s).

Evaluation of the impact of global, regional and national initiatives outside UNFCCC on GHG emissions – Discussion Paper

Table of Content
Figures ...................................................................................................................................... 6
1       Summary ........................................................................................................................... 4
2       Background........................................................................................................................ 6
3       Identification of initiatives .................................................................................................... 7
        3.1          Geographical coverage and focus areas of initiatives ................................................... 7
        3.2          Characteristics of initiatives and topic areas ............................................................... 8
        3.2.1            Formulation of commitments .............................................................................. 8
        3.2.2            Reporting and monitoring ................................................................................... 8
        3.2.3            Distribution of responsibilities ............................................................................. 9
        3.3          Choice of initiatives and topic areas for further analysis ............................................... 9
4       Quantitative assessment .................................................................................................... 10
        4.1          Global potential impact ........................................................................................ 11
        4.2          Country-level assessment ..................................................................................... 13
        4.2.1            Country-level assessment example: EU................................................................ 13
        4.2.2            Initiatives analysed globally ............................................................................... 15
        4.3          Aggregation to global level .................................................................................... 16
5       Good practice analysis ....................................................................................................... 19
        5.1          Results .............................................................................................................. 20
        5.2          Good Practice Initiatives ....................................................................................... 22
6       International initiatives and the UNFCCC ............................................................................... 22
7       Bibliography ..................................................................................................................... 25

                                                                                                                                                5
Evaluation of the impact of global, regional and national initiatives outside UNFCCC on GHG emissions – Discussion Paper

Figures
Figure 1-1              Global emission (incl. LULUCF) and emissions reduction from
                        initiatives .................................................................................5
Figure 3-1              Number of initiatives covering geographic regions ..........................7
Figure 3-2              Number of initiatives covering focus areas.....................................8
Figure 4-1              Schematic representation of the three steps outlined above ..........11
Figure 4-2              Global potential impact of the quantified initiatives in 2020 and
                        2030 .....................................................................................12
Figure 4-3              Potential impact of initiatives in the EU in 2020 and 2030 ..............14
Figure 4-4              Emission levels for the EU under Current Policies, INDC and initiatives'
                        potential ...............................................................................15
Figure 4-5              Overview of potential emissions reduction from initiatives in each
                        country .................................................................................17
Figure 4-6              Global emission (incl. LULUCF) and emissions reduction from
                        initiatives ...............................................................................18
Figure 4-7              Flow of emissions reduction from initiatives per sector and per
                        country .................................................................................19
Figure 5-1              Mean of relative global potential impact by topic area ...................20
Figure 5-2              Absolute and relative impact of initiatives in 2030 and their share of
                        business members ..................................................................21
Figure 6-1              Potential contribution of initiatives towards the achievement of the
                        2030 INDC for the EU and the USA and their contribution on GHG
                        reductions beyond the INDCs. ...................................................23

                                                                                                                           6
1 Summary
In December 2015 Parties adopted the Paris Agreement at the 21st session of the United Nations Framework
Convention on Climate Change (UNFCCC). In its Article 2 governments agreed to limit global warming to “well
below 2°C above pre-industrial levels” and to pursue to limit it to 1.5°C (UNFCCC 2015). The UNEP Emissions
Gap Report 2015 showed that a gap of 14 GtCO2e exists for 2030 between the (unconditional) mitigation
proposals submitted by Parties as part of their intended nationally determined contributions (INDCs) and a
pathway compatible with holding temperature increase below 2°C (UNEP 2015b). Against this background
international climate initiatives can play an important role for reducing global emissions. Based on an analysis
of 174 initiatives we analysed the potential impact of these initiatives on GHG emissions, shared elements of
initiatives which have a high impact and the relationship between such initiatives and the UNFCCC.
This study is a first attempt to quantify the potential impact of such initiatives in comparison to the INDCs. For
Brazil, China, the EU, India, Indonesia, Japan, Russia, USA and the Rest of World we compare the ambition level
of 19 initiatives with those of the INDCs. The study involved the following key steps:
1) In a first step, we screened 174 initiatives examining their topic area, scope, expected impact, partic-
ipants and setup. Based on this screening we defined a set of nine criteria to identify those initiatives
suitable for further quantitative and qualitative analysis.
2) As a second step we did a quantitative analysis. We first assessed the mitigation impact of the selected
initiatives in a Paris Agreement World, i.e. assuming that the world at large will follow an emission
pathway based on the implementation of all INDCs. Secondly, we broke the impact down on a national
level taking into account national INDCs and the overlap between different initiatives addressing the
same sector. Thirdly, we added all remaining impact of the initiatives to estimate how much they can
help reduce emissions beyond current pledges.
3) In a third step, we then identified good practice elements shared by initiatives with high impact
through a correlation analysis.
4) Finally, we discuss the relationship between these initiatives and the UNFCCC.
For all the steps of our analysis, we assumed that all initiatives will achieve their goals. Additionally, we as-
sumed that all countries will achieve their INDC and not reduce their own efforts due to any additional mitiga-
tion coming from such initiatives.
The main results of our analysis are:
• Initiatives can play an important role in the transition to a low carbon economy. We estimate that the
19 quantified initiatives have the potential to reduce yearly emissions by approximately 5-
11 GtCO2e/year (average 8 GtCO2e/year) compared to an INDC background in 2030. Corresponding
global emissions would peak by 2020 and bring the world much closer to a 2°C compatible pathway
(Figure 1-1).
• Climate initiatives contribute towards achieving INDCs by helping governments in achieving their tar-
gets. National governments could be more ambitious with their national contributions to the Paris
Agreement, if they would take into account the various actions by cities, regions, businesses and sec-
tors that have been pledged and go beyond their INDCs.
• Non-state action and national action reinforce each other. Both pull in the same direction. The com-
parison of stringency shows that many initiatives have targets that go beyond those of national gov-
ernments. If the national governments would take all of the actions into account, they could be more
ambitious in their national contributions.
4Evaluation of the impact of global, regional and national initiatives outside UNFCCC on GHG emissions – Discussion Paper
• Active involvement of NGOs either as the leader of an initiative or members tends to lead to higher
reductions and more co-benefits. Another common element of many successful initiatives is a perma-
nent secretariat. Voluntary agreements are most suitable for short-term reductions but have a less
important role for 2030 targets.
• Most international initiatives from our selection are not quantifiable. For some this is due to their
inherent nature (e.g. focus on information exchange or MRV) but for many there is a lack of a clearly
defined target, information on actions planned/taken and their impact or follow-up on initial an-
nouncements. Adequate reporting from initiatives would greatly enhance transparency, help replicate
impacts, inform national governments and the UNFCCC process and facilitate access to funding for
the initiatives themselves. A standardised reporting format could greatly enhance transparency.
• Large uncertainties remain and further work is needed. Firstly, we did not analyse whether the initia-
tives are likely to achieve their targets. Such an assessment would most likely lead to reduced impacts
by 2030. On the other hand, we were only able to quantify about one tenth of all the screened initia-
tives. Adequate reporting would increase the overall impact of climate initiatives.
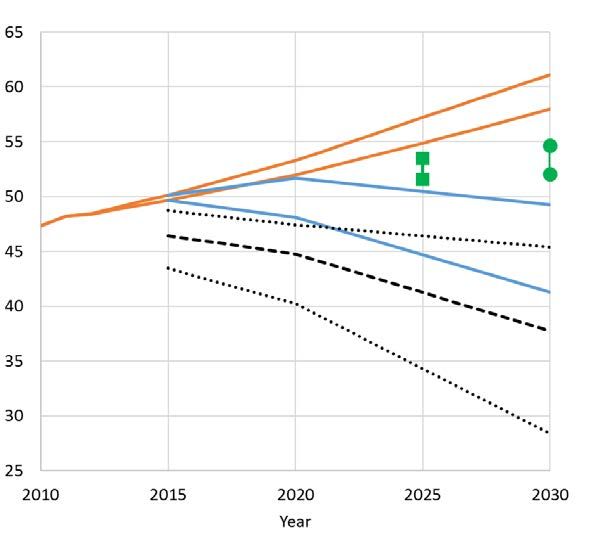
Figure 1-1 Global emission (incl. LULUCF) and emissions reduction from initiatives
Renewable
electricity
Transport
8 GtCO2e
Buildings
Cities &
regions
Forestry
Non-CO2
Industry &
business
Note: Global emission levels incl. LULUCF (historic, future under current policies, and future under INDC lev-
els) along with the potential overachievement of INDC levels by the analysed initiatives scaled up to
the global level. The dashed (dotted) lines indicate the median (10th/90th percentile values) of global
2°C compatible pathways (CAT, 2015). Right: Disaggregation of the contribution of initiatives overa-
chieving INDCs by initiative in 2030 (average number shown). The two CCAC sub-initiatives we ana-
lysed (on HFC and CH4 reduction, respectively) have been grouped together under “CCAC”. Initiatives
with less than 10 MtCO2 expected contribution (ABAOCP and ULCOS) are not in the legend as they are
not visible in the graph.
Source: Author’s own calculations (initiatives), Climate Action Tracker (2015) (current policies, INDCs)
5Evaluation of the impact of global, regional and national initiatives outside UNFCCC on GHG emissions – Discussion Paper
2 Background
In December 2015 Parties adopted the Paris Agreement at the 21st session of the UNFCCC. In its Article 2
governments agreed to limit global warming to “well below 2°C above pre-industrial levels” and to pursue to
limit it to 1.5°C (UNFCCC 2015). According to the Fifth Assessment Report of the Intergovernmental Panel on
Climate Change (IPCC), global greenhouse gas (GHG) emissions need to decrease by at least 40% to 70% below
current levels by 2050, in order to hold temperature increase below 2°C. During the preparation of the Paris
Agreement the Work Stream II of the Ad-hoc Working Group on the Durban Platform for Enhanced Action
(ADP) focused on enhancing mitigation actions up to 2020, with the objective to increase efforts in the near
future already. This is necessary as the existing mitigation proposals for the year 2020 are insufficient to hold
the temperature increase below 2°C compared to pre-industrial levels. The UNEP Emissions Gap Report 2015
showed that a gap of 14 GtCO2e exists for 2030 between the mitigation proposals submitted by Parties as part
of their INDCs and a pathway compatible with holding temperature increase below 2°C (UNEP 2015b). The
report also stresses the importance of pre-2020 action for achieving the overall mitigation target.
Besides discussions about increasing the ambition of national mitigation targets of individual countries under
the UNFCCC, Work Stream II also discussed which role other international initiatives, which are not part of the
UNFCCC, could play in the climate negotiations. It is currently unclear how the process will integrate and ac-
count for these activities. The negotiations so far have provided a platform for sharing information on climate
initiatives outside the UNFCCC; however, they have not yet led to an increase in ambition in specific sectors.
Further, large uncertainty about the potential mitigation impact of these initiatives exists. It is for example
unclear, how the ambition level of national actions and targets overlaps with that of international initiatives.
Within the literature, attempts have been made to estimate the impact of international initiatives. For exam-
ple, PBL estimates reductions of 2.5 GtCO2e in 2020 and 5.5 GtCO2e in 2030 resulting from the most relevant
initiatives, of which 1.8 GtCO2e in 2020 and 3.8 GtCO2e in 2030 overlap with the impact of national pledges
and policies (Roelfsema et al. 2015). The overlap goes back to the assumption that emission reductions are
only additional, if the country whose emissions are affected does not have a pledge or does not include the
targeted sector in their pledge. Further, the report estimates an overlap between the initiatives of 0.2 GtCO2e
in 2020 and 0.3 GtCO2e in 2030. UNEP estimates that 15 major initiatives could reduce emissions by 2.5 GtCO2e
to 3.3 GtCO2e in 2020 (UNEP 2015a). The authors of the report assume an overlap of these initiatives with
national pledges of one third or less. This is based on a comparison of the existing pledges and the overall
mitigation potential. 1
This study aims at further contributing to increasing the clarity on the role of international initiatives by quan-
tifying their potential for emission reductions and comparing this to the emission levels currently assumed
under INDCs. 2 After the selection of a number of initiatives to analyse (see section 3) the following research
questions were set:
o What is the potential impact of the initiatives on GHG emissions? To answer this question, first a quan-
titative analysis of the technical potential of the initiatives is required. Additionally, one needs to check
how the initiatives relate to other already ongoing actions, such as national climate policy making,
NDCs and other initiatives (see section 4).
o What classifies a good initiative? To answer this question, the report will evaluate which elements
make an initiative successful and improve its capacity to effectively reduce emissions (see section 5).
1 Both the UNEP and PBL studies include potential LULUCF emission reductions from initiatives in the forestry sector in
their assessment.
2 In this report we refer only to INDCs, however the term also includes NDCs from countries that have already ratified the
Paris Agreement.
6Evaluation of the impact of global, regional and national initiatives outside UNFCCC on GHG emissions – Discussion Paper
o How do initiatives relate to the climate negotiations under the UNFCCC? This part of the project anal-
yses options to integrate initiatives in the UNFCCC process and provides recommendations for the
negotiations (see section 6).
3 Identification of initiatives
In order to ensure that the study collected information on initiatives that were representative of the global
potential impact, it was necessary to follow a process to ascertain which initiatives would be considered in the
subsequent analysis. In a first step 174 initiatives were screened and classified. The following sub-sections
provide an overview of the coverage and scope of these initiatives and those ultimately selected for further
quantitative and qualitative analysis.
3.1 Geographical coverage and focus areas of initiatives
Figure 3-1 illustrates the distribution of initiatives to regions. It shows that by far the largest share of initiatives
has global coverage. Of those initiatives that are limited to specific regions, most cover North America, fol-
lowed by Europe and Asia and the Pacific. There are a few initiatives with a focus on Africa or Latin America
and the Caribbean. These numbers provide support to the general perception that initiatives are an instrument
that mainly involves actors of the global North (compare Chan and Hale 2015).
Figure 3-1 Number of initiatives covering geographic regions
Note: Global initiatives are not counted for individual regions. One initiative may cover various regions.
Source: Author’s own illustration
Figure 3-2 gives an overview of the distribution to focus areas. Themes that are well covered by initiatives are
renewable energy and energy efficiency, as well as cities and subnational governments and businesses. In
terms of sectors, agriculture and forestry as well as transport are a focus of initiatives. Other sectors (energy
supply, industry, buildings) are all of similar importance. Areas that are less covered are the multilateral or-
ganisations, fluorinated gases and methane emissions from oil and gas production. Reasons for this could be
that those issues are well covered in other mechanisms (e.g. F-gases under the Clean Development Mechanism
and short term pollutants are already regulated by national legislation in many countries).
7Evaluation of the impact of global, regional and national initiatives outside UNFCCC on GHG emissions – Discussion Paper
Figure 3-2 Number of initiatives covering focus areas
Agriculture/Forestry
Other
Transport
Cities
Industry
Energy efficiency in buildings
Funding/ fiscal reform
Renewable electricity
Methane emissions from oil and gas…
Fluorinated gases
Multilateral organisations
0 5 10 15 20 25 30 35 40
Source: Author’s own illustration
3.2 Characteristics of initiatives and topic areas
3.2.1 Formulation of commitments
Of the 174 initiatives, about 25% have a clear commitment. In some cases, this commitment is of qualitative
nature, or there is no overarching commitment for the total initiative, but the commitments are fixed on a
member level. Most initiatives with clear commitments are in the transport sector, followed by cities, agricul-
ture and forestry and industry. Further, renewable electricity and energy efficiency in buildings have a rela-
tively high number of initiatives with a commitment.
These numbers approximately reflect the distribution of topic areas, nevertheless, some topic areas with a
large number of initiatives overall tend to have less clearly formulated commitments. The largest deviation is
evident in the sector “agriculture and forestry”, where there are more than 35 initiatives in total, but only 7
(19%) have a clear quantified commitment. This ratio is much more promising for initiatives for energy effi-
ciency in buildings (38%) and renewable electricity (44%). However, the total number of initiatives in these
sectors is lower.
3.2.2 Reporting and monitoring
The availability of information on monitoring and reporting frameworks of the initiatives is unfortunately lim-
ited. From the description of the initiatives on their websites it is often not clear, whether they regularly mon-
itor and report their activities or progress towards their targets. Thus, our data shows significant gaps here
and the conclusions are limited.
Of the 180 initiatives included in this overview, 54 have implemented a framework for regular reporting. This
may for example be annual reports of activities and progress of the overall initiative, or reporting of green-
house gases emissions and/or reductions, other performance indicators or actions of individual members.
For 93 initiatives, no information could be found within the scope of this project phase. The remaining either
have in place conditions which would allow them to regularly report, although they do not yet do so, or do not
have any monitoring and reporting system.
8Evaluation of the impact of global, regional and national initiatives outside UNFCCC on GHG emissions – Discussion Paper
3.2.3 Distribution of responsibilities
Of all the initiatives considered here, only 22% have established a permanent secretariat. This is of relevance
as it provides the organisations with a stable structure and helps to assure continuance of the activities. Par-
ticularly in the transport sector, a high share of initiatives has a permanent secretariat (41%). This share is also
high in the topic area “Methane emissions from oil and gas production”, however only four initiatives in this
area are included in our analysis.
3.3 Choice of initiatives and topic areas for further analysis
In order to select a number of initiatives for the quantitative and qualitative analysis, the following key criteria
were considered:
• Concrete definition of aims and activities: This does not exclude activities without a quantified target
but requires that the goals of the initiative and strategies to reach this goal are clearly defined.
• Data availability: The initiative needs to transparently show information to allow for a quantitative or
qualitative assessment of its impact on emission reductions.
These two key criteria mainly determined the number of initiatives selected for further analysis, however the
following additional criteria were also considered during the selection process and in the qualitative analysis
when identifying best practice:
• High mitigation impact in the envisaged topic area: A high mitigation potential in the tackled area
should have been identified by another source (e.g. UNEP gap report) to ensure that the initiative is
able to make a meaningful contribution to the global efforts.
• Direct mitigation impact expected: It needs to be clearly stated how the initiative aims to contribute
to mitigation so that a quantified impact can be expected or any other approach to contribute to
mitigation is defined.
• Significant geographical scope: The initiative needs to have a scope that is sufficiently large to contrib-
ute to mitigation in a meaningful way.
• Innovativeness of approach: The initiative needs to be able to trigger support for its cause as well as
public attention.
• Relevance of the issue: The initiative needs to tackle an issue that is of interest for a sufficiently large
group of stakeholders. Co-benefits such as improving air quality, reducing poverty or adaptation to
climate change can dramatically increase the relevance for stakeholders and the likelihood for imple-
mentation.
• Influence of the initiative: The initiative shall involve well-known and influential members in order to
be able to reach its envisaged targets and raise public attention.
• Timeframe: The initiative should aim to achieve relevant results by 2020/2030.
• Outside of national action: the initiative should contribute to emission reductions that are not primary
driven by national governments and are outside of the national action that is usually reported under
the UNFCCC process.
When applying these additional criteria to the overall list of initiatives, not all of them need to be fulfilled in
order to select an initiative for further analysis. Rather, they serve as guidelines for filtering the database in
order to get to a selection of initiatives that are representative of the overall landscape of initiatives in terms
of topic areas, actors and global distribution.
9Evaluation of the impact of global, regional and national initiatives outside UNFCCC on GHG emissions – Discussion Paper
4 Quantitative assessment
The quantitative analysis of initiatives has been performed in three distinct steps (Figure 4-1).
• In principle, all initiatives can contribute towards countries reaching their INDC ambitions, but some
may also have an impact that is likely to go beyond quantified INDC targets. In the first step, the global
potential impact of the selected initiatives has been estimated against global scenarios of current pol-
icies including INDCs, or (if such a scenario was not directly available) our own approximation of what
a realistic baseline scenario under INDCs would look like. 3 The estimations are based on converting
the quantified/quantifiable goal of an initiative into an energy- or emissions-related metric that can
be compared to the outcome of the INDC scenarios. This first step serves to assess the overall emission
reductions that an initiative theoretically covers, and thus get an idea of the “scale” of the initiative.
This step does not include any assessment of possible overlaps between initiatives within and across
sectors or with potential double-counting between initiatives.
• In the second step, the impact of the initiatives – wherever possible – was broken down to the level
of eight countries: Brazil, China, the EU, India, Indonesia, Japan, Russia and the USA. The impact in
each of these countries was assessed by taking into account the overlaps of the initiatives with other
initiatives in the same sector, initiatives in other sectors, and any particular specific policy or INDC
elements in the country not considered in the global INDC scenarios in the first step. Types of overlaps
considered include:
o One commitment counted twice, i.e. when the same company/city/etc. is subscribed to two dif-
ferent initiatives with a similar target;
o Initiatives quantification of whose target is expressed in the same metric and which therefore
could be complementary or overlapping;
o Initiatives that replace the same emissions, i.e. the targets of solar and wind energy initiatives both
striving for a certain share of electricity generation could together account for a higher share of
generation than there are non-renewables to replace;
o Initiatives with targets formulated at an aggregate level, i.e. city/region initiatives, or business in-
itiatives, striving to reduce total emissions below a certain baseline, which could be partly achieved
by (for instance) renewable energy, buildings, transport, and waste sector initiatives.
The aggregate of initiatives on a country-by-country basis thus represents in how far the impact of the
initiatives goes beyond the country’s own INDC. If an initiative could not be analysed on a country-by-
country basis, the overlap analysis was done on the global level.
• In the third step, the country specific impacts of initiatives – now with overlaps among initiatives taken
into account – were aggregated back to a worldwide level, thus resulting in an overall potential impact
including overlaps that could be compared to projections resulting from INDCs on the global level.
3 For the energy sector we used as baseline the “New Policies Scenario” of the IEA World Energy Outlook 2015, which
takes into account the energy-related components of all INDCs submitted by 1st of October 2015.
10Evaluation of the impact of global, regional and national initiatives outside UNFCCC on GHG emissions – Discussion Paper
Figure 4-1 Schematic representation of the three steps outlined above
Note: (1) The calculation of the potential impact of each initiative in absolute terms; (2) the disaggregation
of these impacts to a country-level and the analysis of their contribution relative to countries’ INDCs
and the overlaps between initiatives; (3) the re-aggregation of these results to the global level, result-
ing in the impact of initiatives relative to worldwide INDC trajectories.
Source: Author’s own illustration
4.1 Global potential impact
The assessment of the overall potential impact going beyond INDCs of the selected initiatives has led to the
estimated reduction levels plotted in Figure 4-2 By 2030, a high global impact beyond INDCs could be attained
by the Climate and Clean Air Coalition’s (CCAC) sub-sectoral initiatives striving to reduce black carbon 4, me-
thane and HFC 5 emissions. This is due to its high level of ambition in reducing non-CO2 climate pollutants in
combination with the comparatively low number of quantified goals in INDCs addressing methane and HFC
emissions reductions. The Bonn Challenge / New York Declaration on Forests could have a similarly high impact
due to its high ambition in afforestation (although our estimation is subject to a comparatively high uncer-
tainty, owing to the nature of estimating emissions from forestry), another area where there is a general lack
of quantified targets in INDCs (Climate and Clean Air Coalition 2016; Petersen, K. & Varela, J. 2015).
4 As black carbon is not included in most projections of GHG emissions, the figures below do not include reductions of
black carbon emissions.
5 Note that the CCAC aims to reduce HFCs via an amendment of the Montreal Protocol. As it is ambiguous whether to treat
such reductions as a contribution of the CCAC, the uncertainty range in Figure 4-2 reflects the potential impact of the
targeted HFC emission reductions in active CCAC members (US, Canada, EU).
11Evaluation of the impact of global, regional and national initiatives outside UNFCCC on GHG emissions – Discussion Paper
Most initiatives in the power, buildings and transport sector have been estimated to have the potential to
reduce emissions by numbers in the order of hundreds of MtCO2e/year by 2020 and 2030. These initiatives
focus on diverse issues such as renewable energy generation, energy efficiency appliances, reduction of ther-
mal energy demand and increased fuel efficiency. Some of these initiatives apply only in certain regions
whereas others are estimated to have potential impact across all investigated countries/regions.
The potential impacts of the industry initiatives are quite diverse in size. It must be mentioned here that busi-
ness initiatives have been assessed based on the current pledges of their signatories, and they are generally
expected to grow by getting higher numbers of endorsers and signatories over the next years, which could
lead to potentially much higher reductions than found here. For the Ultra-Low CO2 Steelmaking (ULCOS) - the
most ambitious initiative to reduce emissions in steelmaking - the reason for the comparatively low reductions
until 2020 and 2030 is that most of the technologies under development are only expected to be ready for
roll-out by the end of the 2020s.
The initiatives categorized under “companies”, as well as the Global Alliance for Clean Cookstoves, have not
been disaggregated to the country-level. For the company initiatives, emissions of each company would have
to be broken down to countries (information, which is often undisclosed) which is beyond the scope of this
analysis. The Global Alliance for Clean Cookstoves, on the other hand, would have an impact on the global
level but very little in most of the countries/regions (USA, EU, etc.) investigated here, and has thus only been
quantified globally (as has its overlap with other initiatives).
Figure 4-2 Global potential impact of the quantified initiatives in 2020 and 2030
Cities & Renewable Industry & Cities & Renewable Industry &
Forestry regions Buildings Transport electricity business Non-CO2 Forestry regions Buildings Transport electricity business Non-CO2
Bonn Challenge / NYD
Bonn Challenge / NYD
Caring for Climate
Caring for Climate
US Wind Program
US Wind Program
SunShot Initiative
SunShot Initiative
Under 2 MOU
Under 2 MOU
ABAOCP
ABAOCP
ULCOS
ULCOS
GCFTF
GCFTF
RE100
RE100
GBPN
GBPN
GACC
GACC
CCAC
CCAC
SEAD
SEAD
GFEI
GFEI
GMI
GMI
EWI
EWI
C40
C40
SEII
SEII
UIC
UIC
0
500
Emission reductions (MtCO2e/a)
1000
1500
2000
2500
3000
(a) 2020 (b) 2030
Note: The estimated overall (global) potential impact of the initiatives selected for quantification until 2020
(a) and 2030 (b). These numbers have been calculated against a baseline scenario on a global level
that assumes full implementation of the INDCs. Error bars indicate uncertainties in the translation of
the initiative’s quantified goals to emission reductions.
Source: Author’s own illustration
Full details on the estimations of the global potential impacts are available in an accompanying report, provid-
ing all necessary information to replicate the analysis. The general methodology was to translate an initiative’s
targets/goals into an energy- or emissions-related metric depending on the nature of the initiative. For exam-
ple, we expressed the target of RE initiatives in additional renewable energy generation in MWh by 2020/2030,
or potential for reducing emissions from deforestation in Mt CO2 by 2020/2030 for a forestry initiative. These
values were then compared to baseline INDC trajectories of the same metric up to 2020/2030.
12Evaluation of the impact of global, regional and national initiatives outside UNFCCC on GHG emissions – Discussion Paper
The differences between the total 2020 and 2030 potential impact stems mainly from two factors. Firstly,
initiatives’ ambition generally is estimated to be higher for 2030 than for 2020 (some initiatives set interme-
diate targets for 2020 and 2030; for others, we have estimated the intermediate potentials based on the over-
all ambition of the initiative). Secondly, the baseline values for overall emissions for 2020 are lower than those
in 2030, as global emissions are projected to keep rising under INDC implementation in the time horizon 2020-
2030.
4.2 Country-level assessment
In this section, we describe the main results from the country-level analyses of the EU as an example. The EU
has been treated as a “country” in this context because the European Commission submitted one INDC to the
UNFCCC on behalf of all its member states. Similar analysis will be available for Brazil, China, India, Indonesia,
Japan, Russia and the USA in an upcoming report. Unless mentioned otherwise, emission trajectories (historic,
current policies and INDC levels) shown in this chapter are from the Climate Action Tracker (2015) which in
turn takes its data from various authoritative sources.
4.2.1 Country-level assessment example: EU
The largest contributors to potential emission reductions beyond INDC levels in the EU are given by the Euro-
pean Wind Initiative and the Solar Europe Industry Initiative. Both are EU-only initiatives; the former aims for
a share of wind energy of 20% (33%) by 2020 (2030) of the EU’s total electricity generation, compared to 12%
(19%) under the IEA’s New Policies Scenario (NPS); the latter aims for a share of solar energy of up to 12%
(20%) in electricity generation by 2020 (2030), compared to 4% (12%) under the NPS. This translates to a large
potential for further decarbonisation of the power sector, with impacts of in the order of hundreds of mega-
tons of CO2 per year (Figure 4-3). Similar impacts could be attained by energy efficiency measures in the build-
ings sector.
Other initiatives that contribute are those of the many C40 cities and Under2MOU signatories in the EU, many
of which have set emission reduction targets below a base year that turn out more ambitious than the EU’s
overall target of achieving at least 40% by 2030 below 1990 levels, under the assumption that the implemen-
tation of all such targets would follow a linear trajectory between base year and target year. The potential
impact by 2030 is furthermore increased by the ambition of SEAD (thermal energy in buildings), UIC (modal
shift to public transport), ULCOS (enhanced steelmaking technologies) and CCAC (reduction of short-lived cli-
mate pollutants). Notably, the full impact of CCAC in the EU is achieved by the reduction of CH4 emissions, as
targets for HFC reduction do not go beyond current EU regulation on fluorinated gases.
Overlaps between initiatives are illustrated by two cases: the lower values indicate highest possible overlaps
between initiatives, and the higher values indicate complete additionality of all initiatives (Figure 4-3). This
figure includes only those initiatives whose potential was estimated to go beyond the INDC baseline. For in-
stance, we estimate the impact of the CCAC sub-initiatives on CH4 and HFC emission reductions by 2020 to be
less than the reductions under the baseline by 2020 (which is why no CCAC impact is shown in the left-hand
chart), but more than the reductions under the baseline by 2030.
13Evaluation of the impact of global, regional and national initiatives outside UNFCCC on GHG emissions – Discussion Paper
Figure 4-3 Potential impact of initiatives in the EU in 2020 and 2030
Fores- Cities & Renewable Indus- Fores- Cities & Renewable Indus-
try regions Buildings Transport electricity try Non-CO2 try regions Buildings Transport electricity try Non-CO2
Bonn Challenge / NYD
Bonn Challenge / NYD
Under 2 MOU
Under 2 MOU
ULCOS
ULCOS
GBPN
CCAC
GBPN
SEAD
CCAC
SEAD
GFEI
GMI
GFEI
EWI
GMI
C40
EWI
UIC
SEII
C40
UIC
SEII
0
50
Emission reductions (MtCO2e/a)
100
150
200
250
300
350
400
(a) 2020 min max (b) 2030 min max
Note: Potential impact (compared to INDC levels) of initiatives in the EU up to 2020 (a) and 2030 (b), with
minimum numbers assuming largest possible overlap with other initiatives, maximum values indicat-
ing complete additionality of all initiatives. If a “minimum” bar is zero whereas the “maximum” bar is
not, this indicates that the initiative has a potential impact on emission reduction beyond INDC levels,
but could be overlapped completely by (an)other initiative(s).
Source: Author’s own illustration
The emission reduction from the initiatives are aggregated into overall economy-wide emission reductions
and compared to historical and future projection trends of emissions in the EU from all sectors (Figure 4-4).
EU’s emissions (excluding forestry) could roughly be cut in half by 2030 compared to current levels if the initi-
atives deliver according to their ambition. Similarly, the inset to Figure 4-4 shows reduction potential in the
LULUCF sector.
Graphs with potential reductions excl. LULUCF for all countries are included in Figure 4-5 (please note the non-
uniform vertical scale between the different graphs). For Indonesia, we have included the LULUCF graph in an
inset, as it is the only country where this represents the major share of potential initiative reductions. Full
details on the assessments in the other seven countries analysed will be available in a future report, as will full
descriptions on the calculations involved.
Importantly, large-scale initiatives in the power sector only appear in the EU and the US in our analysis, where
their potential impact is significant. We note here that this reflects a lack of comparable initiatives in the other
countries, not necessarily an unambitious INDC in the EU and US, nor that other countries have more ambi-
tious INDCs. It is merely a manifestation of the fact that we are not aware of similar initiatives in other countries
that fall outside of what is covered in INDCs, and of the fact that these power sector initiatives themselves
have set very ambitious targets for the EU and US.
14Evaluation of the impact of global, regional and national initiatives outside UNFCCC on GHG emissions – Discussion Paper
Figure 4-4 Emission levels for the EU under Current Policies, INDC and initiatives' potential
6000
5000
Emissions excl. LULUCF (MtCO2e/a)
4000
-250
LULUCF emissions
3000
(MtCO2e/a)
-300
-350
2000
-400
1990 2010 2030
1000 LULUCF
historical average
0
1985 1990 1995 2000 2005 2010 2015 2020 2025 2030 2035
Year
CP min CP max INDC initiatives min initiatives max
Note: Emission levels excl. LULUCF in the EU historically, under current policies (CP, excluding INDCs), INDC
levels, and under the initiatives’ reduction potential (initiatives min/max). Inset: LULUCF emission re-
movals, historical data (plus historical average, taken as baseline) and potential reductions from initia-
tives.
Source: Author’s own calculations (initiatives), Climate Action Tracker (2015) (current policies, INDCs)
4.2.2 Initiatives analysed globally
The initiatives not scaled down to a country level include three business initiatives (Caring for Climate, the
American Business Acts on Climate Pledge (ABAOCP), and RE100) and the Global Alliance for Clean Cookstoves
(GACC). The former have not been scaled down due to a lack of data to know which emissions reduction should
be counted in which country. The latter has not been taken along due to the fact that its impacts are assumed
to be highest in countries outside of the analysed sample of eight.
Furthermore, due to the fact that non-CO2 gases account for a large share of the emission reductions of im-
proved cookstoves (Lee et al. 2013), the overlap between reductions from CCAC and the Global Alliance for
Clean Cookstoves is best calculated on the worldwide level.
15Evaluation of the impact of global, regional and national initiatives outside UNFCCC on GHG emissions – Discussion Paper
4.3 Aggregation to global level
In the last step of this analysis, we have aggregated the country-level impacts with all overlaps taken into
account back to a worldwide level, thus resulting in an overall potential impact including overlaps that could
be compared to current policy (including INDC) projections on the global level.
In order to re-aggregate an initiative back to a global level, we had to make an estimation of the contribution
of the initiative to the “rest of the world” (i.e. outside of the eight countries analysed in detail). Thus, the global
numbers calculated here are:
o Higher than the sum of the initiatives’ contributions in each of the eight countries plus the worldwide-
only initiatives, as it involves an estimation of the contribution to the rest of the world that has not
been explicitly used anywhere else;
o Lower than the sum of the initiatives’ contributions to the potential overall impact, since no overlaps
were taken into account in that analysis.
Since the country-level analyses include not only an assessment of the overlaps between initiatives within and
across sectors, but also of the overlap with INDCs – either by comparison to INDC scenarios (OECD & IEA 2015,
New Policies Scenario) or by explicit comparison to quantified goals stated in a country’s INDC – these globally
aggregated numbers together represent the contribution, assuming full implementation, of these initiatives
to global emission projections in addition to what would be expected under successful implementation of
INDCs.
In Figure 4-6, we plot these aggregated contributions in 2020 and 2030 along with historic data of worldwide
impact and future projections under current policies (i.e. without INDC levels) and under projections
assuming full implementation of INDCs (Climate Action Tracker 2015). We have also compared these potential
reduction levels with those required for a pathway consistent with limiting temperature rise to maximum 2°C
above pre-industrial levels. It can be seen that the maximum contribution of these initiatives (i.e. under the
most opti-mistic assumptions of emission reductions and assuming the initiatives are maximally additional to
each other) would just fall short of reaching the median of the 2°C pathways. Figure 4-6 also shows how
the individual initiatives are expected to contribute by 2030.
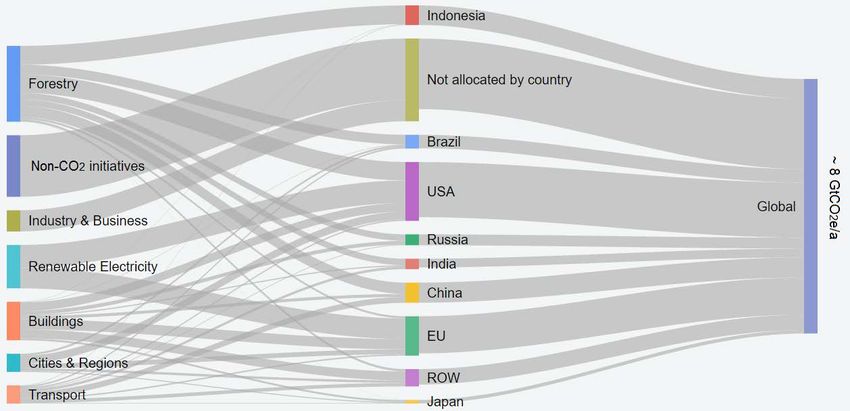
To clarify the flow of calculations by which we arrive at this worldwide impact, in Figure 4-7 we show a
Sankey diagram to explain this. It details how the calculation flow goes from the “potential impact” numbers
(on the left, here divided by thematic area for ease of reading) to the country-level disaggregation, where
overlaps are calculated between initiatives and with INDCs (middle, showing how the “outflow” – rep-
resenting reductions after overlaps – are smaller than “inflow”), and finally to the global-level impact aggre-
gated back from a country-level. Numbers presented in this graph refer to the 2030 impact.
16Evaluation of the impact of global, regional and national initiatives outside UNFCCC on GHG emissions – Discussion Paper
Figure 4-5 Overview of potential emissions reduction from initiatives in each country
EU USA
6000 8000
7000
5000
Emissions excl. LULUCF (MtCO2e/a)
Emissions excl. LULUCF (MtCO2e/a)
6000
4000
5000
3000 4000
3000
2000
2000
1000
1000
0 0
2000 2005 2010 2015 2020 2025 2030 2000 2005 2010 2015 2020 2025 2030
Year Year
CP min CP max INDC initiatives min initiatives max CP INDC 2025 INDC 2030 (CAT extrapolation) initiatives min initiatives max
China India
16000 6000
14000
5000
Emissions excl. LULUCF (MtCO2e/a)
Emissions excl. LULUCF (MtCO2e/a)
12000
4000
10000
8000 3000
6000
2000
4000
1000
2000
0 0
2000 2005 2010 2015 2020 2025 2030 2000 2005 2010 2015 2020 2025 2030
Year Year
CP min CP max INDC initiatives min initiatives max CP min CP max INDC initiatives min initiatives max
Indonesia Brazil
1600 1400
1000
LULUCF emissions
(MtCO2e/a)
1400 1200
500
Emissions excl. LULUCF (MtCO2e/a)
Emissions excl. LULUCF (MtCO2e/a)
1200
1000
1000 0
2000 2010 2020 2030 800
LULUCF (national BAU), peat fires averaged
800 LULUCF (national BAU) incl. peat fires
600
600
400
400
200 200
0 0
2000 2005 2010 2015 2020 2025 2030 2000 2005 2010 2015 2020 2025 2030
Year Year
CP INDC 2020 INDC 2030 initiatives min initiatives max CP INDC 2025 INDC 2030 initiatives min initiatives max
Russia Japan
3500 1600
3000 1400
Emissions excl. LULUCF (MtCO2e/a)
Emissions excl. LULUCF (MtCO2e/a)
1200
2500
1000
2000
800
1500
600
1000
400
500 200
0 0
2000 2005 2010 2015 2020 2025 2030 2000 2005 2010 2015 2020 2025 2030
Year Year
CP min CP max INDC initiatives min initiatives max CP min CP max INDC initiatives min initiatives max
Note: Initiative’s potential reductions in the EU, USA, China, India, Indonesia, Brazil, Russia and Japan. Emis-
sions excl. LULUCF; inset for Indonesia presents LULUCF historical data and potential reductions.
Source: Author’s own calculations (initiatives), Climate Action Tracker (2015) (current policies, INDCs)
17Evaluation of the impact of global, regional and national initiatives outside UNFCCC on GHG emissions – Discussion Paper
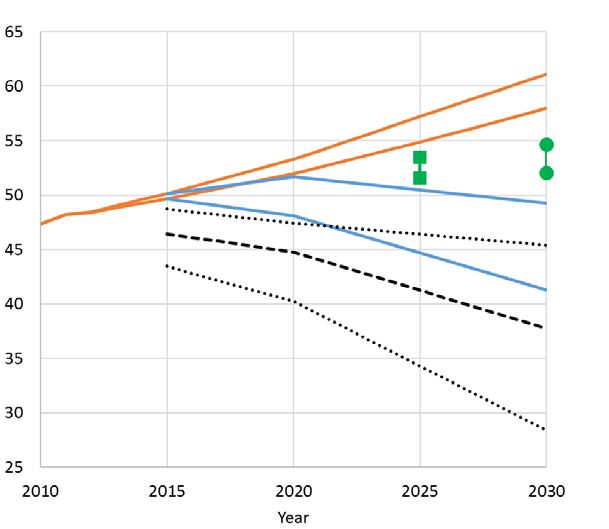
Figure 4-6 Global emission (incl. LULUCF) and emissions reduction from initiatives
Renewable
electricity
Transport
8 GtCO2e
Buildings
Cities &
regions
Forestry
Non-CO2
Industry &
business
Note: Global emission levels incl. LULUCF (historic, future under current policies, and future under INDC lev-
els) along with the potential overachievement of INDC levels by the analysed initiatives scaled up to
the global level. The dashed (dotted) lines indicate the median (10th/90th percentile values) of global
2°C compatible pathways (CAT, 2015). Right: Disaggregation of the contribution of initiatives overa-
chieving INDCs by initiative in 2030 (average number shown). The two CCAC sub-initiatives we ana-
lysed (on HFC and CH4 reduction, respectively) have been grouped together under “CCAC”. Initiatives
with less than 10 MtCO2 expected contribution (ABAOCP and ULCOS) are not in the legend as they are
not visible in the graph.
Source: Author’s own calculations (initiatives), Climate Action Tracker (2015) (current policies, INDCs)
18Evaluation of the impact of global, regional and national initiatives outside UNFCCC on GHG emissions – Discussion Paper
Figure 4-7 Flow of emissions reduction from initiatives per sector and per country
Note: Sankey diagram showing the calculation flow from global potential impact per sector (left) to country-
level disaggregation (right) to global calculations. “ROW” = Rest of World; “Not allocated by country”
refers to the initiatives analysed solely on the global level, or for which the overlap calculations were
only done on the global level (CCAC and GMI). The numbers that flow “into” a country represent the
average potential impact (i.e. without overlap between initiatives) compared to INDC levels. The num-
bers that flow “out” of a country represent what would be left over if the average level of overlapping
is assumed. In this graph all information refers to 2030 impacts.
Source: Author’s own calculations
5 Good practice analysis
In addition to the quantitative assessment, we also analyse potential qualitative contributions of initiatives.
These are grouped into indirect impacts on GHG emissions (e.g. informational diffusion, political effects, tech-
nology development), co-benefits (e.g. air pollution, health impacts, energy security, economic development)
and whether an initiative directly causes emission reductions through projects on the ground.
Both the quantitative and the qualitative assessment then provide the basis for a good practice analysis. The
goal of the good practice analysis is to find overarching success factors, i.e. characteristics of initiatives that
tend to lead to large emission reductions and/or high qualitative contributions. The characteristics assessed
are topic area, geographical coverage, type of initiative, functions, type of member organizations and the ex-
istence of a permanent secretariat.
For each characteristic, we then calculate the correlation (correlation coefficients r) with quantitative and
qualitative impact indicators, as well as the means of the impact indicators under different characteristics. As
quantitative impact indicators, we use the global potential impact in 2020 and 2030, both absolute and relative
to the total emissions covered by an initiative, as well as the achieved emission reductions to date. As qualita-
tive impact indicators, we use the number of indirect impacts by an initiative, the number of co-benefits, and
whether an initiative directly causes emission reductions. Finally, we derive success factors and good practice
initiatives.
19Evaluation of the impact of global, regional and national initiatives outside UNFCCC on GHG emissions – Discussion Paper
It is important to note that the number of initiatives with a target allowing for quantification in section 4 is too
low for a solid statistical analysis. Therefore, while the results presented in this section are descriptive of this
set of initiatives, they do not apply to climate initiatives in general.
5.1 Results
We start the analysis by comparing the quantitative impact by topic area. Figure 5-1 shows the mean of the
relative global potential impact of all initiatives in a certain topic area.
Figure 5-1 Mean of relative global potential impact by topic area
Source: Author’s own calculation
We find that forestry initiatives have the highest impact in 2030. Forestry is not comprehensively included as
a mitigation option in INDCs (Zeleke et al. 2016) and existing targets suffer from a lack of clarity (Petersen, K.
& Varela, J. 2015). Therefore, initiatives play an important role in this topic area and their targets easily surpass
national policies and INDCs. Further, we see that city initiatives have a large impact in 2020, but the impact in
2030 is much smaller. This indicates that most cities set rather ambitious short-term targets, but are more
hesitant with long-term commitments.
Another interesting finding concerns the role of business members. Figure 5-2 shows the quantitative impact
in 2030 in relation to the share of business members for each initiative. The left figure shows the absolute
impact in MtCO2e and the right figure shows the relative impact as a share of the covered emissions of the
initiative in percent. Each point represents one initiative. Furthermore, the figures show a linear fit to the data
points and the corresponding correlation coefficient r.
20Evaluation of the impact of global, regional and national initiatives outside UNFCCC on GHG emissions – Discussion Paper
Figure 5-2 Absolute and relative impact of initiatives in 2030 and their share of business members
Source: Author’s own calculation
We find that initiatives with a high share of business members tend to be smaller, in terms of total emissions
covered, than other initiatives, but have a similar relative impact. Further, analogous analyses reveal that those
initiatives tend to more directly cause emission reductions than other initiatives, and that those initiatives are
also associated with indirect impacts on emissions, mainly through technology development.
We have performed similar analyses for all characteristics mentioned at the beginning of this section. Many
characteristics showed no apparent connection to the quantitative and/or qualitative impact of an initiative,
notably geographical coverage and the type of an initiative (e.g. implementation, political or technical dia-
logue, intergovernmental process). However, some further success factors can be derived:
The first success factor is the presence of NGOs. We find that NGO-led initiatives tend to have a high relative
impact both in 2020 and 2030 (r = 50% (2020), 37% (2030)). Further, initiatives with a high share of NGO mem-
bers tend to have large co-benefits (r = 21%, highest correlation among member organization types), mainly
health impacts and biodiversity.
Additionally, we find that voluntary agreements tend to have a high relative impact in 2020 (r = 58%, highest
correlation of all initiative functions). However, the connection is less strong, but still positive, for 2030
(r = 22%).
Finally, we find that a permanent secretariat may support a high impact of an initiative. The existence of a
secretariat comes with above-average absolute and relative impact in 2020 and 2030, and with already
achieved emission reductions. It also indicates more indirect impacts and more co-benefits. However, the dis-
claimer is especially important for this characteristic: only four of the initiatives in our quantified sample have
a permanent secretariat.
21Evaluation of the impact of global, regional and national initiatives outside UNFCCC on GHG emissions – Discussion Paper
5.2 Good Practice Initiatives
In this section, we describe three good practice initiatives, which we have derived from the set of quantified
initiatives. These three initiatives combine high impact with several of the success factors developed in the
previous section.
The first good practice initiative is the combination of the Bonn Challenge and the New York Declaration on
Forests, calling for the restoration of 150 million hectares of deforested and degraded lands by 2020, and an
additional 200 million hectares by 2030. We estimate the potential impact of the initiative to be between 250
MtCO2e and 680 MtCO2e in 2020 and between 1.2 GtCO2e and 3.2 GtCO2e in 2030. The initiative covers an
area, forestry, which is underrepresented in INDCs (Zeleke et al. 2016). It further covers a wide range of coun-
tries and is therefore a truly global initiative. In addition, it has a permanent secretariat and is based on volun-
tary agreements. Finally, the website of the Bonn Challenge 6 provides detailed descriptions of their activities,
an own estimation of their impact, and provides guidance for potential new members.
Second, the Global Fuel Economy Initiative (GFEI) aims to halve the fuel consumption of the light-duty vehicle
fleet in 2050 compared to 2005 (in litres of gasoline equivalent per 100 km). In the short-term, the initiative
targets a halving of fuel consumption for new cars by 2030. The potential impact is estimated at roughly 160
MtCO2e in 2020 and 360 MtCO2e in 2030. As a transport initiative, the GFEI has considerable co-benefits,
mainly in the reduction of air pollution and the associated health impacts. Further, the initiative also has a
permanent secretariat and substantial NGO involvement. Finally, as a research and awareness raising initiative
it nicely targets the long-term shift needed in the transport sector.
Third, the member companies of the RE100 initiative commit to 100% renewable electricity by a certain target
year. We estimate the potential impact at between 17 MtCO2e and 34 MtCO2e in 2020 and between 24
MtCO2e and 50 MtCO2e in 2030. The RE100 initiative is a collection of voluntary agreements by businesses
and led by an NGO, The Climate Group. As a renewable electricity initiative, it also causes large co-benefits in
air pollution and energy security. The relative impact of the initiative is quite high, estimated at 77% in 2030.
Finally, the initiative is very transparent on its targets and achievements, as the website provides concrete
targets and current data for almost all member companies.
6 International initiatives and the UNFCCC
In December 2015 Parties adopted the Paris Agreement at the 21st session of the UNFCCC. In its Article 2
governments agreed to limit global warming to “well below 2°C above pre-industrial levels” and to pursue to
limit it to 1.5°C (UNFCCC 2015). The UNEP Emissions Gap Report 2015 showed that a gap of 14 GtCO2e exists
for 2030 between the mitigation proposals submitted by Parties as part of their INDCs and a pathway compat-
ible with holding temperature increase below 2°C (UNEP 2015b). Based upon the outcome of the quantitative
assessment undertaken in section 4, it is clear that international initiatives have the potential to help support
the mitigation efforts of national governments.
Given the potential of international initiatives to support and enhance the mitigation efforts of national gov-
ernments, the Paris Agreement specifically refers to their role within the UNFCCC framework. Decision 1/CP.21
which adopts the Paris Agreement includes a section on non-party stakeholders (refer to paragraphs 118-120
and 134-137), ‘welcoming’ their efforts to address and respond to climate change (UNFCCC 2015). The Paris
Agreement ‘invites’ non-party stakeholders to scale up their abatement efforts and demonstrate their activi-
ties via the Non-State Actor Zone for Climate Action Platform (UNFCCC 2015).
6 http://www.bonnchallenge.org/
22You can also read