Carbon Calculators for Transport and Electricity - Welsh Video Network
←
→
Page content transcription
If your browser does not render page correctly, please read the page content below
Carbon Calculators
             for Transport and Electricity
                             Geoff Constable
                             21 February 2011

This report looks at online calculators for measuring CO2 emissions caused by
   transport. It also examines publicly available figures for calculating CO 2
       emissions produced by the consumption of electricity in the UK.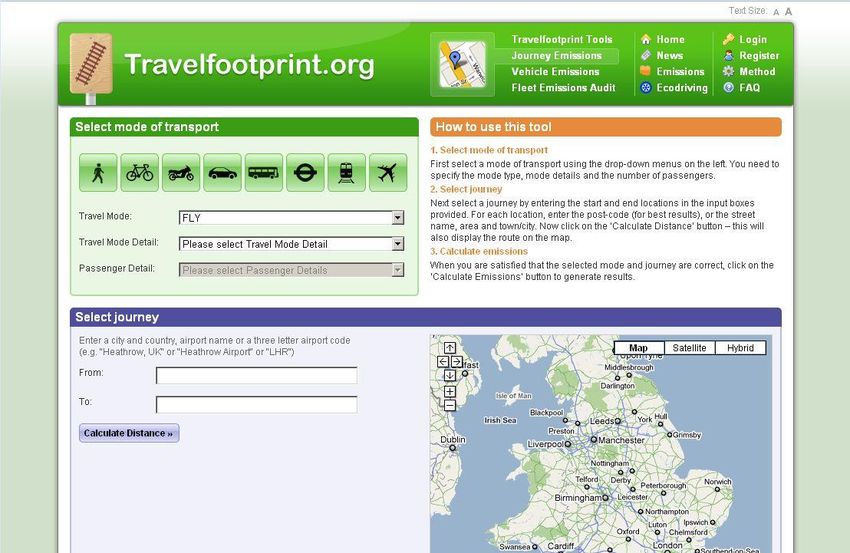
Welsh Video Network
Carbon Calculators for Transport and Electricity

                          This page has been left blank intentionally

Page 2 of 36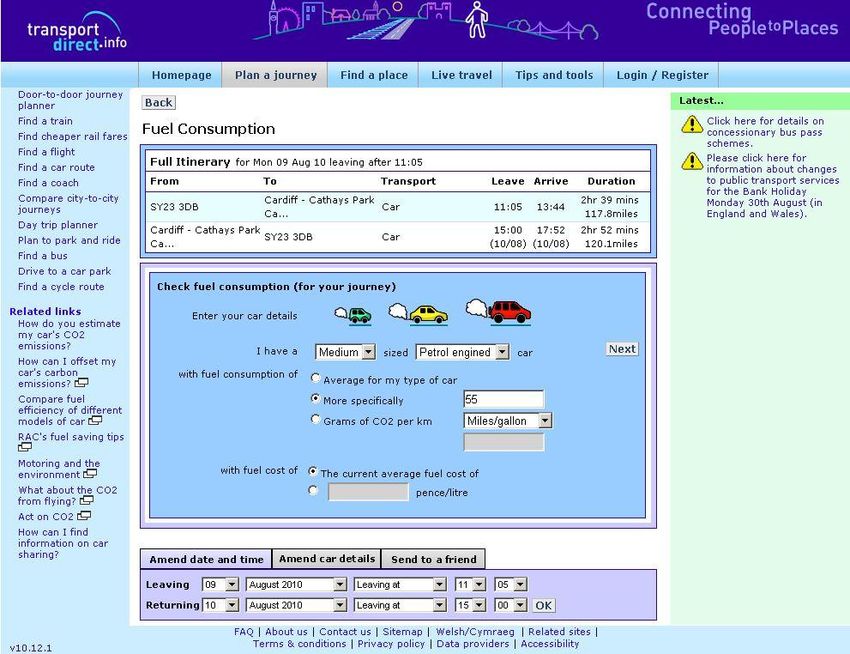
Welsh Video Network
                                                          Carbon Calculators for Transport and Electricity

Table of Contents
Executive Summary ......................................................................................... 5
Acknowledgements .......................................................................................... 6
Introduction ...................................................................................................... 6
1. Transport Calculators from the UK Government ....................................... 8
   Defra/DECC ................................................................................................. 8
   Act on CO2 ................................................................................................. 10
2. Converters and Calculators from the European Union ............................ 10
3. Charity / Not for profit travel calculators .................................................. 11
   The Carbon Trust ....................................................................................... 11
   World Wide Fund for Nature (wwf-uk) ........................................................ 11
   Car CO2 and cost calculator ....................................................................... 12
   Transport Direct.......................................................................................... 13
   Travel South Yorkshire ............................................................................... 16
   Travel Footprint .......................................................................................... 18
   Others ........................................................................................................ 19
4. Videoconferencing Manufacturers ........................................................... 19
   Sony ........................................................................................................... 20
   TANDBERG ............................................................................................... 21
   PolyCom ..................................................................................................... 22
   Lifesize ....................................................................................................... 22
5. Videoconferencing Resellers ................................................................... 22
   Direct Visual ............................................................................................... 23
   ProAV ......................................................................................................... 23
   Mvision ....................................................................................................... 23
   JKC ............................................................................................................ 24
6. Other Carbon Calculators ........................................................................ 24
   Carbon Footprint ........................................................................................ 24
7. Travel Calculators – Conclusions for the Project ..................................... 24
8. CO2 Emissions from Electricity Consumption .......................................... 25
9. UK Government Sources ........................................................................ 26
   Defra .......................................................................................................... 26
   DECC ......................................................................................................... 26
   Other Sources ............................................................................................ 27
10. Electricity Generation Companies ........................................................ 28
   E.ON .......................................................................................................... 28
   ScottishPower ............................................................................................ 28
   EDF Energy ................................................................................................ 29
   SWALEC .................................................................................................... 29
   npower ....................................................................................................... 29
   Ecotricity ..................................................................................................... 29
   green energy uk ......................................................................................... 30
11. Conclusions ......................................................................................... 30
12. Summary Tables .................................................................................. 31
   Table1. A comparison of results from different CO2 travel calculators ....... 31
   Table 2. CO2 emissions per kWh of electricity generated .......................... 32
13. References ........................................................................................... 32

                                                                                                     Page 3 of 36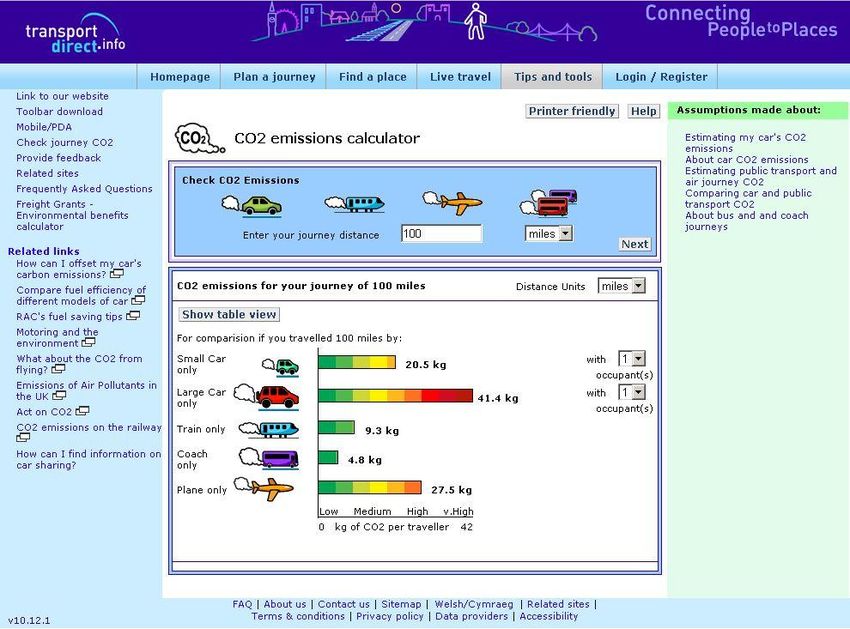
Welsh Video Network
Carbon Calculators for Transport and Electricity

                          This page has been left blank intentionally

Page 4 of 36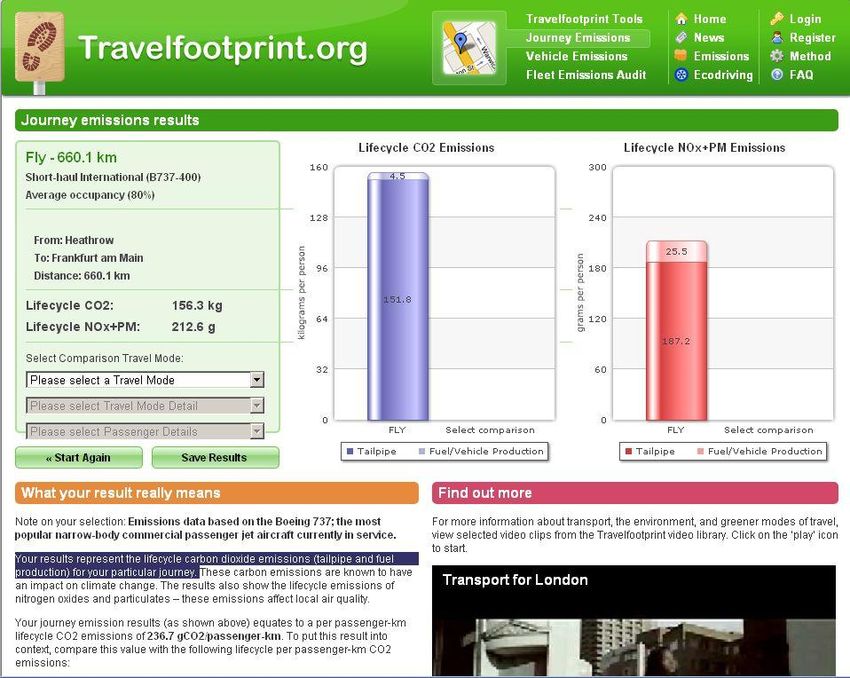
Welsh Video Network
                                           Carbon Calculators for Transport and Electricity

Carbon Calculators for Transport and Electricity

Executive Summary
The report deals with two crucial aspects of the „How Green Was My
Videoconference?‟ (HGWMV) project. When evaluating the contribution that
videoconferencing can make to savings in an organisation‟s carbon footprint, there
are two factors to consider. The first is the carbon and GreenHouse Gases (GHGs)
that would have been emitted by cars and other forms of transport during journeys
that the videoconference has replaced. The second is the carbon costs of the power
consumption of the videoconferencing equipment. For the purposes of calculating the
savings in CO2 made by not travelling, the project needs access to reliable figures.
This report looks at the verifiable published figures that are available online in order
to make these calculations.

In order to aid calculations later in the project, when actual meetings are evaluated, it
would be very useful to have a reliable carbon calculator to take the manual work out
of making the calculations of carbon saved by not travelling. To this end a number of
carbon calculators and journey calculators available online are considered in the first
part of this report. In order to keep the work relevant to the emissions from cars in the
United Kingdom (UK) and also the legislative/cost framework within the UK, it is
mainly carbon calculators available and produced in the UK that are considered.

The evaluation of the journey/carbon calculators considers the publishing
organisation and the amount of information supplied regarding the sources for the
calculations made. The ease-of-use and relevance to the needs of the project are
also considered, as is the usefulness and accuracy of the calculators compared to
various authoritative (but not necessarily infallible) benchmarks such as the
Department for the Environment and Rural Affairs (Defra) and the Vehicle
Certification Agency.

Online carbon calculators from public sector sources are considered as well as those
from videoconferencing manufacturers and resellers. A representative sample is
visited rather than an exhaustive trail through all of the possible sources here. The
point of this review of calculators from the relevant private sector is that the
manufacturers and resellers use the fact that videoconferencing is seen as a „Green
technology‟ extensively to promote sales, but it was uncertain to what extent they
were providing clear and transparent accurate information on calculating the actual
contribution videoconferencing can make towards reducing an organisation‟s carbon
footprint. In fact they provide less hard facts than was originally expected.

The second part of this report examines the published data from Defra, the
Department of the Environment and Climate Change (DECC), and the major
electricity generation and distribution companies on the amount of carbon and other
GHG produced by consuming their power services. This is published in their fuel
disclosure information, which they have a legislative duty to make public. The
information is of interest to all consumers who wish to be more informed about their
own carbon footprint, and is of relevance to this project as organisations may emit
more or less carbon per unit of electricity consumed according to the company they
use to purchase their electricity.

                                                                              Page 5 of 36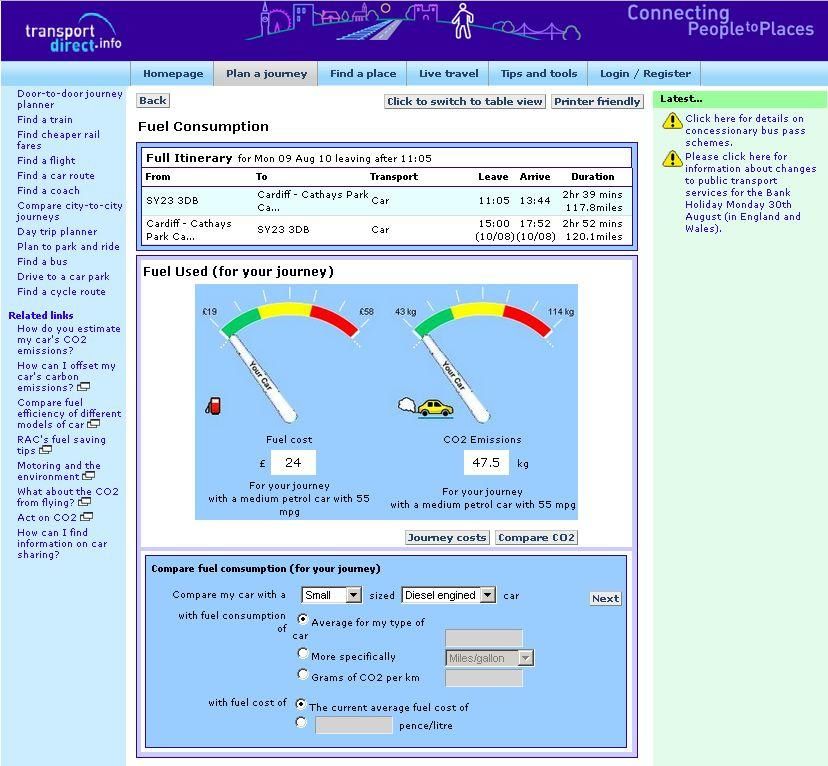
Welsh Video Network
Carbon Calculators for Transport and Electricity
The fuel disclosure figures of a number of major (and „green‟) energy providers are
presented and the extent of the information published, and its ease of access, is also
evaluated, albeit subjectively.
The conclusions of the report are that some journey planners and carbon calculators
are more reliable than others in their transparency and relation to the „official‟ figures,
which are governed by EU legislation. In general (but not exclusively) those that
appear more extensive and easier to verify are those provided by public sector
initiatives. Information from manufacturers and resellers is often vague and
generalised, and without transparent references to the source of the calculations
presented.
Information on electricity consumption is presented by all the relevant companies (as
it has to be in order to comply with legislation), but how easy it is to find the
information varies considerably, as does the extent of accompanying contextual and
explanatory information. This information should be of use to the HGWMV project if
the electricity supplier of the organisations hosting videoconferencing equipment can
be ascertained.
Acknowledgements
I would like to acknowledge the assistance and help of Professor Peter James of the
Suste-IT project, Emma Cook of Ecotricity (The Renewable Energy Company
Limited) and Jesse Goodman of the European Environment Agency. Thanks also to
Alun Jones of Information Services, Aberystwyth University.
Introduction
The HGWMV project is examining, in detail, the GHG emissions produced by the
generation of electricity to power videoconferencing equipment, and the Carbon
Dioxide (CO2) emissions that might be saved by using videoconferencing as an
alternative to travelling to meetings. In order to select accurate figures for analysing
actual videoconferences, this report surveys a number of sources for calculating CO2
emissions produced by car and plane journeys, as well as figures for electricity
generation provided by the government and private generating companies. This
report also surveys some of the „CO2 calculators‟ hosted on videoconferencing
industry web sites.
The motivations for surveying this information were:
to find a verifiable, accurate and reliable conversion figure for the ratio of
electricity used to CO2 released into the atmosphere;
to see whether this figure would vary according to the supplier of the
electricity (assuming a normal fuel mix and no „green tariff‟);
to find a verifiable, accurate and reliable source for conversion between miles
travelled in cars of various kinds and CO2 released into the atmosphere;
to find if there were any calculators in existence that could be utilised to make
these conversions;
to ascertain the accuracy of the travel CO2 calculators available online;
to ascertain the degree of agreement between such calculators; and
to make the findings available to the wider community.
Page 6 of 36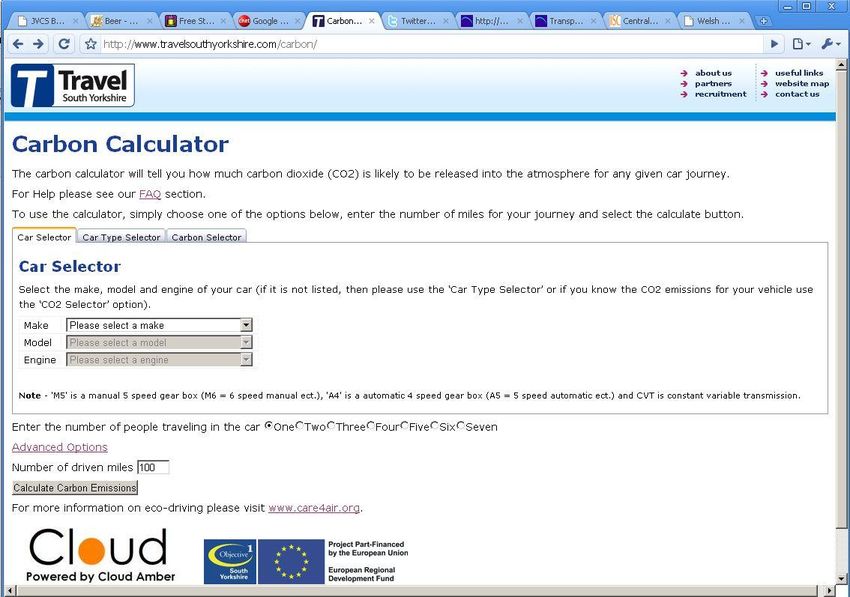
Welsh Video Network
Carbon Calculators for Transport and Electricity
For the aims of this project, it is necessary to look at the published figures available
from online sources in order to make valid judgements regarding the amounts of
GHGs in general, and CO2 in particular, generated by travel.
As the project moves forward, this will help with making accurate judgements on CO2
emissions associated with videoconferencing and travelling.
Regarding the CO2 and other GHGs produced by our consumption of electricity, it is
again useful to try to find a consensus amongst those who publish conversion factors
and „carbon calculators‟. This will help in an accurate analysis of the CO2 „costs‟ of
operating videoconferencing equipment.
The findings are being released as a report in the hope that this survey will also be of
interest to others working in the videoconferencing and „Green ICT‟ area. Given the
publicity, it is likely that the comparative information supplied by the electricity
industry, and the differing ways that the information is provided, will be of interest to
the general consumer and anyone with an interest in global warming and its
prevention.
CO2 is one of a number of GHGs that are released into the atmosphere by burning
petrol and diesel and generating electricity; others include methane (CH4) and nitrous
oxide (N20). These are often measured by using a carbon dioxide equivalent (CO2eq)
measure that represents the potential global warming factors of all these GHGs.
This document represents an attempt to see if there is agreement or consensus on
multipliers/conversion figures for CO2 and/or CO2eq amongst those that publish such
figures. The HGWMV project is particularly interested in conversion figures for car
and air travel, and also for electricity consumption.
This exercise is not exhaustive, and the reader may know of other sources of this
information. Another factor to remember when doing this research is that every
company and country has a different mix of power generation methods, and different
types of national grids supplying the electricity, so the research has been confined to
the UK. Also, organisations that are powering videoconferencing equipment may not
be using the „typical‟ power mix represented by a standard tariff, and may have opted
for a „green‟ tariff, where a higher than typical proportion of their electricity is
produced using renewable sources, such as wind power, and thus the carbon
footprint of their videoconferencing facilities may not be as high as what is seen here.
Throughout this document, for consistency, conversion factors will be expressed as
kilograms (kg) of CO2 released per mile travelled (kg/mile) for car and air travel.
Where these are presented as kilograms per kilometer, the per mile figure will be
calculated and entered in brackets. Where the figures quoted are less than 1kg, the
figures will be presented in grams (g). For electricity consumption the measurement
will be kilograms or grams of CO2 per kiloWatt hour (kWh1).
In order to relate the figures to concrete examples of travel in the UK, four example
journeys have been selected. The example journeys that will be applied to all
calculators are:
Aberystwyth to Cardiff and return by car (220 miles)
Cardiff to Edinburgh and return by car (786 miles)
Cardiff to Edinburgh and return by air (630 miles)
1
Please see Section 7 for a definition of the kiloWatt hour (kWh).
Page 7 of 36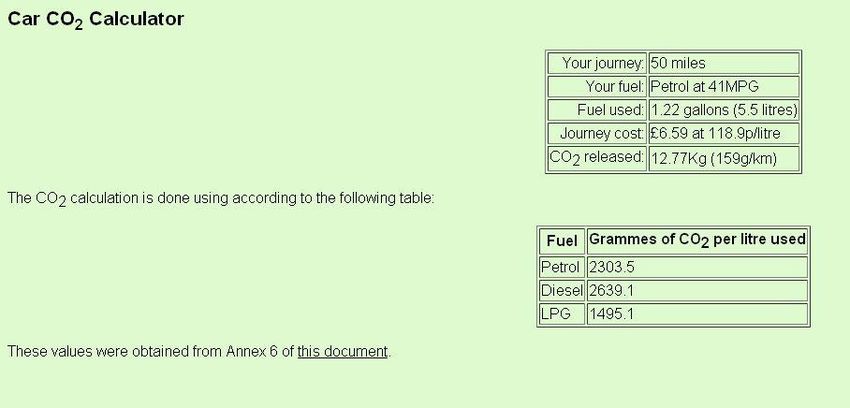
Welsh Video Network
Carbon Calculators for Transport and Electricity
Heathrow to Frankfurt and return by air (812 miles)
It will be assumed that the car journey is made in a petrol-driven 1.4 litre car. This
type of vehicle has been chosen to create demonstrator figures. The choice is quite
arbitrary and is based on what appears to be popular amongst colleagues, although it
will result in a comparatively conservative GHG emission figure compared to a larger
petrol engine.
These example journeys are all journeys that might be made by academics and other
University staff during the course of their work. Throughout this report UK distances
are calculated from www.theaa.com, and flight distances are calculated from
www.webflyer.com.
The research for this report was carried out between July and November 2010 and
all urls and website addresses were correct at that time.
1. Transport Calculators from the UK Government
Defra/DECC
Defra and DECC publish an annual summary of conversion factors as a basis for
calculations involving electricity production and consumption, and transport.
These conversion factors are available in the annually published report:
“Guidelines to Defra / DECC‟s GHG Conversion Factors for Company Reporting”.
The 2009 edition of this report is available from:
http://www.defra.gov.uk/environment/business/reporting/pdf/20090928-guidelines-
ghg-conversion-factors.pdf
During the course of preparing this report an updated version for 2010 was released
and can be found at:
http://www.defra.gov.uk/environment/business/reporting/pdf/100805-guidelines-ghg-
conversion-factors.pdf
The 2009 figures have been applied in the preparation of this document and have not
yet been updated. The report is recommended to anyone interested in the subject
and is the definitive UK Government source for reporting figures for UK organisations
and businesses. However, it is very detailed, and some of the more relevant and
salient figures are reproduced here.
Air travel – Defra‟s guidelines contain the conversion factors for air travel. There are
many caveats around the averages listed in the Defra conversion factors. For
example, the actual figures will vary according to the type of aircraft, the total load,
the cabin class, and the route taken. The figures used are, in general, averages. As
well as the known GHG emissions, other emissions from aircraft may affect climate
change. These include the high altitude release of water vapour and the aircraft‟s
concentration trail. Taking all factors into consideration, it is suggested that an
additional multiplier of 1.9 be applied to calculate the true climate change effects of
aviation. This has not been applied in the calculations in this report. For full details
see the Defra guidelines.
Page 8 of 36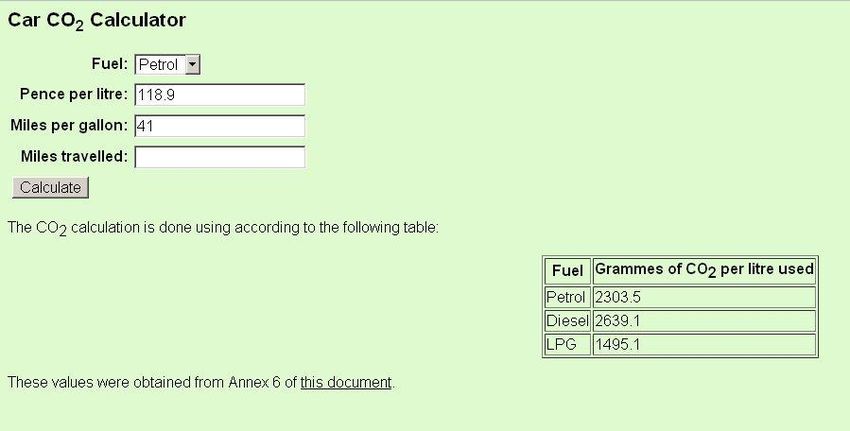
Welsh Video Network
                                                           Carbon Calculators for Transport and Electricity

Of interest here are the conversion factors for domestic and short haul flights. For
domestic air travel the converter is 0.17283 kg GHG/km (0.27814 kg GHG/mile); and
for short haul flights: 0.09924 kg GHG/km (0.15784kg/mile). These figures are per
passenger, and not per flight, and without the multiplier applied. For CO2 alone the
figures are: domestic flights per passenger: 0.17102 kg/km (0.27523 kg/mile); short-
haul international: 0.09826 kg/km (0.15813 kg/mile)2

Rail travel – The per passenger figure for national rail in the UK is 0.06113 kg
GHG/km (0.098379 kg GHG/mile) and the European (Eurostar) figure is 0.01777 kg
GHG/km (0.028598 kg GHG/mile).

Car travel – the amount varies according to the size of engine and the fuel used, as
follows:

Petrol                                               kg GHG/mile                             kg CO2/mile
Up to 1.4 litre engine                                 0.29290                                 0.28944
1.4 – 2.0 litre engine                                 0.34590                                 0.34246
Over 2.0 litre engine                                  0.47897                                 0.47555
Average petrol car                                     0 .33445                                0.33100
Diesel
Up to 1.7 litre engine                                  0.24586                                 0.24293
1.7 – 2.0 litre engine                                  0.30480                                 0.30187
Over 2.0 litre engine                                   0.41460                                 0.41167
Average diesel car                                      0.31921                                 0.31627

There is no information in the Defra figures regarding the addition of extra
passengers. The weight of additional passengers would be expected to increase fuel
consumption slightly, but also reduces the CO2 emitted on a per passenger basis.
Other factors that may affect fuel consumption include: driving style; tyre inflation and
regular servicing and maintenance; weight of baggage or equipment, and so on.

Regarding driving style, a piece of anecdotal evidence illustrates the difference that
driving style can make to petrol consumption. In a completely unscientific, but
illustrative, experiment, a colleague drove from his home to a nearby town, 30 miles
away. On the outbound journey he drove as economically as possible, being very
light on the accelerator and changing gear as suggested by the car‟s computer, while
still at low revs. On the return journey he adopted an aggressive driving style, driving
fast, braking hard and reaching high revs before changing up through the gears. The
on-board computer reported 78 miles per gallon (mpg) for the outbound journey and
38 mpg for the return – nearly double the fuel consumption. The car used for this
experiment was an Audi A4 2.0Tdi 143. The combined (urban and extra urban) fuel
consumption figure for this vehicle (as listed at VCAcarfueldata.org.uk) is 49.6 mpg. It
should also be noted that the car‟s computer may not be completely accurate;
however, the general consensus is that driving style can have a great effect on fuel
consumption, and there are various guides to „green driving‟ available. A guide to
lessening the environmental impact of one‟s driving style can be found at:
http://www.vcacarfueldata.org.uk/information/hints-for-less-environmental-
damage.asp .

Using Defra‟s figures, the car and air journeys being used as examples would emit
GHGs as follows:

2
  The Defra guidelines state that“ domestic flights are between UK airports, short haul international flights are
typically to Europe (up to 3700km distance), and long haul international flights are typically to non-European
destinations (or all other international flights over 3700km distance).

                                                                                                        Page 9 of 36
Welsh Video Network
Carbon Calculators for Transport and Electricity
Journey GHG emissions (kg)
Aberystwyth to Cardiff return by car (220 miles) 64.438
Cardiff to Edinburgh return by car (786 miles) 230.219
Cardiff to Edinburgh return by air (630 miles) 175.228
Heathrow to Frankfurt return by air (812 miles) 129.607
Act on CO2
For specific makes and models of cars, the Act on CO2 web site, sponsored by the
UK Government, has the following calculators:
a tool that finds the fuel emissions of any current new car
a tool that finds the 10 cars with the lowest emissions in a particular class of
car
a tool that calculates the emissions of any make/model of car since the year
2000
a tool that lists used cars within a selected range of CO2 emissions.
These can all be found at:
http://actonco2.direct.gov.uk/home/what-you-can-do/On-the-move/Compare-car-
CO2-emissions.html
The figures used are those supplied by the UK Government‟s Vehicle Certification
Agency. Information on their vehicle testing, which generates the figures used at the
Act on CO2 website, can be found at: http://www.vcacarfueldata.org.uk/ . This is the
UK‟s official source for car fuel consumption and exhaust emissions figures.
Additionally, it is possible to find the CO2 emissions of a particular vehicle if you know
the registration number. This is available, along with other information on the car, at:
http://www.taxdisc.direct.gov.uk/EvlPortalApp/?SKIN=directgov
Select Vehicle Enquiry, fill in the form for Vehicle Registration Mark and select
Vehicle Make from the drop down box.
2. Converters and Calculators from the European
Union
The European Union has various resources available online for analysing the impact
of travel and electricity consumption.
The European Environment Agency (http://www.eea.europa.eu/) produces a great
deal of information on progress towards reducing GHG emissions but it was difficult
to find explicit information on conversion between travel and electricity production
and GHG emissions.
The EEA (in an e-mail) suggested the “Greenhouse Gas Equivalencies Calculator”
available at:
Page 10 of 36Welsh Video Network
Carbon Calculators for Transport and Electricity
http://www.epa.gov/cleanenergy/energy-resources/calculator.html
This looks as though it has the potential to be a useful tool, although it was not
explored in detail as it is a US based resource.
3. Charity / Not for profit travel calculators
The Carbon Trust
The Carbon trust is a UK not-for-profit organisation with the mission to accelerate the
move to a low carbon economy. It publishes a guide called “Greenhouse gas
conversion factors”, which is available at:
http://www.carbontrust.co.uk/publications/pages/publicationdetail.aspx?id=CTL085
This is based on Defra‟s data, but provides a simpler, more accessible summary. The
air flight figures given by the Carbon Trust are slightly higher due to their taking
account of delays/circling at airports and non-direct flight paths.
The Carbon Trust also offers a Carbon Calculator. This is aimed at organisations and
quantifies carbon footprint using energy consumption on site, as well as
organisational and employee travel. Calculations are for the organisation on an
annual basis.
World Wide Fund for Nature (wwf-uk)
“If all European companies cut their business travel by 20% it would save 22 million
tonnes of CO2, equivalent to taking one third of the UK‟s cars off the road.”3
The WWF is a strong advocate of replacing travel with videoconferencing4 and is
promoting a „one-in-five‟ challenge to businesses to reduce their business travel by
20% in five years as a significant contribution to reducing CO2 emissions. They have
sponsored research on this subject and assert that “Companies that use
videoconferencing can reduce their need to travel by up to 30%, saving millions per
year in avoided travel.” This research can be accessed at:
http://wwf.panda.org/about_our_earth/all_publications/ict/ .
Their carbon calculator is at: http://footprint.wwf.org.uk/, but is not suitable for single
journey calculations.
3
Pamlin, D and Szomolanyi, K (2006) Saving the Climate @ the Speed of Light. WWF and Enso,
Brussels
4
See http://assets.wwf.org.uk/downloads/business_travel_ps_0709.pdf for example.
Page 11 of 36Welsh Video Network Carbon Calculators for Transport and Electricity Car CO2 and cost calculator As an experiment, a colleague at Aberystwyth University has produced a fuel cost and CO2 emissions calculator based on the figures in the Defra conversion factors document mentioned earlier. This has a very simple interface and allows users to adjust the cost of the fuel and the mpg to their own circumstances. It returns the amount of fuel used for the journey, the cost in UK pounds and the amount of CO2 emitted by the journey. Unlike some calculators that just apply a constant based on a notional average, the CO2 result is calculated according to the fuel economy of the car according to the data entered by the user. The calculator can be found at: http://users.aber.ac.uk/auj/fuel.php . Figure1: The Car CO2 Calculator with defaults that can be edited Figure 2. The Car CO2 Calculator results page Page 12 of 36
Welsh Video Network
Carbon Calculators for Transport and Electricity
This calculator was developed as an experiment to see just how complex, or simple,
the development of such a tool is. In fact this calculator took about two hours to
develop from scratch, suggesting that to produce a reliable and accurate calculator
does not involve a large amount of resource or effort for a skilled programmer.
Transport Direct
“Transport Direct works together with both public and private travel operators and
local/national government. Transport Direct is operated by a consortium, led by Atos
Origin. The non-profit service is funded by the UK Department for Transport (DoT),
the Welsh Assembly Government (WAG) and the Scottish Government.” (from the
www.transportdirect.info web site).
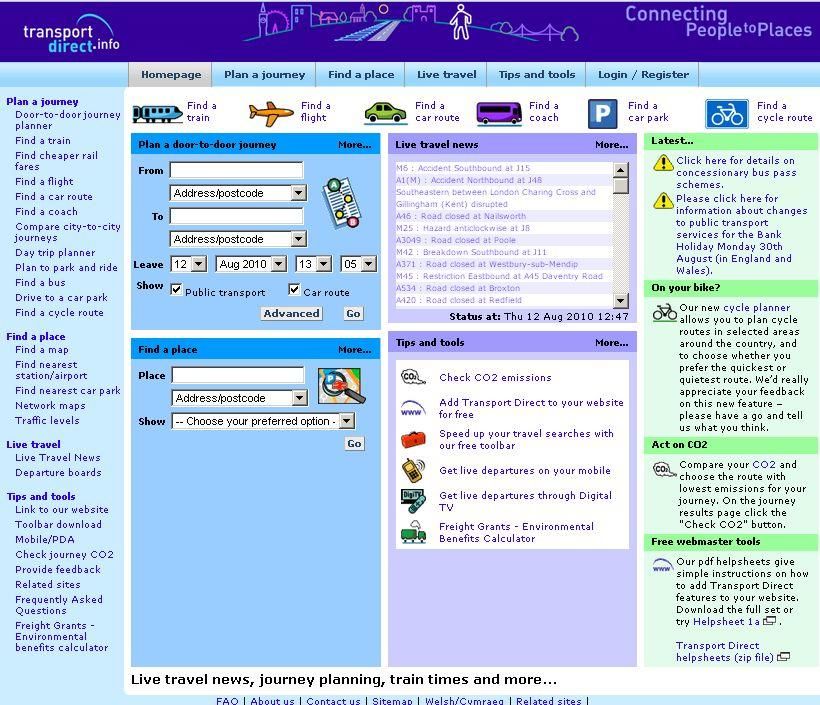
Figure 3. The Transport Direct home page with simple calculator tool
A comprehensive UK travel site, which helps plan and compare car and public
transport journeys, Transport Direct also offers the means to calculate and compare
CO2 emissions from doing the same journey by different modes of transport.
There are notes regarding how the calculations are made, and also the assumptions
made regarding different car engine sizes and their fuel consumption. For public
transport the site uses Defra conversion factors, but refers to the RAC‟s vehicle
running costs tables (April 2008) for mpg figures.
Page 13 of 36Welsh Video Network Carbon Calculators for Transport and Electricity There is a comparatively simple comparison calculator, which can be reached in one click from the home page, or at: http://www.transportdirect.info/Web2/JourneyPlanning/JourneyEmissionsCompare.as px The results can be compared for 100 miles: Transport.direct Defra Up to 1.2 litre – 20.5 kg Up to 1.4 litre - 26.423 kg 1.8 ltr – 3 litre – 41.4 kg Above 2 litre – 47.555 kg This calculator seems to be broadly in line with Defra‟s figures, although it is unclear why they have not used the Defra figures for their calculator, as they have done with the public transport comparisons. Figure 4. Results of the Transport Direct calculator Transport Direct also has a journey planner, which offers a far more sophisticated level of tuning to your own individual circumstances, for more accurate results. This can be accessed from the “Plan a journey” link on the web site. The “door-to-door journey planner” calculates routes and distances between postcodes (or other location indicators) and produces a route for the journey. Using advanced options it will also calculate the CO2 consumed for the journey based on assumptions regarding engine sizes, or fuel consumption data that the user can enter. Page 14 of 36
Welsh Video Network
                                          Carbon Calculators for Transport and Electricity

Figure 5. Transport Direct‟s door-to-door planner

This is the most sophisticated carbon calculator for the UK found during this
research. The results are also in accordance with those in Alun Jones‟ calculator
(see Table 1)

                                                                           Page 15 of 36
Welsh Video Network Carbon Calculators for Transport and Electricity Figure 6. Presentation of CO2 results, Transport Direct door-to-door journey planner Travel South Yorkshire “Travel South Yorkshire represents the organisations and operators that work in partnership to provide public transport products and services throughout the region.” This web site offers a very complete, but simple, interactive calculator. It does require you to use another source to calculate the journey distance, but this can easily be done by visiting the AA or a similar route planner web site. http://www.travelsouthyorkshire.com/carbon/ Users can input their exact car and the journey distance and the calculator does the rest. Page 16 of 36
Welsh Video Network
Carbon Calculators for Transport and Electricity
Figure 7. Travel South Yorkshire journey carbon calculator
The web site does answer the question “How Accurate is this site?” in its FAQ
section and the answer is “The raw CO2 figures are taken from the VCA Car Fuel
Data database site. This data comes from the manufacturer's published CO2 ratings
for their car. The figure is the average amount CO2 generated in g/km. Various
factors will increase or decrease this. Some of the larger factors are listed on the
calculation page. So, is the site accurate? The answer is yes, as much as the site
can be, but if you were to measure the CO2 you produced on your journey, would it
be the same as the number generated here? Probably not, but it would be close.”
The alternative to entering the precise make and model is to enter the car type, or the
exact published CO2 emissions in g/km. If the car is post-2000, these figures are
available at www.VCAcarfueldata.co.uk, but this is what the calculator uses so there
is no need to look them up.
Advanced options allow the user to indicate the engine temperature at the start of the
journey, the type of driving (urban/mixed/”highway”) and any fuels that are
alternatives to petrol or diesel.
Results are presented with some comparisons. The Aberystwyth – Cardiff (return)
journey has this results summary for example:
Each person on the journey would emit 52.54 kilograms of carbon into the
atmosphere. That is equivalent to
flying in a plane a distance of 72.24 miles
operating your computer for 1681.30 hours
the production of 262.70 plastic bags
the production of 105.08 plastic bottles
Page 17 of 36Welsh Video Network
Carbon Calculators for Transport and Electricity
the production of 17.50 American cheeseburgers!!
Public transport could reduce each person‟s emissions by 30.54 kilograms of carbon
dioxide.
Travel Footprint
Travel Footprint Limited and the Travelfootprint online tool are owned by the Clear
Zones Partnership via the London Borough of Camden with the online tool funded by
Transport for London and Defra. The Clear Zones Partnership (CZP) includes
Camden Council, the City of Westminster and the City of London.
The travel footprint carbon calculation tool is simple to use and again, transparent in
its sources and workings. There is a link to the calculator on the home page, or the
direct link to the journey emissions calculator is:
http://www.travelfootprint.org/journey_emissions/
Figure 8. Travel Footprint emissions calculator – data entry page
The user selects a mode of transport and the journey and the tool calculates the
emissions. When a car journey is chosen, the interface does not allow you to select
the exact car (as with the Travel South Yorkshire site), but it is possible to match the
car type from a large list of suggested car types. This calculator gives the distance of
the journey (unlike the South Yorkshire site), and then calculates the emissions. This
calculator differs from others in the fact that it addresses and includes the emissions
generated by the life-cycle of the vehicle (manufacture, assembly and disposal) and
also the fuel (primary production, extraction, transportation, refining, and vehicle
operation). The methodology is explained in detail on the „method‟ link at the site,
and the impact of travel on the environment is assessed and explained in the
emissions link. The site also has a wealth of information, links and references on
”eco-driving”, making it a valuable resource for those who wish to reduce their travel
and its impact.
Page 18 of 36Welsh Video Network
Carbon Calculators for Transport and Electricity
Figure 9. Travel Footprint emissions calculator – results page
The site gives a very detailed and well-presented summary of emissions for the
journey. The site offers similar journey impact calculators for flight, public transport,
walking and cycling.
Others
There are more carbon calculators available in the UK that have been developed and
made available by not-for-profit organisations, but the selection above offers a
representative sample and include some sites that will be suitable for analysing CO2
journeys to be examined in later stages of this project. Summary information of the
CO2 emissions suggested by these different sites for the sample journeys identified
in the introduction to this report can be found in the tables in Section 11.
4. Videoconferencing Manufacturers
Videoconferencing manufacturers are keen to extol the green virtues of the
technology they sell, and this was one of the factors that led to the idea of the
HGWMV project. Cynics may think that by emphasising the benefits of
videoconferencing as a green technology (because of the reduced CO2 emissions of
videoconferencing compared to travel), the manufacturers are simply exploiting a
marketing opportunity. Others may think that they are moved by a genuine belief in
their products‟ potential to help the global warming crisis.
Page 19 of 36Welsh Video Network Carbon Calculators for Transport and Electricity What is of interest to this project and this report in particular is whether or not the manufacturers and resellers of videoconferencing products are giving an accurate description of the „green‟ benefits of their products. Does their assessment include the negative impact of the manufacture, distribution, use, support and disposal of their products for example, or take into account any travel to the videoconferencing location? Where the manufacturers give illustrative examples, or calculation tools, they should be accurate as possible (and it appears that it only takes a good programmer a few hours to produce a calculator that is based on objectively produced government guidelines). The following sections review some of the pertinent information available at each of the major videoconferencing manufacturers‟ sites, seen during the period of research (July – September 2010). Sony Sony no longer sells videoconferencing equipment in Europe (at the time of writing, only one desktop system was shown on its UK web site), but it does still sell such equipment in other areas of the world. The Sony web site provides a simple rule of thumb for conversion in its document „Making the case: carbon footprint calculator‟ available at: http://www.sony.co.uk/res/attachment/file/18/1218032887618.pdf “It‟s easy to calculate your CO2 emissions while travelling. Simply multiply your journey distance in miles/kilometres by 0.5/0.31 when driving or 0.6/0.37 when flying to calculate how many pounds (lbs) of CO2 emissions you are creating based on general assumptions.” 0.5 lbs/mile equates to a multiplier of 1.1 when converted to kg/mile – assuming 1 kg = 2.2 lbs. So the Sony figure is 1.1 kg CO2 per passenger air mile. This appears to be high when compared to the Defra conversion factor (of 0.099 kg GHG per mile, even allowing for the multiplier for air travel impact), and so may exaggerate the undoubted reduction in CO2 emissions of using videoconferencing rather than flying. Sony also gives examples of car and plane journeys in the UK. These are “Calculations based on driving a 5 door Volkswagen Golf 1.4 at 40 miles per gallon (MPG), with one gallon of gas (sic)5 producing 20 pounds of CO2. “ This equates to one gallon of petrol producing 9.07184 kg of CO2; i.e. 4.546 litres of petrol producing just over 9 kg of CO2. This is approximately 2.0 kg of CO2 per litre of fuel. Defra‟s figure for a petrol car is 2.305 kg CO2 and 2.3307 kg of total GHG per litre of fuel, so if anything, this figure is comparatively conservative. www.VCAcarfueldata.org.uk gives the VW Golf (August 2009) 45.6 mpg (combined driving conditions). CO2 emissions are calculated at 286.6 g/mile. 40 miles would therefore produce 11.464 kg of CO2, and this equates to 25.2 lbs. Again, this appears to make the estimate by Sony fairly in agreement with the UK Government‟s data, and again a slightly conservative estimate (i.e. they have understated the amount of emissions that would really be caused by this Golf travelling for 40 miles according to “official” figures). 5 It is assumed that this gallon of „gas‟ refers to a UK gallon of petrol, as this document is made available on a UK web site. Page 20 of 36
Welsh Video Network
                                             Carbon Calculators for Transport and Electricity

For cars in general Sony applies a rule of thumb of 2 miles = 1 lb CO2. This actually
equates to 0.226796 kg CO2 per mile travelled. Again this is lower than the Defra
figures given above.

In summary the Sony calculation advice seems quite fair as far as car travel is
concerned, but seems to exaggerate the CO2 release of air travel slightly. The
sources for their calculations are not provided.

For comparison with the sample journeys used for illustrative purposes in this report,
here are some illustrative figures given by Sony:

Journey                                                         GHG Emissions (kg)
Manchester to Southampton by car (223 miles)                          52.5
Manchester to Southampton x 3.5 by car (779 miles)                   183.75
London to Madrid by air (782 miles)                                  213.5
London to Madrid x 3 by air (2349 miles)                             640.5

As can be seen, these figures are broadly in agreement with those calculated from
the Defra figures (see Table 1 for comparison).

TANDBERG

TANDBERG (now part of Cisco) hosts a web site dedicated to marketing the green
credentials of videoconferencing at: www.seegreennow.com. Amongst other things,
this site offers a commuter costs calculator in which you enter the cost of a litre of
petrol, the fuel efficiency of your car in mpg, and the distance of your commute. The
calculator returns a table indicating the costs per week/month/year of your commute
in financial terms, and in terms of CO2 released.

On testing this calculator it was discovered that the fuel efficiency field only affects
the outcome of the weekly/monthly/annual financial calculation. The carbon
emissions totals appear to use the same conversion factor whatever figures are
entered in the other three fields. Thus the same carbon emission results were
obtained when using fuel efficiency figures from the Seat Leon (1.2 TSI 105PS
Ecomotive, petrol, with Stop-Start Manual 5-gear – CO2: 124 g/km) or the
Lamborghini Murcielago 147 roadster (petrol, manual 6-gear, CO2: 495 g/km).

By comparing other data to the output of the calculator, as well as some
experimentation, it was found that the calculator multiplies the figure entered for
distance by five in order to calculate the cost per week. Assuming it does the same
thing to calculate the CO2 emissions, the figure of 6.2 lbs for a weekly commute of 10
miles is equal to 2.81 kg per ten miles. This equates to 0.281 kg/mile, against the
Defra figure of 0.331 kg/mile. In kilometres, the figures are: TANDBERG calculator:
0.175 kg/km; Defra: 0.20567 kg/km. In fact, the TANDBERG figures show a lower
rate of CO2 than the average car, and are pitched at very near the level of the Defra
figures for cars that are 1.4 litre or less (0.28944 kg/mile or 0.20567 kg/km).

The commuter calculator does not vary the conversion factor for CO2 emissions
according to the fuel efficiency of the car, but applies the same calculation to the
distance travelled to produce the CO2 figure. This means the figure produced is not
necessarily an accurate one and does not reflect individual situations as well as it
might.

                                                                              Page 21 of 36
Welsh Video Network Carbon Calculators for Transport and Electricity It is also rather unintuitive to use – once you have selected „pounds‟ as your currency all calculations are in imperial, so you need to enter the cost of fuel in pounds per gallon and fuel efficiency in miles per gallon. These points have been passed on to TANDBERG UK, but as yet no response has been received. PolyCom PolyCom offer carbon reduction consultancy services and also a Return On Investment (ROI) calculator that includes some information on carbon emissions, but it is not a journey calculator, and is not suitable for calculating emissions for particular journeys. http://www.polycom.com/products/resources/roi/en_roi_green.html They also offer a link to „video-miles‟ – software produced by a company to track an organisation‟s CO2 savings by replacing travel with videoconferencing, but no journey calculator as such. The „video-miles‟ software was not investigated further for the purposes of this report. Lifesize Lifesize (the third largest manufacturer of videoconferencing systems in the UK in terms of sales, according to the Wainhouse Research bulletin, and now part of the Logitech Company) has a section of its web site dedicated to the green benefits of videoconferencing with its products (“Reduce Travel Costs and CO2”). They do not have a calculator, but do offer examples of how flights can produce CO2 by giving figures for example flights. The example flight between Frankfurt and London shows a saving of 0.85 metric tons of CO2 for the round trip. This flight is a distance of 812 miles or 1,306 km (Frankfurt International to London, Heathrow). When the Defra conversion factor for international short haul flights (0.09365) is applied to this distance, the CO2 emissions are 122.4 kg (0.124 metric tons). The figure given by Lifesize therefore appears to be overstated when compared to the Defra figures. The figure is six times the Defra conversion factor applied to the same journey, so allowing for a multiplier for the GHG effects of aviation emissions, this still appears to be high. The page is at: http://www.lifesize.com/Gallery_and_Resources/Our_Green_Approach/Reduce_Trav el_Costs_and_CO2.aspx Other than this Lifesize offers no calculator. 5. Videoconferencing Resellers There are many videoconferencing resellers and a large number of UK web sites were visited for signs of links to reducing CO2 by using videoconferencing to replace travel. Perhaps surprisingly, there was not much to be found. Most sites just feature the products that they sell, and often include case-studies of their customers. Compared to the manufacturers, the resellers do not seem to see the „Green‟ Page 22 of 36
Welsh Video Network
                                           Carbon Calculators for Transport and Electricity

aspects of videoconferencing as a marketing opportunity, or as a driver for increased
sales.

Any resellers that offer a carbon (or GHG) calculator that is not included here are
welcome to contact the author before the end of the project (April 2011) for inclusion
in this report. For the time being a representative sample of resellers‟ web sites was
surveyed. Those that had no „Green‟ section to their web site have been left out of
this limited summary.

Direct Visual

Direct Visual offers a “Go Green” section on their web site. There is more information
at this reseller‟s site on the potential for videoconferencing to reduce an
organisation‟s carbon footprint, than at any other reseller visited. Resources include a
case study, some statistics on the potential for business to reduce carbon emissions,
a waste disposal scheme and information on Direct Visual‟s own policies. There is a
link to an external carbon calculator, but, at the time of this research, the link was
broken.

ProAV

ProAV has a section on “What are the ecological benefits of AV Technology?” This
includes a costs and carbon calculator, but as far as the calculations are concerned,
they have a limited degree of accuracy as they do not specify international airports
for example, simply countries. A return journey from the UK to Germany is estimated
to be 1,860 miles (2,993 km). The CO2 emitted is estimated at 558 lb or (254 kg of
CO2). Applying the Defra international short haul CO2 conversion figure to this gives
280 kg, which places the ProAV calculator‟s conversion figure slightly lower than
Defra‟s.

A return journey from Heathrow to Cologne is 1062 km (660 miles). When Defra‟s
short haul flight figure for CO2 emissions per km (0.09365) is applied to this figure the
result is 99.5 kg CO2. However, Edinburgh to Munich return is 2660 km (1,652 miles),
indicating 154kg of CO2. So, taken on the example of a flight from the UK to
Germany (departure and destination unspecified) the ProAV calculator does appear
to take a „worst case scenario‟ in estimating the distance travelled. In fact, distances
from various parts of the UK (including Aberdeen and Belfast) to various destinations
in Germany (including Berlin and Munich) were tried, but no UK - Germany return
journey of over 1800 miles could be found. This unusual distance calculation does
tend to inflate the CO2 emissions figure (as well as the time and costs estimations).

The page does have a disclaimer stating that “Costs per country and total costs are
approximate and should be used only as a guide” and indicates that the conversion
factor for CO2 is 0.3 lbs per mile. Reversing this calculation indicates that the ProAV
calculator is using a figure of 0.085048 kg/km (0.136 kg/mile).

Mvision

Mvision also has a “Go Green” section, but it links mainly to TANDBERG resources.

                                                                            Page 23 of 36
Welsh Video Network Carbon Calculators for Transport and Electricity JKC JKC mentions the opportunities for reducing CO2 emissions by including a page that mentions this - http://www.jkcit.co.uk/helpingyougogreen.htm 6. Other Carbon Calculators Carbon Footprint Based at www.carbonfootprint.com, this UK-based company offers consultancy, carbon footprint measuring and carbon footprint management services, which it calls “carbon management consultancy services”. It offers the means for individuals and companies to calculate their carbon footprint using online tools and then to offset their carbon consumption using validated methods. They offer a free carbon calculator that can be embedded in a web site simply by cutting and pasting a short piece of html from their web site. This was tested and proved extremely easy to implement, but the resultant calculator does include a link to the company‟s web site. It is unusual (in a commercial calculator) for listing all of the sources for the figures that they use in their calculations, which include VCA and Defra figures. Once the carbon footprint calculator had been downloaded and embedded, a test flight was used in the flight calculator – London, Heathrow to Frankfurt, Germany. The calculator has the option of using the Defra multiplier of 1.9 to include the overall effects of aviation. It calculated 0.14 tonnes of CO2 for this flight. This equates to 140 kg. Given that the distance is 1,306 km, the calculation is the same as was done for the Lifesize example above (Lifesize suggest that the CO2 emitted on a flight between London and Frankfurt is 0.85 metric tons), which gave 0.122 metric tons (or tonnes). It is not clear from the calculator whether the Defra figures are used to calculate the CO2 emissions from flights (or some other agency - a number are listed). However, this is a reasonably accurate representation compared to some of the others that are available. The carbon footprint calculator is for calculating an individual‟s or organisation‟s footprint over a year or other time period. It does not offer a mechanism for measuring the impact of individual car journeys or kWh of electricity consumed. 7. Travel Calculators – Conclusions for the Project The first six sections of this report have concentrated on finding a reliable and accurate means of calculating CO2 emissions from travel, which can be used to produce figures and metrics for the HGWMV project. Having a reliable carbon calculator will save time and effort, and give a degree of assurance regarding accuracy of the figures obtained for the amount of CO2 saved by not taking a particular journey. The conclusion must be that there is such a degree of variance in the figures available that there is no single calculator that can be taken as providing a definitive figure. The Defra figures have been used as a yard-stick and have some authority and respect for their accuracy and objectivity, but these are averaged Page 24 of 36
Welsh Video Network
                                           Carbon Calculators for Transport and Electricity

figures based on car types (below 1.4 litres for example). The most accurate
representation is to use the actual figures from the VCA Car Fuel data web site for
the particular car that would be used for the journey and to use the average figures
for that car. Because these are based on independently verified European Union
tests, it can only be hoped that they promise some degree of accuracy.

The only calculator site that uses these figures alone and is based on particular cars
is the Travel South Yorkshire site, so this would appear to be most accurate and
suitable for the HGWMV project to use.

8. CO2 Emissions from Electricity Consumption
Having identified useful figures and a useable calculator for the calculation of CO2
saved by not travelling on a particular journey, the project also needs to be able to
use accurate and reliable figures for calculating the power use of videoconferencing
equipment – this is part of the „carbon cost‟ of a videoconference that we need to set
against any „carbon savings‟ achieved by not travelling.

In order to calculate as accurately as possible this carbon cost, the project needs to
establish the CO2 emissions caused by the electrical consumption of
videoconferencing equipment while in use (and in stand-by). This will, in turn, help in
the calculation of the total Lifecycle Carbon Assessment of videoconferencing
equipment to be explored in a subsequent report by this project. The following
sections of this report therefore examine the public information available in the UK for
calculating the CO2 emissions per unit of electricity consumed.

CO2 and GHG emissions from electricity generation are usually expressed in
kg/kWh.

“The kilowatt hour, or kilowatt-hour, (symbol kW·h, kW h) is a unit of energy equal to
1000 watt hours or 3.6 megajoules. Energy in watt hours is
the multiplication of power in watts and time in hours. The kilowatt hour is most
commonly known as a billing unit for energy delivered to consumers by electric
utilities. Example: A heater, rated at 1000 watts (1 kilowatt), operating for one hour
uses one kilowatt hour (equivalent to 3,600 kilojoules) of energy.

Source: www.wikipedia.org.
In the following sections of this report, the definitive figures as laid down by the UK
government are recorded. Additionally, some of the main energy suppliers‟ web sites
were researched to see if they offered any information on CO2 emissions per unit of
electricity produced/consumed. Again, this was a brief survey of a representative (not
exhaustive) selection of the most well-known providers, plus a few of the lesser
known specialist renewable energy generators.

                                                                            Page 25 of 36
Welsh Video Network Carbon Calculators for Transport and Electricity 9. UK Government Sources Defra As mentioned in the transport section above, Defra publishes an annual summary of conversion factors as a basis for calculations involving electricity production and consumption (and transport). The figure for the total GHGs in 2007 (the latest published) for consumed electricity is: 0.54418 kg/kWh. This is slightly higher than the figure for CO2 emissions alone (0.54055 kg/Kwh) as it includes other GHGs. This figure does not include the electricity lost in the process of transporting the electricity along the national grid to the location of consumption of the electricity. It also ignores the energy cost of transporting coal or other raw materials to the place where the electricity is generated. These figures are those most commonly used, and are used (for example) on UK Government web sites. They are the recommended conversion figures from Defra. They are calculated “Based on UK Greenhouse Gas Inventory for 2007 (AEA) according to the amount of CO2, CH4 and N2O emitted from major power stations per unit of electricity consumed from the BERR's Digest of UK Energy Statistics (DUKES) 2008 Table 5.6, available at: http://www.berr.gov.uk/whatwedo/energy/statistics/publications/dukes/page45537.ht ml “ DECC DECC compiles figures on electricity generation that are quoted in the industry. All producers of electricity, and other energy suppliers, are bound by law to disclose information regarding electricity production and its environmental impact. This information may be used as part of promotional material supplied to the customer. It is an issue of compliance that some of this information is made available to the consumer. It is of interest here because the grams of CO2 produced by running a videoconferencing studio may vary considerably according to the particular supplier of electricity to that studio. It is hoped that institutions will make public the electricity producer that they use to purchase their electricity, so that calculations of carbon footprint can be made according to the location of (and electricity supplier for) the videoconferencing equipment. As can be seen by the figures below (summarised in table 2), these can vary considerably according to the fuel mix that is used by the supplier to generate their electricity. These figures are of interest to all electricity consumers (business and domestic) that are concerned to reduce the carbon footprint of their activities. The aggregate data for all electricity production is summarised in the “Fuel Mix Disclosure Table” published on the DECC web site. This gives the following figures: Page 26 of 36
Welsh Video Network
                                            Carbon Calculators for Transport and Electricity

Carbon dioxide emissions

Energy source                                    g/kWh

Coal                                              870
Natural Gas                                       370
Nuclear                                             0
Renewables                                          0
Other                                             630

Overall average                                   410

Although nuclear power does not produce any CO2 emissions, it does have an
environmental impact in the form of radioactive waste. DECC gives a figure for high-
level radioactive waste of 0.010 g/kWh of electricity consumed from nuclear sources.

Full details and associated regulations and guidelines are available at:
http://www.decc.gov.uk/en/content/cms/statistics/fuel_mix/fuel_mix.aspx

Interestingly, the figure in grams given for electricity production in this table (compiled
from information from the suppliers) is significantly different from that of 540 g/kWh
given in the Defra conversion document. This is compiled in a different way and this
may account for the apparent anomaly.

Clarification was sought from Defra on this matter and the following response was
received:
“There are discrepancies in both sources of data. The emissions factor figure is
based on generation efficiencies from DUKES data and using these and the
corresponding gas and coal emissions factors give significantly higher emissions
factors per kWh electricity generated for gas (416 g/kWh vs the figure of 370 quoted
in the table). Not only that but the fuel mix disclosure table quotes figures per unit
generation, so does not include the around 7-7.5% losses that are taken into account
in the conversion factors figure quoted for comparison. The overall average grid mix
figure is also a combination of the amounts generated and this has likely also
changed since the table was compiled.”
(E-mail received from Policy Adviser - Corporate Reporting & Responsible
Investment, Sustainable Business and Resource Efficiency, Defra)

Other Sources

Pricewaterhouse Coopers, a global auditing and consulting company, has published
a Europe-wide study into CO2 emissions from electricity production. It surveys the
period 2001 – 2007 and examines the CO2 emissions of the major generation
companies in Europe during that period. The report is called “Climate Change and
Electricity” and can be found at:
http://www.pwc.fr/assets/files/pdf/2008/12/pwc_carbon_factor_2008_uk.pdf .

The EEA (European Environment Agency) also plans to publish information on
electricity companies‟ CO2 emissions later in 2010. This should be available from:
http://www.eea.europa.eu/

                                                                             Page 27 of 36
You can also read