Issues Paper on the Philippine Milk Products Industry - Francis Mark A. Quimba Kirsten J. Dela Cruz - Philippine Competition Commission
←
→
Page content transcription
If your browser does not render page correctly, please read the page content below
PCC Issues Paper
                             No. 03 Series of 2021

 PAPER
ISSUES

         Issues Paper on the
              Philippine Milk
           Products Industry

                  Francis Mark A. Quimba
                      Kirsten J. Dela Cruz
Issues Paper on the Philippine Milk Products Industry
Francis Mark A. Quimba and Kirsten J. Dela Cruz
Published by:
Philippine Competition Commission
25/F Vertis North Corporate Center 1
North Avenue, Quezon City 1105
PCC Issues Papers aim to examine the structure, conduct, and
performance of select industries to better inform and guide PCC’s
advocacy and enforcement initiatives. The opinions, findings,
conclusions, and recommendations expressed in these studies are
those of the author(s) and do not necessarily reflect the views of the
Commission. This work is protected by copyright and should be cited
accordingly.
The views reflected in this paper shall not in any way restrict or confine
the ability of the PCC to carry out its duties and functions, as set out in
the Philippine Competition Act. PCC reserves the right, when examining
any alleged anti-competitive activity that may come to its attention,
to carry out its own market definition exercise and/or competition
assessment, in a manner which may deviate or differ from the views
expressed in this paper.
queries@phcc.gov.ph | www.facebook.com/CompetitionPH | www.twitter.com/CompetitionPH | www.phcc.gov.ph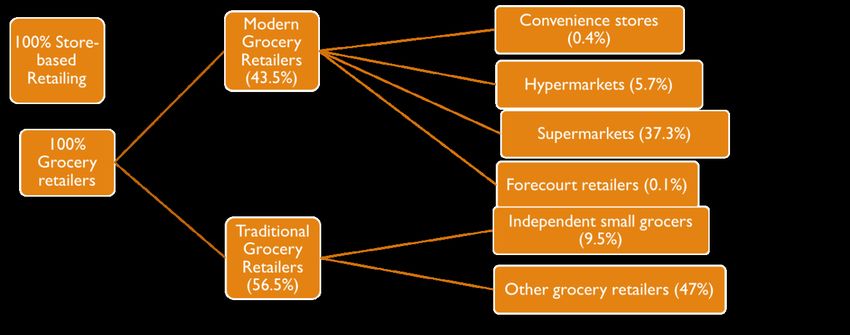
CONTENTS
LIST OF TABLES AND FIGURES ...................................................................................... 2
BACKGROUND.................................................................................................................. 3
      Objectives ........................................................................................................................ 3
      Scope and limitations of the study ............................................................................. 3
INDUSTRY STRUCTURE AND LOCAL PROFILE ............................................................ 6
      Description of Dairy Products and Industry .............................................................. 6
      Consumption................................................................................................................... 8
      Production ..................................................................................................................... 13
      Trade ............................................................................................................................ 17
SCP ANALYSIS ................................................................................................................ 23
      Structure-Conduct-Performance Analysis ............................................................... 24
REGULATORY ANALYSIS .............................................................................................. 26
CONCLUSION AND RECOMMENDATION ................................................................ 29
REFERENCES .................................................................................................................. 31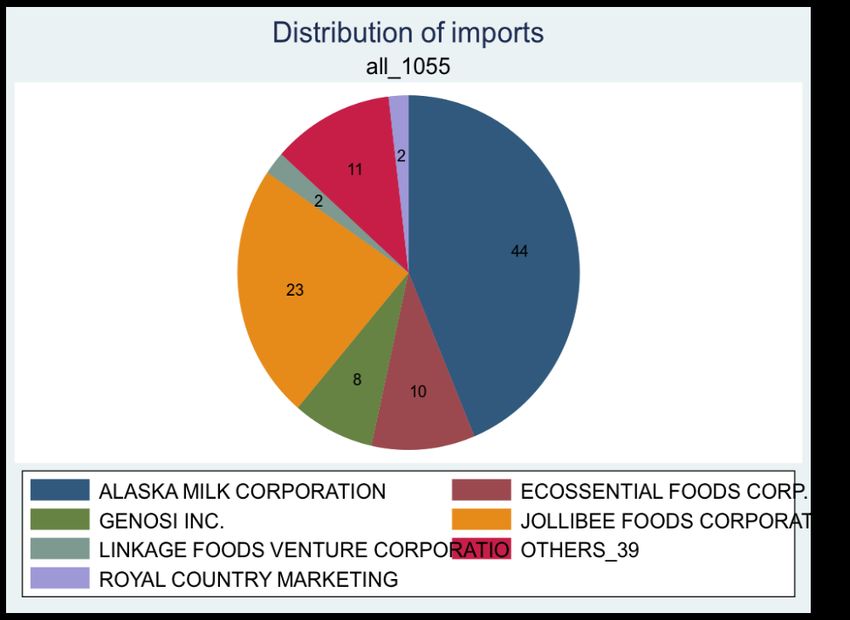
LIST OF TABLES AND FIGURES

Table 1. Competition checklist ..................................................................................................... 5
Table 2. Milk as a product and as an industry ............................................................................ 7
Table 3. Milk supply, by volume in million liters ......................................................................14
Table 4. Number of dairy manufacturers over time .................................................................15
Table 5. Imported Dairy Products, by Volume in million liters ...............................................18
Table 6. Dairy products manufacturing industry, 2014 ...........................................................23
Table 7. Indicators of industry structure and conduct .............................................................25
Table 8. Key regulations in the milk industry ............................................................................27

Figure 1. Household expenditure by type .................................................................................. 8
Figure 2. Milk expenditure (real) by income decile, 2012 and 2015 ....................................... 9
Figure 3. Breakdown of total milk expenditure by industry...................................................... 9
Figure 4. Breakdown of total milk expenditure by industry....................................................10
Figure 5. CPI of key food groups, 1990-2011 ..........................................................................11
Figure 6. Company Shares of Drinking Milk Products.............................................................12
Figure 7. Top brands in the Drinking Milk Category, 2019 ....................................................12
Figure 8. Company shares of ice cream and frozen desserts .................................................13
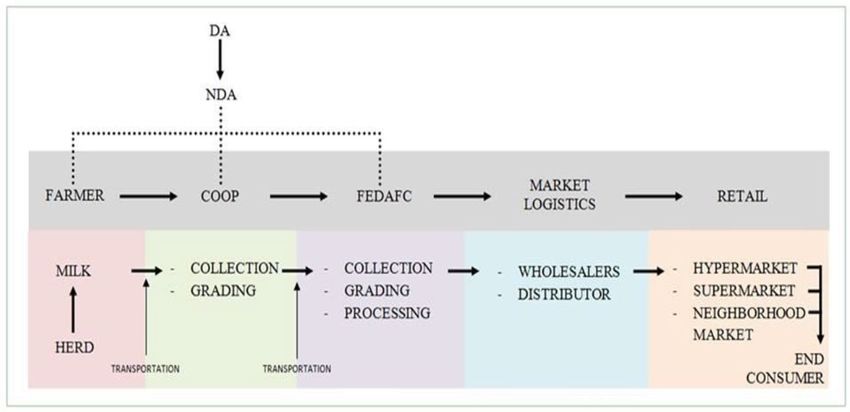
Figure 9. Linkages among of dairy industries and factors of production ............................. 15
Figure 10. Drinking milk distribution .........................................................................................16
Figure 11. Domestic supply of milk ...........................................................................................18
Figure 12. Importation of milk ....................................................................................................19
Figure 13. Distribution of milk products by use .......................................................................19
Figure 14. Importers of milk products in the Processing of fresh milk and cream .............. 20
Figure 15. Importers of powdered (non-infant) milk ...............................................................21
Figure 16. Top importers of infant powdered milk..................................................................21
Figure 17. Top importers of butter and cheese .......................................................................22
Figure 18. Top importers of PSIC 1055 (Manufacture of Ice cream and sherbet, etc.) ....... 22
Figure 19. Top Manufacture of milk-based infants' and dietetic foods (PSIC1056) ............ 23
Figure 20. SCP Analysis Milk industry........................................................................................25
Figure 21. Does Structure affect Conduct?...............................................................................26
Figure 22. Regulations in the value chain .................................................................................28

                                                                                                                                    2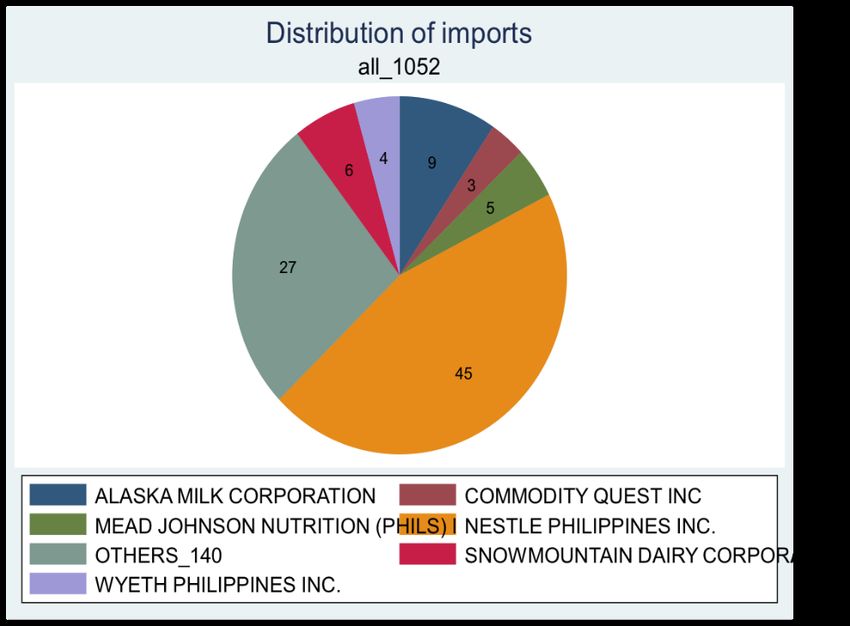
BACKGROUND

This issues paper looks into the milk manufacturing industry of the Philippines using the
Structure-Conduct-Performance (SCP) paradigm. The study provides a detailed description
of the industry covering the variety of products available in the market, the manufacturers
and suppliers, and the production value chains. It attempts to ascertain whether the
structure of the milk manufacturing industry induces the manufacturers and suppliers to
behave uncompetitively and identifies potentially anticompetitive laws and regulations that
affect the industry structure and firms’ conduct. Recommendations on possible measures
to address competition issues are also provided.

Given the limited understanding as to the reason behind the milk industry’s high
concentration and large margins, this issues paper helps to deepen stakeholders’
understanding of the industry and identify factors that potentially limit market competition
at each milk product segment.

Objectives

This issues paper aims to provide a detailed description of the milk industry focusing on
selected Philippine Standard Industrial Classification (PSIC) codes. For each of the
identified sectors, the major industry players and their corresponding profile are discussed.
Given the available data, this issues paper assesses their production and distribution
channels for possible competition issues. In addition, the consumption patterns of milk
products of Filipinos are presented to ascertain trends in demand and supply.

This study also identifies potentially anti-competitive laws and regulations that affect firm
entry and hinder business expansion. Lastly, this issues paper provides policy
recommendations to the Philippine Competition Commission (PCC) on how to address
anti-competitive conditions and practices identified.

Scope and limitations of the study

The study encompasses all major milk products, including production, importation,
distribution and retail processes. Subject to available data, the milk products covered are
the following:

    1. Processing of fresh milk and cream (PSIC 1051)
    2. Manufacture of non-infant powdered milk, condensed milk and
       evaporated milk (PSIC 1052)
    3. Manufacture of infant’s powdered milk (PSIC 1053)
    4. Manufacture of ice cream and sherbet, etc. (PSIC 1055)
    5. Manufacture of butter, cheese and curd (PSIC 1054)
    6. Manufacture of milk-based infants' and dietetic foods (PSIC 1056).

                                                                                           3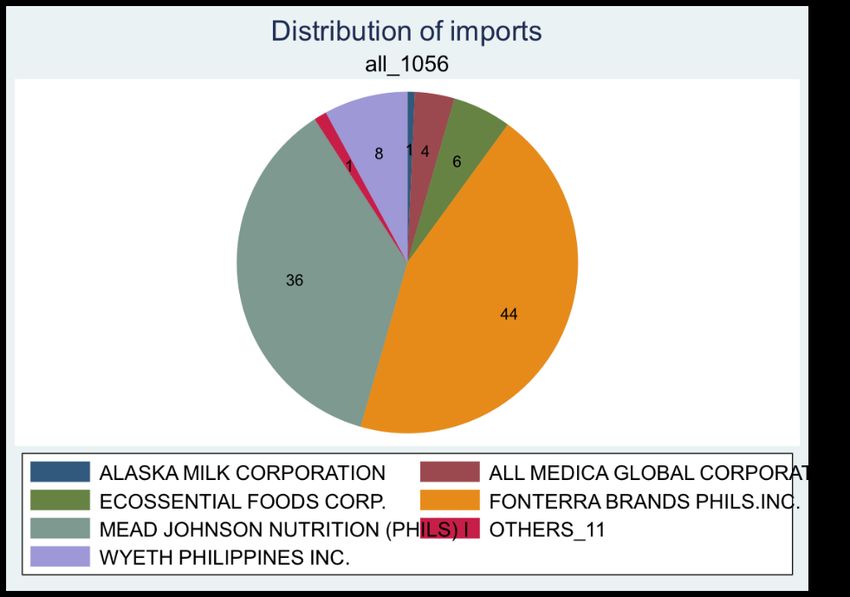
The study covers the entire geographic scope of the industry in the Philippines. Information
on distribution of manufacturers and sales for each product market are, to the extent
possible, at the provincial level.

The study is limited by data available at the establishment level for each of the milk
products. The Philippine Statistics Authority (PSA) classifies milk manufacturers according
to their main product. Thus, secondary data from the PSA would not allow the analysis of
the milk value chain of different products manufactured/sold by the same establishment.

While critical to the value chain, this study does not cover the production of raw milk from
cattle, sheep and goats (PSIC 0412). Because of such limitation, the value chain for
manufacture of milk products focuses on the dairy plant (See Figure 3). Milk substitutes like
non-dairy milk and cheese are also excluded.

To characterize the dairy marketing system, this scoping study is guided by Jabbar, Tambi
and Mullins (1997) methodology based on the SCP approach which posits that the industry
structure influences the conduct of its participants which in turn influence the industry’s
performance. It is important to note that certain fundamental conditions are necessary for
the SCP approach to work, including characteristics which are exogenous to the market, for
example infrastructure, legal and policy environment, and available technology.

Industry structure is described by "those characteristics of the organization of the market
that seem to exercise strategic influence on the nature of competition and pricing within
the market" (Bain, 1968). Some of the indicators that describe the structure of the milk
industry in the Philippines include: (a) the number and size distribution of firms in relation
to the size of the market; (b) the presence or absence of barriers to entry facing new firms;
(c) physical or subjective; product differentiation; (d) degrees of vertical integration; and (e)
ratio of fixed to total costs. Conduct refers to behavior of the firm. Examples of conduct are
pricing and selling policies and tactics, overt or tacit inter-firm cooperation, or rivalry, and
product or market related research and development activities. Performance is commonly
measured in terms of productive and allocative efficiency.

Following Jabbar, Tambi and Mullins (1997), the marketing system for each of the segments
of milk products are described by functional parameters and performance indicators.
Functional parameters describe how the system operates. Examples of functional
parameters are dairy products marketed, marketing agents, marketing outlets, prices at
each marketing node, modes of transporting marketed products, etc. Functional
parameters combine characteristics related to market structure and conduct. Performance
indicators on the other hand assess the performance of the system. These include the
percentage of total dairy products marketed 1, the ratio of standardized to non-standardized
products marketed ; the ratio of marketing to total costs; and the ratio of farm gate to retail
price.

1
    A dairy product is considered standardized when it meets a legally accepted minimum standard or quality
    (e.g. pasteurized, homogenized milk with 4% butter fat content) as opposed to a non-standardized dairy
    product which does not conform to any such standards e.g. raw milk.

                                                                                                         4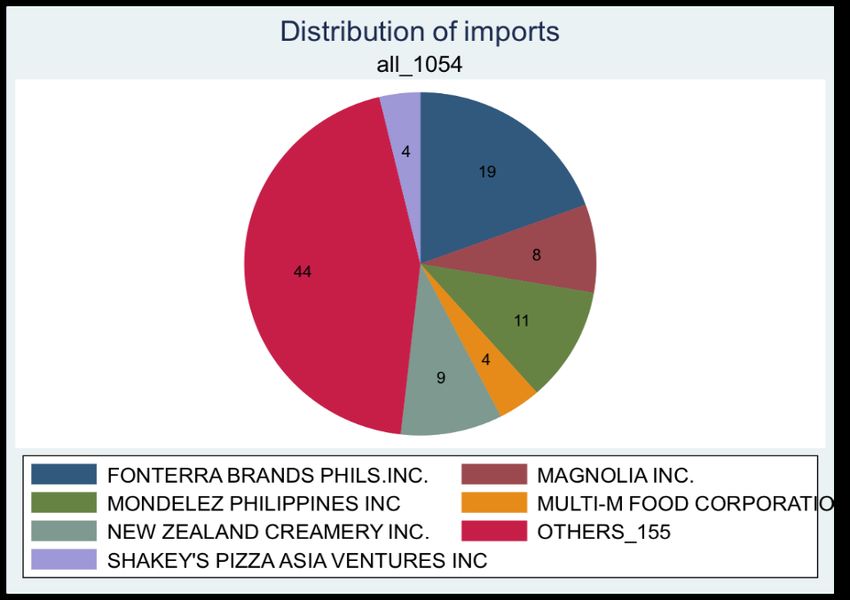
To identify potentially anti-competitive laws and regulations that affect firm entry and hinder
business expansion, this paper adopts the checklist proposed by the Competition and
Markets Authority in 2015 which provides a framework for assessing the competition impact
of policies. Table 1 presents the competition checklist questions. The SCP analysis of the
business environment coupled with key informant interviews of industry players are the
bases for the responses to the questions in Table 1.

Table 1. Competition checklist

  Does the policy impact on the number/range of market players…
      •   By awarding exclusive rights to supply?
      •   Purchasing, franchising or licensing from a single supplier or a restricted group of
          market players?
      •   Introducing a licensing scheme that limits on the number of market players?
      •   Introducing a market scheme that introduces quality?

  Does the policy indirectly limit the number or range of milk processors by…
      •   Significantly raising the cost of current milk processors, causing them to leave the
          market?
      •   Significantly raising the cost of new market players relative to existing market
          players?

  Does the policy limit the market player’s ability to compete by…
      •   Controlling or substantially influencing the price a market player may charge?
      •   Controlling or substantially influencing the characteristics of the products
          supplied?
      •   Limiting the sales channels a market player can use?
      •   Introducing restrictions on production processes or how market players are
          governed?
      •   Substantially restricting the ability of the market players to advertise their
          products?

  Does the policy limit the market players’ incentives to compete by incentivizing
  coordination?

  Does the policy limit the choices and information available to consumers by…
      •   Limiting the ability of consumers to decide from whom to purchase?
      •   Changing the information available to consumers but not improving their ability
          to make informed decisions?
      •   Increasing the cost of changing products?

                                                                                                 5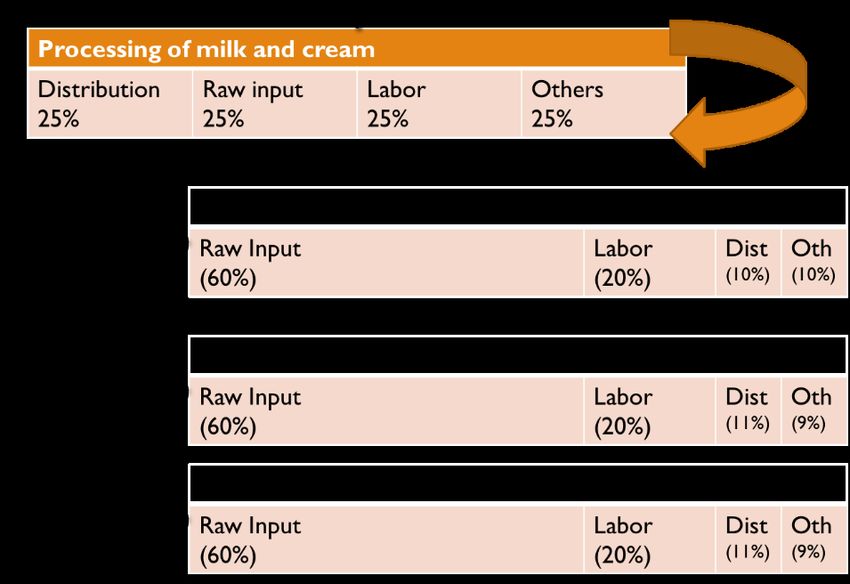
INDUSTRY STRUCTURE AND LOCAL PROFILE

This section describes the players of the milk manufacturing industry. It presents the value
chain/distribution channel model for each of the milk segments identified in the PSIC. The
characteristics of the Philippine companies across the value chain are presented to further
understand the milk manufacturing industry.

Description of Dairy Products and Industry

It is important to describe products under the dairy or milk industry. Table 2 presents the
classification of milk as utilized by international bodies and statistics authorities when they
look at milk as a commodity or as an industry. The types of milk products available in the
market vary in terms of fat content and the form at which they are traded.

The Food and Agricultural Organization (FAO) describes the milk products as follows:

   a. Liquid milk – Processed liquid milk includes pasteurized milk, skimmed liquid milk,
      standardized milk, reconstituted milk, ultra-high temperature (UHT) milk and
      fortified milk. According to FAO, liquid milk is the most consumed, processed, and
      marketed dairy product.
   b. Condensed milk – This can be sweetened or unsweetened. Condensed milk is
      obtained from the partial removal of water from whole or skimmed milk.
   c. Evaporated milk – This result from the partial removal of water from whole or
      skimmed milk. Processing includes heat-treating to make the milk bacteriologically
      safe and stable.
   d. Milk powder – This is obtained from the dehydration of milk and is usually in the
      form of powder or granules.
   e. Cream – This is the part of milk that is comparatively rich in milk fat. It is extracted by
      skimming or centrifuging the milk. Cream products include recombined cream,
      reconstituted cream, prepared creams, pre-packaged liquid cream, whipping
      cream, cream packed under pressure, whipped cream, fermented cream and
      acidified cream.
   f. Cheese – This is produced through the coagulation of milk protein, which is
      separated from the milk’s whey. Cheese can be soft, hard, semi-hard, hard ripened
      or unripened.
   g. Butter – This is a fatty milk product produced by churning milk or cream.

The PSA classifies establishments related to the manufacture of milk according to the
following 4-digit code: Processing of fresh milk and cream; Manufacture of powdered milk
and condensed or evaporated milk; Manufacture of yoghurt; Manufacture of whey and the
Manufacture of butter, cheese and curd.

                                                                                               6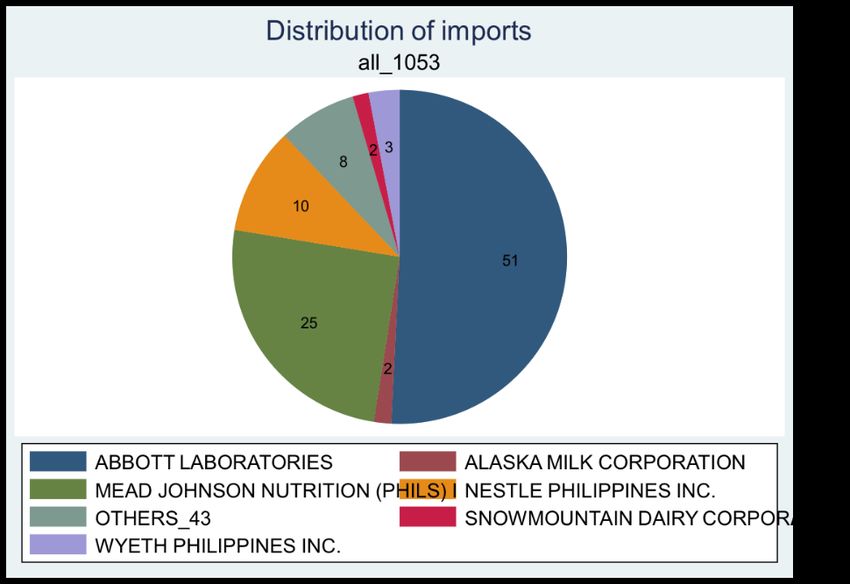
In Table 2, note that with the exception of yoghurt and whey, there is no one-to-one
  matching of milk manufacturers to milk products. Given this complication, the reader
  should note whether the analysis is looking at milk as a product or milk as an industry.
  Characteristics of the product itself including prices and volume of trade looks at milk as a
  product while characteristics of the manufacturer looks at milk as an industry.

  Table 2. Milk as a product and as an industry

                              Milk as a product                                 Milk as an industry
 HS Code                                Description                         PSIC code      Description
            Milk and cream of =1% but =6% fat, not concentrated, not containing
  40130
            added sugar or other sweetening matter

  40210     Milk and cream in solid forms of =1.5% fat, unsweetened
                                                                                        Manufacture of
  40229     Milk and cream in solid forms of >1.5% fat, sweetened                       powdered milk
                                                                              1052
                                                                                        and condensed or
            Concentrated milk and cream, unsweetened (excl. other than in               evaporated milk
  40291
            powder, granules or other solid forms)

  40299     Sweetened milk and cream (excl. in solid form)

                                                                                        Manufacture of
  40310     Yogurt                                                            1057
                                                                                        yoghurt
                                                                                        Processing of
  40390     Buttermilk, curdled milk and cream, etc. (excl. yogurt)           1051      fresh milk and
                                                                                        cream
            Whey & modified whey, concentrated or not, or containing                    Manufacture of
  40410                                                                       1058
            added sugar or other sweetening matter                                      whey

  40490     Products consisting of natural milk constituent

  40500     Butter and other fats and oils derived from milk

            Fresh (unripened or uncured) cheese, (including whey cheese),
  40610
            not fermented, and curd                                                     Manufacture of
  40620     Grated or powdered cheese                                         1054      butter, cheese
                                                                                        and curd
  40630     Processed cheese, not grated or powdered

  40640     Blue-veined cheese

  40690     Cheese, not elsewhere classified

Source: WITS and PSIC

                                                                                                      7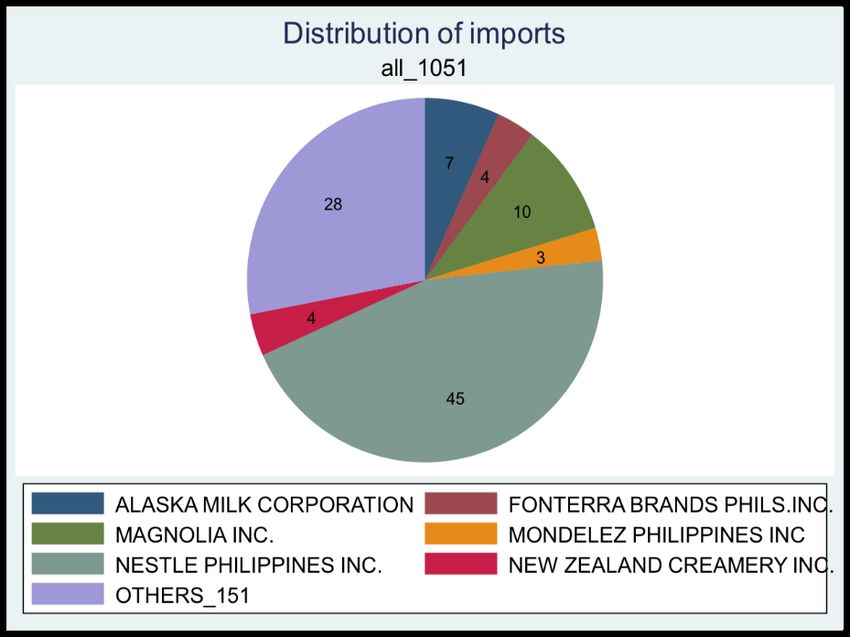
Consumption

As a food product, milk is vital in children’s nutrition. According to FAO, a daily glass of milk
provides a five-year-old child with 21% of protein requirements, 8% of calories, and various
micro-nutrients such as calcium, magnesium, riboflavin, vitamin B12 and B5, and selenium.
In fact, fresh milk and processed milk are among the basic necessities identified and
monitored by the Department of Trade and Industry. Despite its nutritional value, milk and
other dairy products are not among the top 10 food products consumed by Filipino
households (Gavilan, 2016). Powdered milk (19th) is the only dairy product in the top 20
most common food items consumed by Filipino households.

Data from the Family Income and Expenditure Survey 2015 shows that on average, dairy
products comprise about 3 percent of total household expenditure with milk products
contributing about 2 percent (Figure 1).

Figure 1. Household expenditure by type

                                                                 milk only
                                                                    2%
                                   Food (excl milk)
                                        40%
                                               Other
                                                3%

                                                             other dairy and
                              Non-food                             eggs
                                57%                                1%

 Source: 2015 Family and Income Expenditure Survey

Grouping households by income decile and calculating the total milk expenditure by
decile, Figure 2 shows that milk consumption is increasing with income and over time. The
increase in milk consumption from 2012 to 2015 is mainly driven by the increase in
consumption of milk by the top 3 income deciles. With an expanding middle class and a
growing population, the Philippines is expected to rapidly expand its demand for milk and
milk products. The country’s annual dairy requirement in 2017 is at 2.4 metric tons. BMI
Philippines also reported that per capita dairy consumption levels across Asia have been
rising in recent years. Improvements in infrastructure like expanding cold chain capacity,
increasing number of supermarkets, and a blossoming food processing industry may
reinforce the long-term trend of strong growth in dairy consumption.

                                                                                               8
Figure 2. Milk expenditure (real) by income decile, 2012 and 2015
20
Billions
15
10
5
0
1 2 3 4 5 6 7 8 9 10
2012 2015
Source: 2015 Family and Income Expenditure Survey
Filipino households’ most commonly consumed milk products are condensed milk,
evaporated milk or (non-infant) powdered milk (Figure 3). These products correspond to
PSIC 1052 which is the manufacture of condensed, evaporated and powdered milk. This
industry provides almost all the source of milk for the entire country. It is interesting to note
that the top 30% of households also consume raw milk, milk-based beverages and milk-
based desserts including yoghurt and ice cream. The expenditure for these types of
products are very minimal for the other income groups.
Figure 3. Breakdown of total milk expenditure by industry
20
Billions
15
10
5
-
1 2 3 4 5 6 7 8 9 10
Milk based beverages
Milk-based dessert incl. yoghurt and cream
Source: 2015 Family and Income Expenditure Survey
9The distribution of milk consumption also varies among provinces (Figure 4). The provinces
with the highest average share of milk expenditure (as a share of total food expenditure, in
percent) are Batanes (14), Laguna (7.8), Zambales (7.8), Benguet (7.7), Camiguin (7.7),
Tarlac (7.6), Cavite (7.4), Manila-District 3 (7.4), Bataan (7.3), Camarines Norte (7.3), Manila-
District 4 (7.3), Misamis Oriental (7.3), Bulacan (7.2), Misamis Occidental (7.2), and Rizal
(7.2).
On the other hand the provinces with the least milk expenditure as a share of total food
expenditure are Palawan (5.1), North Cotabato (5.0), Masbate (4.9), Sultan Kudarat (4.9),
Zamboanga del Norte (4.9), Tawi-Tawi (4.8), Aklan (4.7), Apayao (4.7), Basilan (4.4), Ifugao
(4.4), Samar (4.4), Eastern Samar (4.2), Lanao del Sur (4.2), Abra (3.2) Maguindanao (2.8),
and Sulu (2.4).
Figure 4. Breakdown of total milk expenditure by industry
Milk/Total Food
6.8 - 14
6 - 6.8
5.3 - 6
BT
2.4 - 5.3
IN CG
AB KA
IS MT
IF IB
LABE
NVQR
PA AU
TR NE
ZA
PMBU
BN RZ
CV LG QZ CN
BS CD
CS
MQ
AL
MOMR SS
RM NS
MS
WS
AK ES
CZ
AQ IO
LY
NO CB SL
PL
BH SN
NR
SQ CM AN
SR
ML
MC AS
ZN LN BK
LS
ZS DV
NC DO
MG
DS
BL SK
SC
SU
TW
Source: 2015 Family and Income Expenditure Survey
10Price data from 1990-2011 2 seem to indicate that among key food items like rice, meat,
fruits and vegetables, and eggs, milk has exhibited the biggest increase. Compared to
prices in 2000, milk products in 2011 have almost doubled. Other food products have risen
but at a slower pace (Figure 5).
Figure 5. CPI of key food groups, 1990-2011
250
200
150
%
100
50
0
Rice Dairy Products Eggs Fruits & Veg Meat
Source: CountryStat, NSO
Average farmgate price of milk surged from as low as Php 13.70 per liter in 2000 to as high
as Php 32.03 in 2015. Latest data from the PSA as of March 2018 also shows that average
farmgate price of milk remained high at Php 34.75.
The Euromonitor database was used to obtain an idea on the brands and companies that
are often patronized by consumers (as reflected by their market share). The database
contains aggregated market information on fresh/pasteurized milk, long-life/UHT milk,
goat milk, flavored milk drinks, non-dairy milk alternatives, powder milk and flavored
powder milk drinks. While this database may not exactly meet the requirements for this
study as it does not distinguish between the various milk industries as defined by the PSIC,
it is the only available resource on the milk manufacturing market.
For 2019, close to half of the market for drinking milk products are captured by Nestlé
Philippines (henceforth Nestlé), followed by Alaska Milk Corporation (henceforth Alaska
Corp) at 21% and Fonterra Brands Phils (henceforth Fonterra) at 12%. Since 2010, Nestlé,
Alaska Corp and Fonterra have been the companies with the three largest market shares
(Figure 6). What is notable is the entry of AB Nutribev, Inc. 3, which had the fourth largest
market share at 4%.
2
After 2011, the consumer price index for milk has been combined with eggs and other dairy products.
3
AB Nutribev is the manufacturer of Vitamilk.
11Figure 6. Company Shares of Drinking Milk Products
Vitasoy URC, Inc
Snow Mountain Dairy Corp
1%
1% 1%
1% 1%
1% 1%
2%
7% 7% RFM Corp
14% 14%
Others
Nestlé Philippines Inc
50% 49%
44% 43%
Mead Johnson Philippines Inc
Magnolia Inc
Hershey Philippines Inc
12% 12% 12% 11%
Fonterra Brands (Phils) Inc
24% 24% 23% 21% Alaska Milk Corp
0% 1% 3% 4% Ace Canning Corp Sdn Bhd
2010 2013 2016 2019 AB Nutribev Inc
Source: Euromonitor
For 2019, the brands leading in terms of market share in drinking milk category are Bear
Brand (Nestlé) 4 at 40%, Alaska (Alaska Corp) at 21%, Nido (Nestlé) at 8%, and Anchor
(Fonterra) at 6%. Other companies in total make up 7% of the market share. Selecta (RFM
Corp) and Magnolia (Magnolia Inc) have only 1 percent market share each in this category
(Figure 7).
Figure 7. Top brands in the Drinking Milk Category, 2019
Selecta Magnolia Nestlé Birch Tree Vitasoy Soyfresh
Sustagen Vitamilk
2% 1% 1% 1% 0% 0% Hershey's
2% 4% 0%
Chuckie
5%
Bear Brand
Anlene 35%
5%
Anchor
6%
Others
7%
Nido
8% Alaska
21%
Source: Euromonitor
4
Local Brand Owner or manufacturer in parentheses.
12For ice cream and frozen desserts, Unilever RFM Ice Cream Inc. (henceforth Unilever RFM)
has had the largest market share from 43% in 2010 to 60% in 2019. Nestlé Philippines, Inc.
is a distant second at 24% in 2010 (20% in 2019) while Magnolia, Inc. follows closely as third
(Figure 8). The brands contributing to the large market share of Unilever RFM are Cornetto,
Magnum and Selecta. Nestlé has three brands: Drumstick, Lait, Nestlé and Pinipig.
Magnolia, Inc. is the manufacturer of products with the Magnolia and Magnolia Popsies
brand (See Appendix 3)
Figure 8. Company shares of ice cream and frozen desserts
Unilever RFM Ice Cream Inc
Tyson Foods Inc
43%
47%
54% Others
60%
Nestlé Philippines Inc
7%
7% Magnolia Inc
13% 0%
12% 12% 0%
Häagen-Dazs Distribution &
10%
Marketing Philippines Inc
24% Food People Inc, The
24% 24%
20%
BTIC Inc
6%
3% 6% 6% 6%
1%
1% 0%
1%
1% 0%
1%
1% 0%
1%
2% 2% 2% 1%
2% Arcefoods Corp
2010 2013 2016 2019
Source: Euromonitor
Production
The Philippines produces less than one percent of its total annual dairy requirement and
imports the rest. Based from the National Dairy Authority (NDA), local milk production
increased to 22.76 million liters in 2017 from 21.16 million liters the previous year (Table
3). Despite the said growth, average milk production in the Philippines per animal remains
low at 8 liters/day as compared with other milk-producing countries (30 liters/day in US and
20 liters/day in UK). The NDA attributes this to poor feeds and management practices as
well as high production costs and inadequate dairy infrastructure.
13Table 3. Milk supply, by volume in million liters
2013 2014 2015 2016 2017 Jan-Mar 2018
Local production 19.53 19.73 20.39 21.16 22.76 6.05
Imports 1,945.69 1,740.08 1,793.29 2,772.57 2,486.29 638.05
Gross Supply 1,965.22 1,759.81 1,813.68 2,793.73 2,509.05 644.10
Exports 48.52 69.40 168.32 211.58 52.34 25.55
Net Supply 1,916.70 1,690.41 1,645.36 2,582.15 2,456.71 618.55
Source: National Dairy Authority
The NDA data as of March 2018 also shows that local milk production registered at 6.05
million liters, bulk of which comes from cow’s milk at 63%, followed by carabao and goat’s
milk at 34% and 3%, respectively. Half of local smallholder milk production goes to school
and community milk feeding programs and the rest to local commercial sales or household
consumption. With dairy production in the country being more community-based,
maintaining the quality of fresh milk is a challenge due to the lack of processing and
distribution systems, and a dependable, continuous cold chain.
Since the Philippines imports bulk of its dairy requirement, only one glass out of every four
glasses of liquid milk supply (not reconstituted from powder) consumed in the Philippines
is produced locally. According to the NDA, a Filipino family typically spends approximately
Php 4,000 annually for dairy products.
Data on the production structure of the industry is not readily available so the Input-Output
(IO) table was utilized. From the IO table, it can be seen that PSIC1051 (processing of milk
and cream which includes 1052 and 1053) is the base industry that tends to supply key
inputs to the other industries like manufacture of butter and cheese (1055); manufacture of
sherbets and ice cream (1054); and manufacture of other dairy products (1056).
Processing of milk and cream (1051) has 4 main components in its production: raw inputs,
distribution, labor and others 5. Each component has about an equal share in the production
structure. As most of the milk and raw materials for dairy production is imported, it is
reasonable that distribution (including warehousing and logistic cost) is a significant
component of processing milk and cream. Milk and cream products are distributed to the
other industries as follows: 25% is utilized in the manufacture of butter and cheese, 18% for
the production of sherbets and ice cream and 27% is distributed to the manufacture of
other dairy products. For these industries, raw inputs comprise 60% of the inputs while
distribution only has a 10% share (Figure 9).
5
Others include services, utilities, packaging, etc.
14Figure 9. Linkages among of dairy industries and factors of production
Source: IO Table 2006
These details are significant because the fact that distribution is a quarter of the cost of
production of processing of milk and cream highlights the contribution of transport,
logistics to the industry.
Various years of the annual survey on business and industry was scrutinized to obtain an
understanding of the growth in the number of players. Table 4 presents the number of
establishments for each industry from 2008 to 2014 (industries were grouped together to
preserve anonymity). The manufacturers of powdered milk (whether for infants or
otherwise) has increased over time from 7 establishments in 2008 to 10 establishments in
2014. Only 3 establishments were involved in the manufacture of butter and cheese from
2008 to 2010 but this number has increased to 5 in 2014 indicating the entry of new
manufacturers.
Table 4. Number of dairy manufacturers over time
Source: PSA, ASPBI and CPBI
15The manufacturers of ice cream and sherbet, ice drop, ice candy and other flavored ices
have seen entry and exit of firms. Starting with about 25 establishments in 2008, this
industry has seen a jump in the number of establishments to 35 in 2009 but this declined
the following year to 29. In 2013, the number of establishments increased to 71 but
declined to 70 in 2014. The combined industries on the manufacture of milk-based infants’
and dietetic foods together with the manufacture of dairy products had a total of 17
establishments in 2014.
Since the Annual Survey of Philippine Business and Industry (ASPBI) data does not identify
the establishments that have entered or exited the market, it was necessary to complement
the PSA data with the Euromonitor database. Annual data on drinking milk products
showed the entry of AB Nutribev in the market in 2011 when Vitamilk obtained a market
share of 1.07 percent. Data also showed the exit of Hershey’s Philippines Inc. (maker of
Hershey’s) in 2012. Data on the ice cream and frozen desserts segment showed the exit of
Häagen-Dazs Distribution & Marketing Philippines, Inc. in 2012 and Tyson Foods, Inc. in
2014. Meanwhile, large market player Unilever RFM introduced another global brand
(Magnum) into the market in 2012 indicating innovation of established manufacturers (See
Appendix 3 and Appendix 4).
The discussion so far showed the entry and exit of firms in the milk industry. Certain
industries (or combination of industries) have few players (less than 10) which can present
some opportunities of collusion. Another insight is that the base industry (processing of
milk and cream) has few establishments. Any activity in this industry would certainly affect
the other industries and eventually the consumers.
Distribution plays a critical component of the supply of milk in the country. Milk supply is
mostly purchased in store-based retailing. That is, products are purchased within physical
stores or shops. More specifically, these physical stores, shops or grocery retailers (i.e. bulk
sellers of food and non-perishable food items packaged in bottles, boxes or cans) are the
main distribution channels (Figure 10).
Figure 10. Drinking milk distribution
Source: Euromonitor
16Grocery retailers can be classified into two: modern or traditional. Modern grocery retailers
include convenience stores, hypermarkets and supermarkets while traditional grocery
retailers are mainly independent small grocers. Supermarkets are modern grocery stores
that focus on providing low cost high volume self-service operations to meet varied
shopper needs. Supermarkets are usually located near residential areas and offer a wide
variety of food and household merchandize. A Hypermarket, in contrast, is a superstore
which combines a supermarket and a department store. They carry non-food products like
clothes, jewelries, stationery, electronic goods and others. Convenience stores are
relatively small stores located near residential areas. They offer limited line of convenient
products such as candy, ice cream, soft drinks, tobacco products and others. Convenience
stores are known to stock a limited range of high turnover convenience products and are
usually open for extended periods. Because of this, they tend to charge higher prices due
to convenience premium. Forecourt retailing involves the establishment of stores in front
of buildings in high traffic areas.
Traditional retailers include small-scale independent grocers which are typically passed on
from one generation to another and the family-owned and operated sari-sari stores.
Traditional retailers are known to have good relationship with the customers.
The distribution of milk in the Philippines is divided between two types of grocery retailers:
modern (43.5%) and traditional (56.5%). Zooming in the distribution of modern grocery
stores according to merchandise offered, Figure 4 shows that supermarkets (37.5%) have
the largest share among the types of modern grocery stores followed by hypermarkets
(5.7%). Convenience stores and forecourt retailers have less than 1% share of milk supply.
As for traditional grocery retailers, independent small grocers sell about 9.5% of the milk in
the market while the rest (47%) is sold through other traditional grocery retailers or the
traditional sari-sari stores.
Trade
As the Philippines produces less than 1% of its total annual dairy requirement, much of the
dairy requirements of the country is imported from other countries. Dairy products are the
third largest agricultural commodities imported by the Philippines, following wheat and
soybean meal. In 2017, the Philippines imported a total of 2.49 million liters of dairy
products, valued at USD 903.10 million (or Php 45.52 billion). This is lower than dairy
imports in 2016 which may be due to rising global milk prices. The imports for 2018 have
picked up with close to 3.0 million liters (Figure 11). In terms of sources and value share,
New Zealand continued to be the Philippines’ major milk supplier at 40%, followed by the
United States at 22% and Netherlands at 5%.
17Figure 11. Domestic supply of milk
Source: Phil. Dairy Update
According to the data of the NDA, skim milk powder and whole milk powder imports
comprise more than half of the country’s total dairy imports (Table 5).
Table 5. Imported Dairy Products, by Volume in million liters
2013 2014 2015 2016 2017 Jan-Mar 2018
1. Skim milk powder 887.38 746.30 787.40 1,435.85 1,121.44 32.87
2. Whole milk powder 205.65 154.00 134.10 166.17 150.51 5.24
3. Whey powder 338.18 380.41 375.71 403.93 422.34 12.41
4. Buttermilk/buttermilk 175.31 146.76 142.50 237.18 241.44 8.62
powder
5. Liquid (RTD) Milk 47.51 43.66 42.66 65.60 61.49 18.27
6. Evaporated milk 0.31 0.48 0.30 0.60 6.73 0.58
7. Condensed Milk 11.15 20.21 8.40 16.70 19.63 6.36
8. Cream 5.01 6.03 5.96 28.84 3.78 9.77
9. Other milk and cream 82.01 35.76 43.79 54.62 59.00 7.67
10. Butter/Butterfat 125.43 129.63 148.50 232.21 247.65 6.90
11. Cheese 64.21 68.86 95.05 127.32 108.20 6.75
12. Curd 3.54 7.98 8.92 3.55 44.08 2.51
TOTAL 1,945.69 1,740.08 1,793.29 2,772.57 2,486.29 117.95
Source: National Dairy Authority
This is corroborated by data in Figure 12 which presents milk and cream in solid form as
the major imports of the country. Other imported dairy products such as whey and natural
milk serve as inputs in the domestic production of other dairy products. Butter and cheese
have also driven the increase in the imports of dairy products in the recent years.
18Figure 12. Importation of milk
Source: WITS
Figure 13. Distribution of milk products by use
Source: WITS
More than 95% of milk and cream (solid form) and whey are imported for industrial use with
a small proportion being sold for household consumption (Figure 13). Products like skim
milk, whole milk powder and butter milk powder are imported as inputs to the manufacture
of condensed milk, evaporated milk and other milk products. According to the US
Department of Agriculture Global Agriculture Information Network (GAIN) Report of 2017,
imported milk and cream (powder) are used in the production of the following:
• Skim Milk Powder: Recombined sweetened condensed milk, recombined UHT milk,
ice cream, infant and follow-on formulas, and medical nutrition formulas.
• Whole Milk Powder: Recombined UHT milk, ice cream, infant and follow-on
formulas, medical nutrition formulas, and instant powdered milk.
• Butter Milk Powder: Recombined sweetened condensed milk, ice cream, and
bakery.
19• Whey Products: Recombined sweetened dairy creamer, ice cream, infant and follow-
on formulas, processed meat, processed food, confectionery, bakery, and animal
feed.
Key informant interviews also corroborate the finding that milk and cream (solid form) is
imported for industrial purposes by top manufacturers of condensed milk.
Given the critical role of imports, it is important to identify who does the importing and how
they are related to the suppliers in the market. The following figures present the breakdown
of the different milk commodities, by importers and industry.
Top importers of dairy products in PSIC code 1051 (processing of milk and cream) include
Nestlé Philippines, Inc. with a market share of 45%, Magnolia, Inc. (10%) and Alaska Milk
Corporation (7%). Fonterra Brands Phils, Inc., New Zealand Creamery, Inc. and Mondelez
Philippines, Inc. complete the top 6 importers. Note that there are 157 importers of fresh
milk and cream in total; the smaller importers collectively make up 28% of the market
(Figure 14).
Figure 14. Importers of milk products in the Processing of fresh milk and cream
Source: Business Statistics Monitor
For non-infant powdered milk (PSIC 1052), the top importers are Nestlé Philippines, Inc.
(45%) followed by Alaska Milk Corporation (9%) and Snowmountain Dairy Corporation
(6%). There are 140 other importers of non-infant powdered milk who collectively make up
27 percent of total imports (Figure 15).
20Figure 15. Importers of powdered (non-infant) milk
Source: Business Statistics Monitor
For infant powdered milk, Abbott Laboratories make up more than 50 percent of total
imports followed by Mead Johnson Nutrition Philippines (25%) and Nestlé Philippines, Inc.
(10%). There are 43 other importers with significantly smaller imports share (Figure 16).
Figure 16. Top importers of infant powdered milk
Source: Business Statistics Monitor
For butter and cheese, the largest importers are Fonterra Brands Philippines, Inc. (19%),
Mondelez Philippines, Inc. (11%), New Zealand Creamery (9%) and Magnolia, Inc. (8 %). The
21remainder is shared by 155 smaller importers. Some importers such as Shakey’s Pizza Asia
Ventures indirectly sell cheese to customers as input to their pizza products (Figure 17).
Figure 17. Top importers of butter and cheese
Source: Business Statistics Monitor
Similar to butter and cheese, top importers of ice and sherbet include suppliers to fast food
establishments like Jollibee Foods Corporation (23%). Alaska Milk Corporation is the top
importer of ingredients for ice cream and sherbet. Other companies that import ice cream
and sherbet are Ecossential Foods Corp., Genosini, Inc., Linkage Foods Venture
Corporation, and Royal Country Marketing. There are 39 other importers that serve the
remainder of the market (Figure 18).
Figure 18. Top importers of PSIC 1055 (Manufacture of Ice cream and sherbet, etc.)
Source: Business Statistics Monitor
22The top importers of the milk-based infants’ and dietetic foods (PSIC 1056) are Fonterra
Brands Phils., Inc. (44%), Mead Johnson Nutrition Philippines (36%) and Wyeth (8%). Note
that there are only 11 other importers of these products—significantly fewer players relative
to other milk product categories (Figure 19).
Figure 19. Top Manufacture of milk-based infants' and dietetic foods (PSIC1056)
Source: Business Statistics Monitor
SCP ANALYSIS
Data from the PSA shows that all segments of milk manufacturing industry are highly
concentrated with HHI registering above 2,5006. Aside from manufacturers of fresh milk
and cream, all dairy products manufacturing industry segments recorded high (above 15%)
to moderate (10-15) price-cost margin. Table 6 shows the dairy products manufacturing in
terms of concentration ratio, price-cost margin, and their importance to the industry.
Table 6. Dairy products manufacturing industry, 2014
% GVA
PSIC No. of APCM
Description HHI share in
Code establishments (in %)
Mfg.
C1051 Processing of fresh milk and cream 13 9,633 1.48 0.02
C1052 Manufacture of powdered milk 8 2,947 14.80 2.42
(except for infants) and condensed
or evaporated milk (filled,
combined or reconstituted)
6
Medalla et al (2018) classified industries as highly concentrated if HHI is greater than 2500; moderately
concentrated if HHI is between 1500 and 2500; and low concentration if HHI is less than 1500.
23% GVA
PSIC No. of APCM
Description HHI share in
Code establishments (in %)
Mfg.
C1053 Manufacture of infants' powdered 2 5,048 14.70 0.51
milk
C1054 Manufacture of butter and cheese 5 4,645 10.60 0.60
C1055 Manufacture of ice cream and 70 6,654 10.51 0.17
sherbet, ice drop, ice candy and
other flavored ices
C1056 Manufacture of milk-based infants'
1 10,000 16.59 0.42
and dietetic foods
C1059 Manufacture of dairy products, not
16 4,495 16.45 0.37
elsewhere classified
Source: Philippine Statistics Authority
Structure-Conduct-Performance Analysis
The limited data on the milk industry has only allowed the researchers to identify the
following Structure-Conduct-Performance indicators. The industry produces highly
sensitive products that are easily spoiled; thus, milk should be stored at temperatures not
higher than 4˚C. Specifically, fresh raw milk requires special procedures in order to be safely
transported and distributed. Likewise, milk manufacturing needs to follow general
principles of food hygiene to ensure that the product is safe for consumption. The industry
is highly concentrated and most products are imported. There is entry and exit of firms
across the years as evidenced by the changing number of establishments for each industry
group. Locally, one of the important observations is the limited number of suppliers.
Production of fresh raw milk is highly regulated and requires significant capital investment
in order to be competitive nationwide. The NDA estimates that the cost of one cow is at
PhP150,000.00 each. Cows and even grass seeds are sourced from abroad. For a dairy
farmer to be considered as a smallholder, a minimum of 25 cows is needed. However, in
the Philippines, the NDA estimates that each dairy farmer only owns five (5) to ten (10)
cows. 7 Because of the challenges in appropriately collecting, storing and transporting of
fresh raw milk, the investment necessary to support the local industry is tremendous. 8 Thus,
domestic suppliers of fresh milk remain small-scale and often concentrate on their local
community (Figure 20).
7
Interview with National Dairy Authority dated 31 January 2019
8
According to the proposed code for Hygienic practice for Milk, there is a need to train milk producers and
handlers on the proper hygienic milking; storage, handling, collection and transport of milk; microbiological,
chemical and physical hazards and their control measures; disease control and prevention and others.
(https://members.wto.org/crnattachments/2017/SPS/PHL/17_2020_00_e.pdf)
24Figure 20. SCP Analysis Milk industry
Structure Conduct
•High concentration per •Below 90% CU
segment Performance
•Firms tend to
•High degree of foreign concentrate on •High price margins
imports certain product
•Entry-Exit can be observed groups
•Highly sensitive and
regulated product
Studies [Medalla et al. (2018), Adera et al. (2016), Setiawan et al. (2012)] have identified
indicators of firm behavior or conduct such as advertising expenditure, R&D and Capacity
Utilization. Using data for 2014 ASPBI, this study looked at the average R&D expenditure
for each industry. The hypothesis is that firms with market power would have no incentive
to invest in R&D or would reserve R&D as a means of preventing new entrants to the market.
Similar interpretation can be made for capacity utilization.
53% of milk-related establishments have a capacity utilization (CU) of below 80 percent; this
is lower than the 60 percent average for all industries. CU below 80 percent suggests that
there is room for the industry to expand production as most of the milk-related
establishments fall below the full capacity range (80-100 percent). Meanwhile, the average
industry R&D at 1% of total expenditures is higher than all industry average. High R&D
suggests that there is high degree of innovation in the industry. We note that while the
dataset shows that 100 percent of firms in milk-based infants’ and dietetic foods have CU
below 80%, the average R&D of firms in this industry is much higher than the average for all
industries.
Table 7. Indicators of industry structure and conduct
Import % of
Penetration Ave. R&D
establishments
HHI Expenditure/ Total
(% of Industry with CU below
Expenditure (%)
Sales) 80%
Processing of fresh milk and cream
(PSIC 1051) 9,634 192 0.04 43
Manufacture of non-infant powdered
milk, condensed milk, evaporated
milk (PSIC 1052) 2,999 0.05 0.01 25
Manufacture of infant’s powdered
milk (PSIC 1053) 5,048 272 0.58 50
Manufacture of ice cream and sherbet
etc. (PSIC 1055) 4,643 3 0.28 60
25Import % of
Penetration Ave. R&D
establishments
HHI Expenditure/ Total
(% of Industry with CU below
Expenditure (%)
Sales) 80%
Manufacture of Butter, cheese and
curd (PSIC 1054) 6,654 40 0.06 38
Manufacture of milk-based infants'
and dietetic foods (PSIC 1056) 10,000 22 5.08 100
All industries 1,742 24.33 0.058 60
Figure 21 provides some indication whether industry structure indeed influences firm
conduct. We find a positive correlation (8.48) between industry structure as measured by
HHI and the proportion of firms in an industry operating at 50-80 percent capacity. In
contrast, there is a negative correlation (-8.46) between HHI and firms operating at 90-100
percent capacity. This may be an indication that industry structure is related to firm conduct.
Using data on all industries, we find that industries that have high concentration tend to
have larger proportion of firms with capacity utilization rate below 80 percent.
Figure 21. Does Structure affect Conduct?
Source: Author’s calculations using ASPBI
REGULATORY ANALYSIS
A critical feature of the industry is that it is highly regulated. The Department of Health
(DOH) issued Administrative Order (AO) 0029 series 2014 classifies condensed milk,
evaporated milk, reconstituted milk and milk powder as medium risk foods, while dairy
products and analogues such as milk and dairy-based drinks, cream, cheese, dairy-based
desserts, whey and whey products, milk for manufacture and dairy-based desserts (ice
cream) as high-risk food products. In addition, infant formula and milk supplements
26classified as foodstuffs intended for particular nutritional uses are also considered as high-
risk products.
The following are the key policy instruments regulating the milk industry. The primary
regulator of the industry is the Food and Drug Administration (FDA) under the DOH. Other
policy instruments designate some aspects of regulation to other government agencies
such as the Department of the Interior and Local Government (DILG), local government
units (LGU), Department of Agriculture (DA) and the Department of Trade and Industry
(DTI). These agencies are essentially tasked to ensure that the consumers are protected by
regulating the prices of milk products in the market (Table 8).
Table 8. Key regulations in the milk industry
Regulation Regulator Key features
BO No. 163 s. 1997 DOH-BFAD Two systems of registration: Dairy products (Cat.
Specific Requirements for the (now FDA) I) and Foods for infant and children (Cat. II)
Registration of Imported Food and
Food Products
RA 10611 DA (NDA),
Food Safety Act of 2013 DOH, DILG,
LGU
RA 7581 (The Price Act), as DTI and DA Covers basic necessities (processed milk) and
amended by RA 10623 prime commodities during periods of calamity,
emergency, widespread illegal price
manipulation, etc.
EO 51s. 1986 DOH Regulates the marketing of products related to
Philippine Milk Code of 1986 infant feeding
DOH AO 153 s. 2004 FDA Ensures food safety and quality of food products
Revised Guidelines on Current
Good Manufacturing Practice in
Manufacturing, Packing Repacking,
or Holding Food
DOH AO 0029 s. 2014 FDA Provides guidelines on the issuance of License to
Rules and Regulations on the Operate to food establishments engaged in the
Licensing of Food Establishments manufacture or processing and distribution of
and Registration of Processed Food, processed food and food products and Certificate
and Other Food Products, and for of Product Registration to FDA-licensed
Other Purposes establishments before processed food or other
food products enter the market
These regulations cover various segments of the milk value chain. Figure 22 presents the
milk value chain and identifies the segments where these regulations are relevant. For
instance, good manufacture practices (Administrative Order 153 s. 2004) covers the entire
value chain while the Philippine Milk Code (Executive Order 51 s. 1986) covers only the
distribution segment particularly advertising and marketing of milk products related to
infant feeding.
27Figure 22. Regulations in the value chain
Source: Ricalde et al. (2014)
Following the CMA (2015) checklist, we attempt to answer a modified set of questions
based on KIIs conducted with milk players and regulators.
Does the regulatory environment impact on the number/range of market players?
There seems to be no indication that the current regulatory environment limits the number
or range of market players or exclusively provide rights or awards certain market players to
supply certain milk products as there has been no special treatment to single suppliers or
discrimination of certain suppliers or products.
Does the regulatory environment indirectly limit the number or range of milk
processors?
While no regulation limits the number or range of milk processors or manufacturers, it is
possible that the implementation of milk regulations, particularly the product registration
and testing, limit the participants in the market. Milk manufacturers may have more
competitive advantage than new and smaller-scale entrants since the former already know
what requirements to submit to FDA as well as the flow and processes for each requirement.
Meanwhile, those new in the business, specially smaller-scale entrants, may find it more
difficult to enter given the new rules and requirements they have to follow. Each product
has to undergo various tests to show that the quality is at par to FDA’s standard before they
are given a Certificate of Product Registration (CPR). This may have an impact on the ease
of entry for smaller scale businesses as well as their ability to expand their businesses.
Further, an interview with the Center for Food Regulation and Research of the FDA (FDA-
CFRR) also shows that the agency is swamped with the demand for its services, thus, the
agency’s limited capacity does not allow it to respond to the demands of the milk
processors in a timely manner. However, with the enactment of Republic Act No. 11032 or
28the Ease of Doing Business Act, the FDA will now have to comply with issuing the CPRs
within 20 days for initial registration.
Does the regulatory environment limit the market players’ incentives to compete by
incentivizing coordination?
There seems to be no indication that the regulatory environment has incentivized
coordination among the establishments in a certain dairy industry. In fact, the number of
products and players in the industry may be an indication that there is healthy competition.
A potential red flag is the lack of head-to-head competition among establishments
manufacturing products for multiple industries. For example, RFM manufactures ice cream
but also chocolate milk drinks while Nestlé manufactures ice cream but also powdered milk.
Based on key informant interviews, we note that companies tend to focus their resources
on products in which they have significant market share and production expertise, i.e. RFM
for ice cream, Alaska for evaporated and condensed milk, Nestlé for powdered milk. While
Nestlé would still maintain manufacturing other products, they would rather avoid directly
competing with RFM for ice cream but rather concentrate on milk powder.
Does the regulatory environment limit the choices and information available to
consumers?
The regulatory environment strictly monitors the promotion and advertising of infant
formula which may indirectly favor other substitutes for such products as stipulated in the
Philippine Milk Code. The ideal case is that breastmilk would be the favored choice but in
certain cases it is possible that powdered milk or evaporated milk would be the substitute.
According to the handbook of dairy production, evaporated milk is often used as infant
milk substitute particularly for poor segments of the population.
CONCLUSION AND RECOMMENDATION
This study explored why the milk and dairy industry in the Philippines has been observed
to enjoy high profits and examined the regulatory environment that directly and indirectly
affects the production of milk.
The study finds that domestic production of fresh milk is limited, and marginal as domestic
supply is mainly imports-driven. The nature of milk being a highly sensitive product
(because of the difficulty of safely transporting fresh milk) tends to limit competition coming
from local producers.
The entire value chain of milk manufacturing is governed by some form of regulation. These
regulations are meant to preserve the health of the consumers, especially infants who rely
on milk for sustenance. The government itself promotes breastmilk as best for infants as
reflected in the Philippine Milk Code, which was passed to contribute to the provision of
safe and adequate nutrition of infants by the protection and promotion of breastfeeding.
29While regulations aim to preserve consumer well-being by promoting food safety,
implementation tends to raise costs. In addition, the requirement to submit for testing every
product to be sold in the market overwhelms the FDA.
Data from key-informant interviews suggest that milk companies in the Philippines tend to
organize themselves such that head-to-head competition is avoided. This could be
observed in the way companies tend to specialize in manufacturing certain products as
market players focus their resources in producing goods which they believe they have
competitive advantage with. Thus, this may further strengthen their market share while
other companies tend to be content with being minimal players in the market. Competition
still does exist but in a limited way.
Given these findings, this paper recommends the following:
Limited data prevents researchers from exploring further the observation that there is a lack
of head-to-head competition within dairy market segments. It is recommended that the
PCC obtain some access to data and use behavioral economics methodology (See
Harrington 2006) to pursue this observation further.
This study also identified a number of key importers who are also the main product
manufacturers for milk segments. However, it was observed that there are also a number of
small (in terms of import share) importers. An ensuing question is how importers are related
to manufacturers. The relationship of these small importers and large importers and
manufacturers has important implications to competition. The key role of imports to
discipline market players is diminished when the importers themselves are closely related
to the manufacturers. To pursue this analysis, there is also a need to have a more
comprehensive database which links manufacturers and importers.
To increase sources of competition, it is recommended that small dairy farms and
manufacturers are given assistance. The PCC should alert the Department of Agriculture
and the NDA on the critical role of small dairy farmers in supplying milk in their respective
markets. Small dairy farms/manufacturers provide limited competition to large, established
milk manufacturers.
Regulatory analysis has shown that established manufacturers may have more advantage
in terms of handling CPR and License to Operate requirements from the FDA as opposed
to small-scale entrants given the former’s knowledge and resources on know-how to handle
FDA regulations. On top of this, the (opportunity) cost of waiting for product registration
certificates may limit competition as this may be more significant for small-scale milk
manufacturers.
30You can also read


