Drugs and Alcohol Needs Assessment for Walsall 2019
←
→
Page content transcription
If your browser does not render page correctly, please read the page content below
Drugs and Alcohol
Needs Assessment for
      Walsall
       2019

         1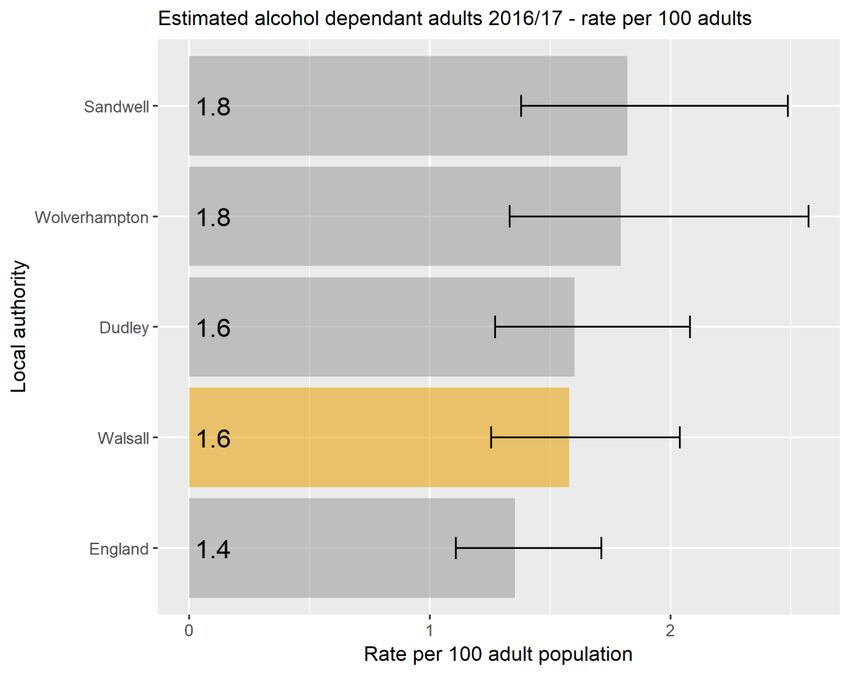
Contents
Acknowledgements................................................................................................................................. 5
Executive summary ................................................................................................................................. 5
Drug policy .............................................................................................................................................. 7
Demographics ......................................................................................................................................... 7
   Walsall population, trends, projected ................................................................................................ 7
   Deprivation ......................................................................................................................................... 8
Client classification ............................................................................................................................... 11
Prevalence estimates ............................................................................................................................ 12
   Opiate and/or crack cocaine use (OCU) in 2016/17 ......................................................................... 13
   OCU age group analysis in 2016/17 .................................................................................................. 14
   OCU gender analysis in 2014/15 ....................................................................................................... 16
   Alcohol prevalence estimates ........................................................................................................... 16
   Unmet need for alcohol treatment................................................................................................... 17
Adults (combined drugs and alcohol) ................................................................................................... 18
   Client characteristics ......................................................................................................................... 18
       Numbers in treatment - 2017/18.................................................................................................. 18
       Numbers in treatment – trends .................................................................................................... 18
       Substance use profile (all in treatment) ....................................................................................... 19
       Club drugs and NPS – all in treatment .......................................................................................... 20
       Age of clients (all in treatment) .................................................................................................... 21
       Gender of clients (all in treatment) .............................................................................................. 22
       Ethnicity of clients ......................................................................................................................... 22
       Country of origin (new presentations) .......................................................................................... 24
       Religion.......................................................................................................................................... 24
       Sexuality ........................................................................................................................................ 25
       Disability........................................................................................................................................ 25
       Source of referral into treatment ................................................................................................. 27
       Housing situation .......................................................................................................................... 29
       Employment status ....................................................................................................................... 29
       Parental status and safeguarding ................................................................................................. 30
       Mental health................................................................................................................................ 31
       Geographic distribution of clients................................................................................................. 33

                                                                             2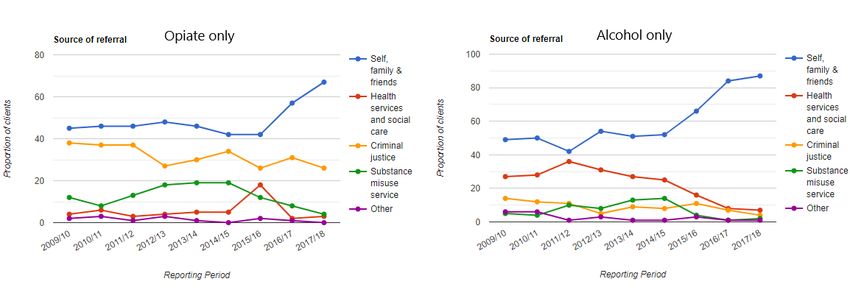
Access to services - Waiting times .................................................................................................... 34
   Treatment and recovery outcomes .................................................................................................. 34
       Treatment exits ............................................................................................................................. 34
       Successful completions – as proportion of all in treatment ......................................................... 37
       Successful completions and not re-presenting ............................................................................. 38
   Residential Rehabilitation and Detoxification .................................................................................. 39
   Health protection & harm reduction ................................................................................................ 40
       Injecting behaviour ....................................................................................................................... 40
       Blood borne virus status ............................................................................................................... 41
       Drug related deaths ...................................................................................................................... 42
       Alcohol-related deaths – years of life lost .................................................................................... 43
       Alcohol-specific deaths ................................................................................................................. 44
       Mortality from chronic liver disease ............................................................................................. 45
       Alcohol screening – NHS Healthchecks ......................................................................................... 45
Criminal Justice ..................................................................................................................................... 46
Young people ........................................................................................................................................ 46
   Introduction ...................................................................................................................................... 46
   Number in treatment ........................................................................................................................ 47
   Referral sources (routes into treatment) .......................................................................................... 47
   Vulnerabilities of young people receiving specialist treatment ....................................................... 48
   Age of young people receiving specialist treatment ........................................................................ 50
   Ethnicity of young people receiving specialist treatment ................................................................ 50
   Education, employment and training ............................................................................................... 51
   Accommodation status of young people receiving specialist treatment ......................................... 51
   Substances cited ............................................................................................................................... 51
   Length of time in treatment and interventions ................................................................................ 52
   Exiting services and re-presentations ............................................................................................... 53
   Young People data from local provider ............................................................................................ 54
Hospital admissions – Alcohol .............................................................................................................. 55
   Introduction ...................................................................................................................................... 55
   Definitions ......................................................................................................................................... 55
   Key indicators .................................................................................................................................... 56
Abbreviations and definitions ............................................................................................................... 58
   Data sources, caveats and comments .............................................................................................. 59
List of tables .......................................................................................................................................... 60
List of figures ......................................................................................................................................... 61

                                                                             3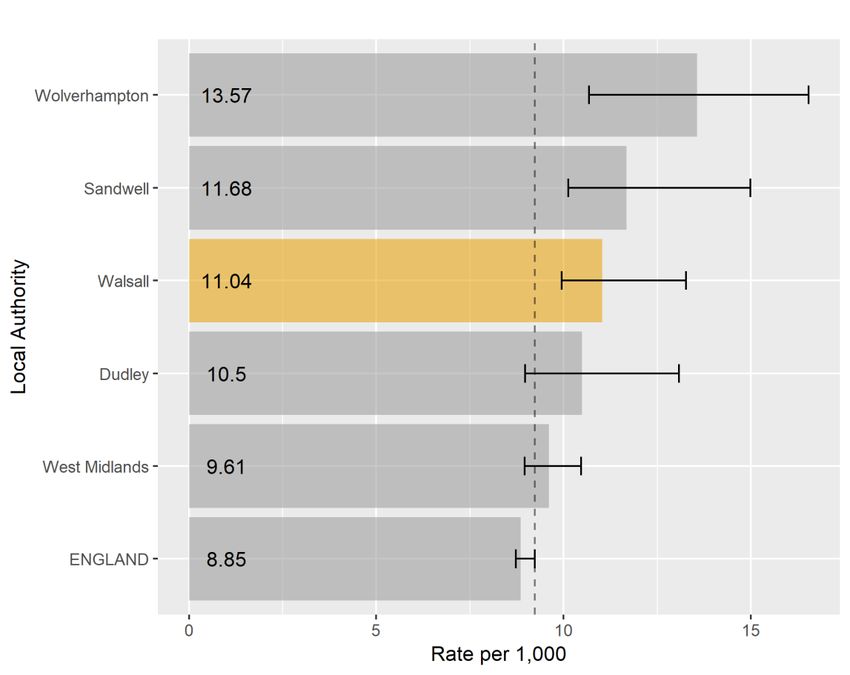
4

Acknowledgements

Thank you to colleagues from Walsall Council and CGL (Change, Grow, Live) for their contribution.

In particular, the following:

Adrian Roche (Head of social inclusion, Walsall council)

Patrick Duffy (Programme development and commissioning manager, Walsall council)

David Neale (Programme development and commissioning manager, Walsall council)

David Hughes (Public health intelligence, Walsall council)

Kerry Trinder, Lisa Buckley and Raj Tinkler (CGL)

Executive summary

This is the second drugs and alcohol needs assessment since the substance misuse service has been
commissioned within the local authority. Following the 2012 transfer of public health, and with it
the responsibility for commissioning drug and alcohol treatment services, into the local authority we
successfully, in 2014, re-designed and re-tendered our drug and alcohol treatment programme. We
achieved this by joining four separate services together to create a new integrated treatment
system. Five years on, we are seeking to re-tender our integrated treatment system. This needs
assessment has been completed written to support our re-tendering process using data from the
Public Health Institute at Liverpool John Moores University, National Drug Treatment Monitoring
System (NDTMS), Local Alcohol Prevalence Estimates (LAPE), and Walsall local data management
system.

The Public Health Institute, John Moores University, 2019 annual drug prevalence estimates that
Walsall has 1,915 problematic drug users of opiate and crack cocaine. This is a higher rate in
comparison to the West Midlands and National rates. Similarly, Walsall has a higher rate of injecting
drug users.

The estimated number of drug users has reduced over the last 10 years from 2,052 in 2009/10.
Despite the challenging prevalence rates, the local treatment system has a good penetration of the
drug using population with 1,288.

The typical adult drug and alcohol service user in Walsall is male, White British with the next highest
represented group being Asian/Asian British. 56% are parents with a fifth with dependent children
living with them; the largest cohort fall within the 30-39 age range (40%). Opiates are the primary
substances used by adults presenting into treatment (58%) followed by non-opiates (16%) and
alcohol (26%). 29% of service users are injecting and 27% have previously injected; 71% are
economically inactive; 84% have no accommodation issues with 10% have a housing problem and
6% have an urgent housing problem.

                                                    5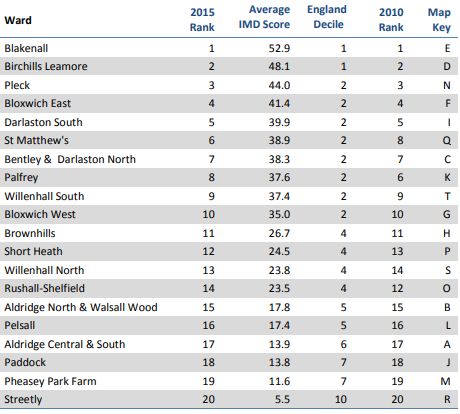
The Public Health England annual Local Alcohol Prevalence Estimates (LAPE), estimates that Walsall
has 3,360 (1.6 per 100,000) residents dependent on alcohol. The alcohol prevalence rate in Walsall is
rising slower than both the regional and national rates resulting in Walsall’s rate approaching the
national and regional rate per 100,000 of the population.

The main Public Health Outcome for alcohol is to reduce the alcohol specific admissions to hospital
(per 100,000 of the population). The most recent LAPE figures show that admissions for alcohol
specific conditions in Walsall were 651 compared with 528 for the West Midlands, and 570 for
England. This continues a trend where Walsall admissions have been higher over the last ten years.

There is a gender difference in the alcohol general admissions to hospital with a higher rate of males
in the over 65 age categories; there is however an increasing trend in female admissions in the over
65 age category. Walsall performance in the over 65 category is worse than the regional and
national average.

Alcohol related mortality in Walsall 57.1 per 100,000 compared to 46.2 (England), and 51.2 (West
Midlands). Alcohol specific mortality for Walsall is 13.5 per 100,000 compared to 10.6 (England), and
13.1 (West Midlands); Walsall’s rates are higher in both categories.

Young Adults and Young People

Typically, young people in specialist drug and alcohol services in Walsall are males (69%); they are
mostly White British (76%); 76% fall within the 14-17 age group, however 20% are aged 14 years and
under; cannabis (61%) and alcohol (25%) are the primary substances. 9% are looked after children;
the highest volume of referrals come from Education (38%), Youth Justice Services (30%), and
Children’s Services (18%). 53% are in mainstream education, but 18% are not in any education,
training or employment. The highest proportion (37%) remain in treatment between 13-26 weeks
receiving psychosocial (41%) and harm reduction (39%) interventions; 87% left treatment in a
planned way and 7% re-presented within six months of exit.

                                                  6
Drug policy

Successive drug strategies published by the UK government and devolved administrations have cited
considerable social and economic costs associated with drugs and the need to design policies aimed
at reducing these costs. There is a well-established link between certain drugs and acquisitive crimes
committed by dependent users to fund their drug use like shoplifting and burglary. On the supply
side, criminal gangs are often also involved with drug supply and human trafficking, child
exploitation and violence. The harm to individuals is also recognised by policy-makers in the UK and
a balanced approach is taken with the focus of policy being not just on enforcing drug laws but also
on providing support to those who experience issues with dependence. 1

The UK government is responsible for setting the overall strategic approach to reducing drug-related
harms. The 2017 Drug Strategy2, as with the preceding strategy released in 2010, sets out its key
aims of reducing drug use and increasing rates of recovery from dependence. Like the 2010 strategy,
initiatives are arranged into themes of reducing demand, restricting supply and building recovery,
with a new theme of global action introduced into the 2017 strategy.

The Misuse of Drugs Act 1971 (Her Majesty’s Government, 1971) is the principal legislation in the UK
for the control and supply of psychoactive substances that are considered dangerous or otherwise
harmful when misused. The act divides such substances into three classes (A, B and C) and sets
maximum criminal penalties for illicit production, possession and supply in relation to each class.

The Psychoactive Substances Act 2016, which came into force on 26 May 2016, prohibits the supply,
production and trafficking of psychoactive substances (Her Majesty’s Government, 2016). The act
was brought in as a response to New Psychoactive Substances (NPS) and the speed at which new
substances emerge. Keeping pace with the NPS market presented a challenge using the existing
legislation, as substances need to be added to the Misuse of Drugs Act 1971 or included on a
temporary class drug order (TCDO) in order to be controlled.

Demographics

Walsall population, trends, projected

Walsall is a metropolitan borough consisting of a mix of urban, suburban and semi-rural
communities. Covering 40 square miles, it is located to the north-west of Birmingham, and is one of
the four local authorities that make up the Black Country sub-region (with Dudley, Sandwell and
Wolverhampton). Walsall town centre lies at the heart of the borough surrounded by Aldridge,
Bloxwich, Brownhills, Darlaston and Willenhall district centres.3

1
  Focal point annual report 2017 (https://www.gov.uk/government/publications/united-kingdom-drug-
situation-focal-point-annual-report)

2
    Her Majesty’s Government, 2017
3
    https://www.walsallintelligence.org.uk/

                                                   7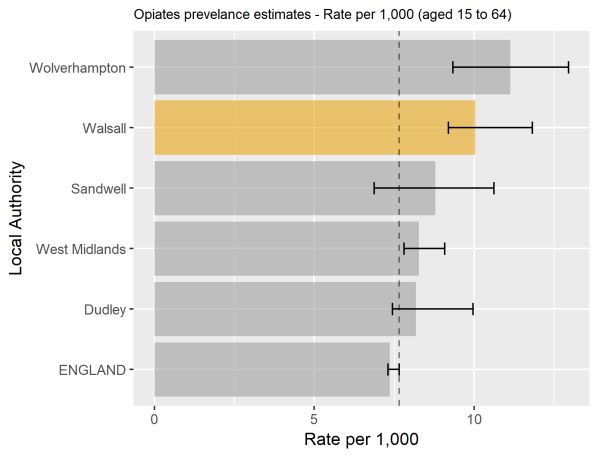
Walsall’s overall population of 278,700 (ONS 2016) residents is predicted to increase by 5.9% over 10
years, from 274,200 in 2014 to 290,200 in 2024. Like many areas, the predicted growth of Walsall’s
older population (> 65) is higher than this at 12.4%. There has already been an 8.8% increase in
births in Walsall between 2004 and 2014, and the number of reception pupils in Walsall schools has
increased 11.34% between 2012 and 2017. Therefore, planning to meet the needs of a growing
younger population as well as a growing number of older people is incorporated within the Local
Authorities’ key strategic priorities, while recognising that the proportion of residents likely to be
economically active is projected to fall.

Walsall is a culturally diverse town where people of Indian, Pakistani and Bangladeshi background
form the largest minority ethnic groups. The number of non-UK born residents in Walsall increased
by 3.7% (or 9,900 people) between the 2001 and 2011 censuses and Walsall now has a small Eastern
European population who make up about 1% of residents (2,700 people in total). In terms of
children and young people aged 0-17, the proportion of pupils from minority ethnic groups has
increased to 37.4% of all pupils living in the area from 36.7% in 2016 and 24% Primary pupils have
English as an additional language4. As at 31st March 2017, there are eight Unaccompanied Asylum
Seeking Children for whom the Local Authority are Corporate Parents, which is lower than other
West Midland authorities.

Deprivation

The English Indices of Multiple Deprivation (IMD), produced by the Ministry of Housing,
Communities and Local Government (MHCLG)5, identify small areas of England, which are
experiencing multiple aspects of deprivation. They are an important tool for identifying and
understanding deprived areas, and for targeting resources effectively. The most recent figures
available are for 2015, superseding previous versions from 2010, 2007 and 2004. Figures are
released at Lower Super Output Area (LSOA) level – a ‘neighbourhood’ level geography - allowing for
a deep dive approach across the Borough.

The Indices are based on seven different aspects (‘domains’) of deprivation, all of which combine to
produce an overall measure – the Index of Multiple Deprivation. The domains are:

      1.   Income
      2.   Employment
      3.   Health and disability
      4.   Education, skills and training
      5.   Crime
      6.   Barriers to housing and services
      7.   Living environment

Within Walsall, there is considerable variation in the levels of deprivation experienced in
neighbourhoods across the Borough. MHCLG’s IMD do not include measures of ward-level

4
    School Census, January 2017
5
    Formerly the Department for Communities and Local Government (DCLG)

                                                    8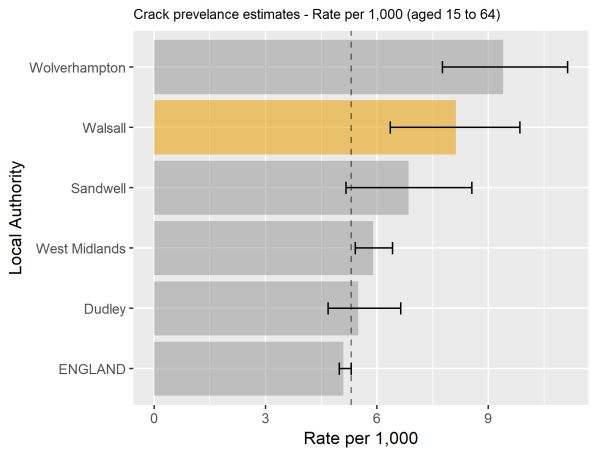
deprivation. However, these have been calculated using their approved method. The average IMD
score for each Walsall ward is shown in below.

Table 1 Average deprivation score by ward

Source: MHCLG Ward level deprivation in Walsall

The scores show Blakenall remains the most deprived ward overall, while Streetly is the least
deprived. The ranking of the wards is largely unchanged since 2010. Table 1 also shows where the
wards’ average scored would lie if placed in the distribution of all LSOA scores national – Blakenall
and Birchills, Leamore are in the 1st decile, so equivalent to the 10% most deprived small areas in
England, whilst Streetly is among the 10% least deprived.

                                                  9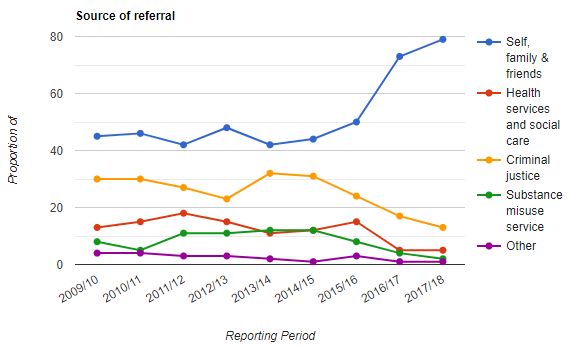
Figure 1 Deprivation by Walsall level quintile (IMD 2015)
Figure 1 shows IMD relative to the rest of the Borough, split into quintiles. Within the Borough as a
whole, the most deprived quintile (i.e. the most deprived 20% of LSOAs) is shown in darkest blue,
and the least deprived quintile (i.e. the least deprived 20% of LSOAs) is pale yellow.
Deprivation 2015 key facts summarised include:
34 out of 167 neighbourhoods (LSOAs) are now amongst the most deprived 10% in England
compared to 41 in 2010.
The 2015 Index of Multiple Deprivation now ranks Walsall as the 33rd most deprived English
local authority (out of 326), nudging Walsall just outside the most deprived 10% of districts in
the country (30th in 2010 and 45th in 2007).
There are extremes of deprivation, with central and western areas typically much more
deprived than eastern areas, although pockets of deprivation exist even in the more affluent
parts of the borough.
Walsall fares particularly badly in terms of income (18th), employment (30th) and education,
skills & training deprivation (12th), and many of the issues that challenge the borough match
the geography of deprivation.
The high and increasing levels of child poverty puts additional demands on services. Walsall
ranks 18th of 152 upper tier local authorities for income deprivation affecting children index6
with the Borough’s relative deprivation increasing over time.
6
IDACI 2015
10 1 in 3 (29.9%) aged under 16 years are living in low income families, higher than the national
average of 20.1%7.
A revised version of the Index of Deprivation is due to be released by MHCLG in the autumn of 2019.
This release will provide valuable insight in which to monitor and understand the impact of residents
living within highly deprived areas.
Additional data, statistics and publications for Walsall can be found on the Walsall intelligence
website: https://www.walsallintelligence.org.uk/
Client classification
Individuals presenting to adult alcohol and drug treatment services are categorised by the
substances they cite as problematic at the start of treatment8. They are categorised by the following
hierarchal criteria:
any mention of opiate use in any episode would result in the client being categorised as an
OPIATE client (irrespective of what other substances are cited)
clients who present with non-opiate substances (and not opiates or alcohol) will be classified
as NON-OPIATE ONLY
clients who present with a non-opiate substance and alcohol (but not opiates) recorded in
any drug in any episode in their treatment journeys will be classified as NON-OPIATE AND
ALCOHOL
clients who present with alcohol and no other substances will be categorised as ALCOHOL
ONLY
The classification method is illustrated in the diagram below.
7
HMRC, 2016: The Children in Low-Income Families Local Measure shows the proportion of children living in
families in receipt of out-of-work (means-tested) benefits or in receipt of tax credits where their reported
income is less than 60% of UK median income.
8
Adult substance misuse statistics from NDTMS - Apr 2017 to Mar 2018 (PHE)
11Figure 2 Client classification
Source: Public Health England
Prevalence estimates
These prevalence estimates for local areas were last updated in March 2019 for the period between
2016 and 20179. They are published by Liverpool John Moores University (LJMU) and contain
comparisons with prevalence estimates of previous periods between 2010/11 and 2014/15. There
were no data for 2015/16.
‘OCU’ refers to use of opiates and/or crack cocaine. It does not include the use of cocaine in a
powder form, amphetamine, ecstasy or cannabis. Although many opiate and/or crack users also use
these drugs it is very difficult to identify exclusive users of these drugs from the available data
sources.
9
https://www.gov.uk/government/publications/opiate-and-crack-cocaine-use-prevalence-estimates-for-local-
populations
12It is advisable to look at the prevalence rate as well as the actual numbers, because any significant
changes in the number of OCUs may simply reflect fluctuations in the general population for that
area. The age range employed within the study is from 15 to 64 and where the estimates have been
stratified by age group, these are from 15 to 24, from 25 to 34, and from 35 to 64.
Opiate and/or crack cocaine use (OCU) in 2016/17
At a rate of 11.04 OCU per 1,000 population, Walsall is ranked 47th highest out of 151 English local
authorities.
The chart below compares the OCU prevalence rate in Walsall with its Black Country neighbours and
also the West Midlands and England. Although lower than Wolverhampton and Sandwell, Walsall’s
rate is statistically similar to the Black Country and West Midlands, but significantly higher than
England. The vertical dotted line in the chart shows England’s upper confidence interval, which aids
comparison with other areas.
Walsall’s OCU prevalence population of 1,915 people (rate of 11.04 per 1,000) in 2016/17 has
increased by 9 people since 2014/15, but this is not statistically significant.
Figure 3 OCU prevalence estimates for those aged 15-64 in 2016/17 (with 95% confidence intervals)
Source: Liverpool John Moores University
13The charts below show opiate and crack cocaine rates for Walsall compared to the comparators
used above.
Figure 4 Prevalence estimates for opiate and crack users – rate per 1,000 (aged 15 to 64) with 95% CI
Opiates prevalence Crack Prevalence
Source: Liverpool John Moores University
Below is a summary of Walsall’s prevalence estimates in 2016/17, presented by number of users and
rate per 1,000 of the population.
Table 2 Walsall OCU prevalence estimates 2016/17
Note that the sum of opiate and crack users will not equal OCU users, as OCU indicates the use of
one or both substance categories i.e. they are not mutually exclusive.
OCU age group analysis in 2016/17
The charts below show the estimated number and rate by age group. When looking at the number
of users, there are significantly more over 35’s compared to under 25’s. Interestingly, when looking
at the rate, the most prevalent group is those aged 24-34.
14Figure 5 Prevalence estimates numbers by age group
Figure 6 Prevalence estimate rate (per 1,000) by age group
Source: Liverpool John Moores University
15OCU gender analysis in 2014/15
When analysing Opiate rates (per 1,000) by gender in 2014/15, it is estimated there are almost 4
times more males (15.15) than females (3.89). Gender analysis was not provided in the 2016/17
release of the prevalence estimates.
Alcohol prevalence estimates
The national estimates of alcohol dependence has been updated in November 2018 by the
University of Sheffield, for the financial year 2016/17. It estimates the number of adults (aged 18+)
within each local authority with an alcohol dependency, potentially in need of specialist treatment10.
The table and chart below compare the numbers and rate of estimated alcohol prevalence across
the Black Country local authorities.
Table 3 Alcohol prevalence estimates
Local authority Number of adults Rate per 100 adults
Walsall 3,360 1.6
Wolverhampton 3,565 1.8
Dudley 3,996 1.6
Sandwell 4,421 1.8
Although Walsall has the lowest estimated number of alcohol dependant adults, when converted
into a rate, there is no statistical significance between the Black Country local authorities and
England.
10
https://www.gov.uk/government/publications/alcohol-dependence-prevalence-in-england
16Figure 7 Estimated alcohol dependant adults in 2016/17 (rate per 100)
Source: University of Sheffield
In terms of trend, the estimated number of alcohol dependant adults has increased since 2010, but
for the period between 2010 and 2014, confidence intervals were not calculated, therefore it is not
possible to comment whether this increase is statistically significant.
However, between 2015/16 and 2016/17 the estimated numbers have fallen by 91 to 3,360 which is
not significant. In fact, there is a wide confidence interval around this data, meaning there is the
potential for considerable variation around the average.
Unmet need for alcohol treatment
PHE’s commissioner support pack calculates Walsall’s alcohol unmet need as 83% (95% CI: 79% to
87%), which is similar to England’s 82% (95% CI: 79% to 86%). Walsall’s unmet need is based on 567
clients in treatment (includes alcohol only and alcohol & non-opiate) as a proportion of the local
estimate of 3,360 dependant drinkers. Specific rates of unmet need will however need to be
determined locally.
17Adults (combined drugs and alcohol)
Client characteristics
Numbers in treatment - 2017/18
In 2017/18, NDTMS reported a total of 1,734 adults receiving structured treatment. Individuals can
access treatment for either problematic drug use, alcohol or both. Throughout this report, the four
main substance groups as outlined previously are used. The segmentation of individuals accessing
treatment is presented below.
Most clients in contact with treatment (59%), presented with a problematic use of opiates.
Almost 16% of clients presented with problems with other drugs
Just over a quarter (26%) presented with alcohol as the main problematic substance.
Numbers in treatment – trends
The chart below shows the proportion of clients receiving treatment by substance category, while
the table shows the actual number of clients.
Figure 8 Proportion of adults in treatment (%)
Source: NDTMS View It
18Table 4 Number of adults in treatment
Source: NDTMS View It
Substance use profile (all in treatment)
Substance breakdown of all clients in treatment in 2017/18
The distribution of substances for all individuals in treatment in 2017/18 is shown in Table 5 below.
This substance use profile defines clients by groups of substance use and relates to any use within a
clients' journey. A client may therefore be categorised by one or more groups and as a result the
totals in this table will be greater than the number of clients presented in the previous section. To
prevent deductive disclosure, all numbers under 5 have been supressed.
Table 5 Number and proportion of substances used in 2017/18
Source: NDTMS View It
Table 6 below shows the proportion of substance use by those in treatment, as a trend between
2009/10 and 2017/18.
19Table 6 Substance breakdown proportion of all clients in treatment, by financial year
Source: NDTMS View It
Club drugs and NPS – all in treatment
Club drugs and NPS (New Psychoactive Substances) bring together a number of different substances,
typically used in bars and nightclubs, concerts and parties, before and after going out. The chart
below shows a trend of the proportion of adults in treatment who are using these types of drugs.
Although seeing an increase in recent years of NPS use, the peak in 2016/17 represents only 25
clients. When comparing the proportion of Walsall’s NPS with the West Midlands and England, in
2017/18, they are very similar i.e. Walsall (0.9%), West Midlands (1.1%), England (0.8%).
Figure 9 Club drugs and new psychoactive substances
Source: NDTMS View It
20Age of clients (all in treatment)
The age distribution of all individuals in treatment in 2017/18 is shown in Table 7 below. Age is
calculated on April 1st for clients’ already in treatment at that point or at the start of treatment for
clients starting treatment in the year. The largest group overall is 35-39, but looking at substance
categories, the following is observed:
Opiate – the most prevalent age group is 35-39, but is prominent between 30 and 44.
Non-opiate – is most prevalent in those in their 20’s, slightly fewer in their 30’s and tails off
after 40 years.
Non-opiate and alcohol – is most prevalent for those in their 20’s and 30’s.
Alcohol – clients are spread throughout the various age groups and there are considerably
more, older alcohol clients than any other substance category.
Table 7 Age distribution of all clients in treatment 2017/18 by substance type
Source: NDTMS View It
Age distribution trend
The table below shows the % of clients within each age group, by financial year, for all substance
types combined. It can be clearly seen that clients are now generally older than they were 9 years
ago, in 2009/10.
21Table 8 Proportion of all clients in treatment by age group and year (all substance types)
Source: NDTMS View It
Gender of clients (all in treatment)
Almost three quarters of all clients are receiving treatment for drug-related substances and the
other quarter are alcohol only.
From a total of 1,734 client in 2017/18, there are 490 females (28%) and 1,244 males (72%). A
breakdown by substance category can be seen in the table below.
Table 9 Substance category and gender
Source: NDTMS View It
Ethnicity of clients
Ethnicity - new presentations
Drugs – from a total of 469 new presentations in 2017/18, the most common ethnic groups are
summarised in the table below. Please note, that this is a subset of the data (showing largest
categories) and totals will not equal the 469 total new presentations.
22Table 10 Most common ethnic groups for new drug presentations in 2017/18
Source: Drugs commissioning support pack 2019-20 PHE
Alcohol – from a total of 283 new presentations in 2017/18, the most common ethnic groups are
summarised in the table below. Again, as this is a subset of the data, totals will not equal 283.
Table 11 Most common ethnic groups for new alcohol presentations in 2017/18
Source: Alcohol commissioning support pack 2019-20 PHE
Ethnicity – all in treatment
The tables below show the proportion of clients in treatment by ethic group, self-reported by the
client at the start of their journey. The first table includes all substance types and the second reports
alcohol only clients. A separate table for drug clients has been omitted, as there is very little
difference to the ‘all substance’ table.
Overall, for all clients, since 2009/10, there is very little difference in the proportions represented by
the various ethnic groups. There has been a slight reduction in White clients (86% to 84%) and a
corresponding increase in Asian clients. When looking at the alcohol only table below, we can see
this shift is due to alcohol clients. Between 2009/10 and 2017/18, the proportion of White, alcohol
only clients has reduced from 93% to 87%, with Asian clients increasing from 5% to 10%.
Table 12 Proportion of all clients in treatment by ethnic group (all substances)
23Table 13 Proportion of all clients in treatment by ethnic group (alcohol only clients)
Source: NDTMS View It
Country of origin (new presentations)
Most new clients in 2017/18 (95%, n=711) reported the United Kingdom as their country of origin,
with a very similar representation by substance type i.e. 95% (n=444) for drugs and 94% (n=267) for
alcohol clients. To maintain confidentiality, it is not possible to analyse further11.
Source: Drugs and alcohol commissioning support pack 2019-20
Religion
Religion - new presentations
All substances have been combined here to allow presentation of clients’ religion. A considerable
number of clients (n=120, 16%) didn’t disclose their religion when entering the service during
2017/18. Of those who responded to this question:
Almost half stated no religion (n=347, 46%)
The majority citing a religion considered themselves Christian (n=199, 26%)
5% are Sikh (n=34)
3% are Muslim (n=22)
Source: Drugs and alcohol commissioning support pack 2019-20
Religion – using local data
The table below shows a summary of self-reported religion of all clients receiving structured
treatment, between July 2015 and May 2019; this includes all substance types. In the
‘unknown/other’ category, 30% (n=285) declared no religion, but the majority (n=389, 41%) did not
have religion recorded. Other categories include further categories for unknown and client refusing
to disclose this information.
11
Country of origin not available from local dataset, therefore analysis here limited to new presentations
24Table 14 Religion of adults receiving structured treatment between Jul 2015 and May 2019
Source: CGL
Sexuality
Sexuality – new presentations
Of the total 752 new presentations in 2017/18 for both drugs and alcohol,
84% (n=633) were heterosexual
1% (n=7) were gay/lesbian
1% (n=10) were bisexual
Data for remaining clients were categorised as other, missing/incomplete or not stated/not known.
Source: Drugs and alcohol commissioning support pack 2019-20
Sexuality – using local data
Of all those adults receiving structured treatment (n=958) between July 2015 and May 2019, 66%
(n=632) were heterosexual and very few from other categories (gay/lesbian and bisexual totals
similar to those newly presenting). A large number preferred not to say (n=190, 20%) and a 10%
(n=94) didn’t have their sexuality recorded.
Disability
Disability – new presentations
Drugs – from a total of 469 new presentations in 2017/18, almost three quarters of clients stated no
disability, but 21% (n=100) report some kind of disability as seen in the table below. This equates to
23% of males and 14% females reporting a disability.
25Table 15 Most common disabilities reported for new drug presentations in 2017/18
NB clients may cite disabilities from multiple categories
Source: Drugs and alcohol commissioning support pack 2019-20
Alcohol – from a total of 283 new presentations in 2017/18, 72% reported no disability, while 19%
(n=45) stated some kind of disability as seen in the table below. This equates to 19% of males and
20% of females having a disability.
Table 16 Most common disabilities reported for new alcohol presentations in 2017/18
NB clients may cite disabilities from multiple categories
Source: Drugs and alcohol commissioning support pack 2019-20
Disability – using local data
The table below shows self-reported disabilities for all those adults receiving structured treatment
between July 2015 and May 2019. Clients are able to report zero or more disabilities, therefore the
percentage has been omitted from this data. The majority of clients mention no disability, but out of
those who recorded a disability, mental health difficulties and physical disabilities were prevalent.
26Table 17 Most commonly cited disabilities for all adults receiving structured treatment
Source: CGL
NB clients may cite disabilities from multiple categories
Source of referral into treatment
The source of referral represents the nature of the service that referred the client into substance
misuse treatment or the source which promoted their presentation. The graph below shows the
proportion of clients referred by each category, by financial year. A considerable increase can be
seen in the proportion of referrals from self, family & friends, while at the same time, there is a
reduction in referrals from criminal justice and health and social care services.
27Figure 10 Source of referrals into treatment for new presentations (all substances)
Source: NDTMS View It
The two charts below show referral source trends for opiate and alcohol clients separately. Both
opiate and alcohol clients are seeing an increasing trend in self-referrals, while alcohol clients are
seeing a reduction in the proportion of referrals from health & social care services (from 36% in
2011/12 to 7% in 2017/18).
Figure 11 Source of referrals into treatment for new presentations (opiate and alcohol)
Source: NDTMS View It
28Housing situation
Housing situation represents the (self-reported) housing status of the individuals at the time they
presented to treatment. The table below (for all substance categories) shows a slight, gradual
increase in those experiencing urgent housing problems; currently at 6% in 2017/18. However, for
opiate clients with urgent housing issues, this has increased from 5% (n=17) in 2013/14 to 12%
(n=34) in 2017/18.
Table 18 Housing situation for new presentations, as a proportion (all substances)
Source: NDTMS View It
Walsall has the same proportion of urgent housing problem clients as the West Midlands (6%) and
slightly lower than 8% in England.
A safe, stable home environment enables people to sustain their recovery. Engaging with local
housing and homelessness agencies can help ensure that the full spectrum of homelessness is
understood and picked up: from statutorily homeless, single homeless people, rough sleepers to
those at risk of homelessness.12
Employment status
The graph and table below shows the proportion of self-reported employment statuses as a trend
since 2009/10, at the time they presented. While the proportion of unemployed clients has halved
since 2012/13, the share of long-term sick/disabled have increased from 6% (n=36) to 34% (n=250)
in the same period.
12
Adult drugs commissioner support pack 2019-20
29Figure 12 Employment status for new presentations, as a proportion (all substances)
Source: NDTMS View It
Parental status and safeguarding
Drug clients
Table 19 below shows the number and proportion of drug users who entered treatment in 2017/18
and their parental status. From the 70 new clients living with children, this involved a total of 137
children living with them. Compared to the national average (34%), Walsall (43%, n=202) has a
higher proportion of parents (entering treatment in 2017/18) who don’t live with their children.
Table 19 Parental status of new drug clients in 2017/18
Source: Drugs commissioning support pack 2019-20
Alcohol clients
30Table 20 below shows the number and proportion of new alcohol clients in 2017/18 and it can be
seen that Walsall’s metrics are very similar to England’s proportions. There are 148 children living
with clients who entered treatment in 2017/18. Combining both drugs and alcohol clients entering
treatment in the year, there are a total of 285 children living with these clients.
Table 20 Parental status of new alcohol clients in 2017/18
Source: Alcohol commissioning support pack 2019-20
Safeguarding status using local data
During the last 4 year (up to May 2019), a total of 958 individual adults are recorded as having
received structured treatment (all substance). The safeguarding status of these clients can be seen
in the table below, divided into 2 groups i.e. opiate and all other substances13. Overall, over a third
of clients (n=340, 36%) either currently have safeguarding issues or have done previously. Over a
quarter of all opiate clients (n=201, 27%) are identified as having safeguarding issues.
Table 21 Safeguarding status of all adults in treatment between Jul 2015 and May 2019
Source: CGL
Mental health
Drugs clients
Data in the table below shows there were 199 (42%) drug clients who started treatment in 2017-18
who were identified as having a mental health treatment need. Of those, 140 (70%) were receiving
13
These substances include; alcohol only, non-opiate, non-opiate and alcohol
31treatment from mental health services, which is comparable to 71% nationally. Comparing
prevalence with treatment received can help assess whether need is being met.
Table 22 Mental health of drug clients entering treatment in 2017/18
Source: Drugs commissioning support pack 2019-20
Alcohol clients
Table 23 below shows there were 138 (49%) alcohol clients who started treatment in 2017-18 who
were identified as having a mental health treatment need and, of those, 111 (80%) were receiving
treatment from mental health services, compared to 79% nationally. Comparing prevalence with
treatment received can help assess whether need is being met.
Table 23 Mental health of alcohol clients entering treatment in 2017/18
Source: Alcohol commissioning support pack 2019-20
32Geographic distribution of clients
Using local data from the current service provider, maps of Walsall have been plotted showing which
wards have the highest density of service users. They include all adult clients (18+ years) who have
received structured treatment in Walsall between July 2015 and 7th May 2019. Many of these clients
would have been receiving treatment before July 2015, but this is the referral date recorded after
the transition to the new service provider at the time. All clients in the maps are only counted once,
even if they re-present. Some clients (n=85) were omitted from the maps as the postcode was
either missing or invalid/incomplete.
The maps were created by calculating a crude rate per ward, per 10,000 population. The borough
was divided into quartiles, so both maps could be quickly compared. By comparing quartiles 1 and 4
the lowest and highest wards can be identified. To aid identification, wards have been labelled with
a letter, which corresponds to the equivalent on the deprivation map previously seen.
Two maps are presented, one showing clients in treatment for all substance types and another
showing opiate only clients. As the majority of Walsall’s clients are receiving structured treatment
for opiate use, it is not possible to create separate maps for alcohol and non-opiate users, due to the
relatively low numbers.
Figure 13 Clients residential
ward density (all substances)
N = 873
33Figure 14 Clients residential
ward density (opiate only)
N = 666
Source: CGL
© Crown copyright and database rights 2019 Ordnance Survey 100019529
Access to services - Waiting times
This represents the number of weeks from referral for an initial treatment intervention to the time
when that intervention was available to start. For the last 2 years (2016/17 to 2017/18) Walsall has
reached 100% of all clients being seen within a 3 week period. (Source: NDTMS View It). In the last 7
years (since 2011/12), not one client has waited over 6 weeks for the intervention to start.
Treatment and recovery outcomes
Treatment exits
The two tables below show the proportion and numbers of clients who exit treatment, as a trend
since 2009/10. These exit reasons categories represent the reason for discharge, given at the point
of final exit from a treatment journey (with no further treatment beginning within 3 weeks).
The data shows a considerable increase in the number and proportion of clients dropping out of
treatment and this trend can be seen across all 4 substance categories in the tables below. This
increase has an unfavourable influence on the successful completion proportion, although the
number of clients successfully completing have almost doubled since the reduction in 2015/16.
Client deaths will be discussed in a later section.
34Table 24 Proportion of clients who exit treatment (all substances)
Table 25 Number of clients who exit treatment (all substance)
Table 26 Number and proportion of clients who exit treatment in 2017/18 by substance type
Source: NDTMS View It
*Value suppressed due to low numbers
Although Walsall’s dropout rates have increased in recent years, this does follow a similar trend in
the West Midlands region and England, which can be seen below.
35Figure 15 Proportion of clients who dropped out/left (all substance categories)
Source: NDTMS View It
In the six years up to 2014/15, Walsall’s successful completions were consistently higher than the
West Midlands and England proportions. Between 2014/15 and 2015/16, Walsall’s proportion
dropped from 55% to 34% and as of 2017/18 is still below the comparators mentioned previously.
Figure 16 Proportion of clients who successfully completed (all substance categories)
Source: NDTMS View It
NB the y-axis on the above chart does not start at zero
36Successful completions – as proportion of all in treatment
Drugs clients
The tables below show the proportion of drug users who successfully completed their treatment as a
proportion of all those in treatment. This shows a positive improvement for all combined drug
categories, with opiate completions just below the national average in 2017/18. Interesting to note
the gender difference, with female successful completions rates higher than males across all drug
categories.
Figure 17 Successful drug completions as a proportion of all in treatment
Source: Drugs commissioning support pack 2019-20 PHE
Alcohol clients
The tables below show the proportion of alcohol users who successfully completed their treatment
as a proportion of all those in treatment.
Table 27 Successful alcohol completions as a proportion of all in treatment 2017/18
Source: Alcohol commissioning support pack 2019-20 PHE
From the chart below, a clear improvement can be seen for Walsall’s alcohol successful completions,
increasing from a year low point of 26% in June 2017 to 34.9% in March 2018. While the England
average is consistent at 40% throughout the year, the gap with Walsall is narrowing.
37Figure 18 Successful alcohol completions as a proportion of all in treatment as a trend
Source: NDTMS adult successful completions and re-presentations reports
Each point on the chart is a rolling 12 months value, with July being an estimate (due to NDTMS data
cleansing).
More recent NDTMS data, which are currently restricted, indicate that Walsall’s successful
completions are improving and are now on par with regional and national averages.
Successful completions and not re-presenting
This details the number of clients that successfully completed their treatment (free of dependence)
who do not then re-present to treatment again within 6 months.
Individuals achieving this outcome demonstrate a significant improvement in health and well-being
in terms of increased longevity, reduced blood-borne virus transmission, improved parenting skills
and improved physical and psychological health.14
It aligns with the ambition of both public health and the Government's drug strategy of increasing
the number of individuals recovering from addiction. It also aligns well with the reducing re-
offending outcome [PHE Indicator 1.13] as offending behaviour is closely linked to substance use and
it is well demonstrated that cessation of drug use reduces re-offending significantly. This in turn will
have benefits to a range of wider services and will address those who cause the most harm in local
communities.
The chart below shows that Walsall successful completions are statistically significantly lower than
England. Recent trends show opiate successful completions are reducing, but non-opiate and
alcohol are improving.
14
PHE’s PHOF indicator rationale
38More recent data, which is currently restricted, show that all 3 indicators are improving for Walsall,
with opiate and alcohol clients on or near the national benchmark.
Figure 19 PHOF indicators for successful completions 2010 to 2017
Source: PHE Public Health Outcomes Framework 15
Residential Rehabilitation and Detoxification
The treatment service in Walsall offers community based and ambulatory detoxification, where this
is clinically possible. In situations where it is not possible, service users are placed in residential in-
patient units for detoxification and rehabilitation. There were 49 alcohol detoxification placements
in 2017/18, and 2 drug detoxifications. There were 5 placements where detoxification was followed
up by an extended programme of rehabilitation.
The trend over the past 5 years has seen an increase in alcohol detoxification, while in-patient
referrals for opiate use has remained at a low level. Rehabilitation stays have also declined.
There are local options for in-patient placements at present and this has reduced the number that
have had to be placed further afield significantly, in recent years.
Drugs clients
Walsall had 18 adult drug users in 2017/18 who have been to residential rehabilitation during their
latest period of treatment16. This is 1% of the whole treatment population compared to the
equivalent 2% when compared nationally. Drug treatment mostly takes place in the community,
near to users’ families and support networks. Residential rehabilitation may be cost effective for
someone who is ready for active change and a higher intensity treatment at any stage of their
15
https://fingertips.phe.org.uk/profile/public-health-outcomes-framework
16
Drugs commissioning support pack 2019-20 PHE
39treatment, and local areas are encouraged to provide this option as part of an integrated recovery-
orientated system.
Alcohol clients
There were 22 alcohol clients in 2017/18 who have been to residential rehabilitation during their
latest period of treatment17. This is 5% of the local alcohol treatment population compared to 3%
nationally. Structured alcohol treatment mostly takes place in the community, near to users’
families and support networks. However, in line with NICE recommendations, a stay in residential
rehabilitation is appropriate for the most serious cases, and local areas are encouraged to provide
this option as part of an integrated recovery-orientated system.
Health protection & harm reduction
Injecting behaviour
The injecting behaviour at time of presentation, represents whether the client has injected in the
last 30 days (categorised as current), previously or never. In 2017/18, three quarters (76%, n=567)
of all new presentations (all substance) had never previously injected, 13% (n=95) had previously
injected and 12% (n=87) were currently injecting.
The graph and table below shows injecting behaviour trends for opiate only clients in Walsall, as a
proportion. There has been a recent increase in the proportion of current injectors, from 19%
(n=59) in 2015/16 to 29% (n=83) in 2017/18. This is higher than the West Midlands and England’s
proportion, both at 26% (opiate current injectors at new presentation).
17
Alcohol commissioning support pack 2019-20 PHE
40Figure 20 Injecting behaviour for new opiate presentations
Source: NDTMS View It
Sharing of injecting equipment is the single biggest factor in blood-borne virus transmission among
individuals who use and inject drugs, it also elevates the risk of premature mortality18.
Blood borne virus status
Sharing injecting equipment can spread blood-borne viruses. Providing opioid substitution treatment
(OST), sterile injecting equipment and antiviral treatments protects people who use drugs and
communities, and provides long-term health savings. Eliminating hepatitis C as a major public health
threat requires the identification and treatment of many more infected people who use drugs.
Hepatitis C testing and referral data will vary from area to area depending on local systems and
pathways, the availability of test results to providers and where/how hep C treatment is provided, so
it needs to be assessed and understood locally more than compared to national figures.
18
Adult substance misuse statistics from NDTMS 2017-18
41Table 28 Blood-borne virus status for new presentations in 2017/18
Source: Drugs commissioning support pack 2019-20 PHE
Drug related deaths
The definition of a drug misuse death is where either the underlying cause of death is drug
abuse/drug dependence or the underlying cause is drug poisoning from any substance controlled
under the Misuse of Drugs act 197119.
In England and Wales, most drug-related deaths are certified by a coroner following an inquest and
cannot be registered until the inquest is completed. This can take months or even years before the
death is registered. In line with other mortality statistics, drug-related death figures are based on
deaths registered in a particular year, rather than those occurring each year. This allows more timely
publications, but can make trends difficult to interpret, especially for smaller geographical areas20.
According to the latest ONS report 20, the majority (80%) of drug-related deaths nationally are from
accidental poisoning.
Drug-related deaths is included as an indicator within the Public Health Outcomes Framework
(PHOF) and Figure 21 below shows how Walsall compared with England between 2001-03 and 2015-
17. Walsall has seen an increasing trend since 2011-13 and currently has a rate of 5.1 deaths per
100,000 compared to England’s 4.3. Although higher than both the West Midlands and England,
Walsall’s rate is not statistically significant.
19
http://www.legislation.gov.uk/ukpga/1971/38/contents
20
ONS, Deaths related to drug poisoning in England and Wales: 2017 registrations
42You can also read