The Fast-Food Industry and COVID-19 in Los Angeles - March 2021 - UC ...
←
→
Page content transcription
If your browser does not render page correctly, please read the page content below
The Fast-Food Industry and
COVID-19 in Los Angeles

Prepared for                                              March 2021
The Los Angeles County Department of Public Health
     The Fast-Food Industry and COVID-19 in Los Angeles       1
Table of Contents
About the Organizations                                             1

Executive Summary                                                   2

Introduction                                                        3
       About this study                                             4

The Precariousness of Fast Food                                     5
       Labor Issues in Fast Food                                    5
       Public Cost of Low Pay in the Fast-Food Industry             7

COVID-19 Risks and the Worksite                                     9
      Fast-Food Worksites and Risk of Transmission                  9
      COVID-19 Inspections and Outbreaks                            10

COVID-19 Risks and Worker Characteristics                           12
      Worker and Household Characteristics                          13
      Wages and Income                                              16
      Work Hours                                                    18
      Health Insurance                                              19

Conclusion                                                          20

Appendix A: Detailed Methodology                                    21

Appendix B: Data Tables for Los Angeles and California, 2017–2019   22

Acknowledgments                                                     27

Notes                                                               28
About the Organizations
UC Berkeley Labor Center
The UC Berkeley Labor Center is a public service project of the UC Berkeley Institute for Research on Labor and
Employment that links academic resources with working people. Since 1964, the Labor Center has produced
research, trainings, and curricula that deepen understanding of employment conditions and develop diverse
new generations of leaders.

UCLA Labor Center
For more than 50 years, the UCLA Labor Center has created innovative programs that offer a range of educational,
research, and public service activities within the university and in the broader community, especially among low-
wage and immigrant workers. The Labor Center is a vital resource for research, education, and policy development
to help create jobs that are good for workers and their communities, to improve the quality of existing jobs in the
low-wage economy, and to strengthen the process of immigrant integration, especially among students and youth.

UCLA Labor Occupational Health and Safety Program (LOSH)
LOSH promotes safe and healthy workplaces through worker training and education, research, technical assistance,
and policy analysis. LOSH initiatives focus on workers in high-hazard industries and low-wage jobs and those who are
vulnerable by virtue of immigration status, language, or employment status. LOSH strives to reduce occupational
health disparities and environmental injustice through direct worker engagement, leadership development, and
capacity building. LOSH is part of the UCLA Center for Occupational and Environmental Health and the UCLA
Institute for Research on Labor and Employment.
UC Berkeley Labor Occupational Health Program (LOHP)
LOHP’s mission is to promote safe, healthy, and just workplaces and to build the capacity of workers and worker
organizations to take action for improved working conditions. LOHP looks broadly at the impact of work on
health, and we advance the principle that healthy jobs—that pay a living wage, provide job security and benefits,
protect against hazards and harassment, have reasonable workloads, and engage workers in the decisions that
affect them—are a basic human right. As a university-based public health program, LOHP accomplishes its
mission by providing training to effectively engage workers and worker organizations in advocating for better
working conditions; conducting research to evaluate the effectiveness of interventions, document the impact of
health and safety hazards, and identify policy solutions; and supporting development of protective policies that
integrate public health research and expertise. LOHP is part of the Center for Occupational and Environmental
Health at UC Berkeley.

The Fast-Food Industry and COVID-19 in Los Angeles                                                                 1
Executive Summary
Over the last decade, fast-food restaurants have proliferated in the United States, with the largest increase in
Los Angeles County. Fast food is an integral part of the food sector in Los Angeles, comprising nearly 150,000
restaurant workers. This report investigates working conditions in fast food prior to the pandemic, profiles the
industry’s demographics and cost to the public, and examines the impact of COVID-19 on the sector.
Even before COVID-19, the fast-food sector was characterized by difficult working conditions and high public costs.
    1. Fast-food workers faced labor issues related to safety and injury, workplace violence, harassment, retal-
       iation, and wage theft.
    2. The franchise model, which predominates in fast food, incentivized labor violations.
    3. Fast food’s low wages have made it difficult for workers to meet their basic needs. More than two-thirds
       of the families of fast-food workers in Los Angeles County were enrolled in a safety net program at a
       public cost of $1.2 billion a year.
Because workplaces are a common vector of COVID-19 transmission, fast-food worksites are particularly vulnerable.
    1. One-third of fast-food worksites had 20 or more employees, suggesting shared equipment, work spaces,
       bathrooms, and break areas. Other research found that food workers work in moderately close to close
       proximity; cooks in particular have had the highest increase in mortality of any occupation during the
       pandemic.
    2. Worker testimony and complaints show COVID-19 outbreaks and employer failures to communicate
       these outbreaks to workers.
Fast-food workers and their communities face a disproportionate risk of COVID-19 transmission and its negative
impacts.
    1. Black, Latinx, and Asian populations had disproportionately higher rates of infection, hospitalizations,
       and deaths. Nine in ten fast-food workers in Los Angeles were workers of color, and nearly three-quarters
       were Latinx.
    2. Women in fast food were already vulnerable to sexual harassment, and that has been exacerbated by
       COVID-19. Nearly seven in ten fast-food workers were women.
    3. Though fast-food workers skewed young, over two-thirds lived in households with four or more people,
       and a third included household members over age 55.
    4. The majority of fast-food workers earn low wages, often at or near the minimum wage, but research
       indicates those wages constituted 40% of their family’s total income.
    5. Fast-food workers were twice as likely as other workers to fall below the federal poverty line, and over
       half of those who rent their housing were rent-burdened, spending over 30% of their household income
       on rent and utilities.
    6. Fast-food workers were one and half times more likely to be uninsured and two and a half times more
       likely to be enrolled in Medi-Cal than Los Angeles workers as a whole. Only a third of fast food work-
       ers received some type of employer-sponsored insurance.

The Fast-Food Industry and COVID-19 in Los Angeles                                                                2
Introduction
An economic juggernaut in the United States, the number of fast-food restaurants—defined as establishments
that provide food service where patrons generally order or select items and pay before eating1—increased 9%
nationwide and more than 50% in 163 counties between 2009 and 2014. Forty of California’s 58 counties increased
their number of fast-food restaurants, with the highest increase in the nation in Los Angeles County. While the
county’s population rose by only 3%, the number of fast-food restaurants increased by 10%.2
The restaurant sector is an integral part of the Los Angeles landscape. In 2019, fast food employed 4.5 million
people nationwide,3 including nearly 550,000 Californians and 150,000 Angelenos.4 The restaurant sector made
up a tenth of the overall county workforce, and over a third of Los Angeles’s restaurant workers were employed
in fast food.
Figure 1. Number of Los Angeles workers in food and all sectors, 2019
All sectors
Sector
3,934,240
Table X. Number of Los Angeles workers in food and all sectors, 2019
No. of workers
All sectors Food services and drinking places
3,934,240
Food services and drinking places
Limited-service fast-food restaurants
397,933
397,933
147,683
Source: Quarterly Census of Employment and Wages, 2019.
Limited-service fast-food restaurants
147,683
Source: Quarterly Census of Employment and Wages, 2019.
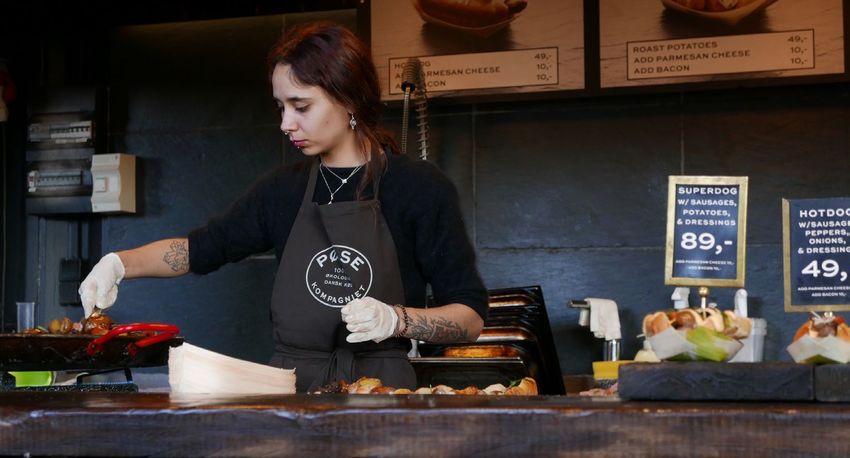
Research has shown that fast-food workers face injury, workplace violence, harassment, and wage theft. The
media covered more than 700 incidents of workplace violence at McDonald’s alone between 2017 and 2019.5 One
survey reported that 87% of fast-food workers were injured on the job at least once in the previous year, while
12% were assaulted.6 Another report showed above average occurrences of sexual harassment,7 and class action,
sexual harassment lawsuits against fast-food companies abound.8
COVID-19 exacerbates the risks already faced by fast-food workers. In Los Angeles, several high-profile failures
to comply with COVID-19 workplace regulations point to the severity of violations and paucity of protection for
speaking out. Workers at a McDonald’s in Boyle Heights filed seven complaints after six coworkers contracted the
virus, alleging failure to enforce face coverings and social distancing or provide personal protective equipment
(PPE). Workers have since claimed retaliation for reporting these violations.9
The fast-food industry is characterized by franchise models that create a layer of separation, or “fissure,” between
workers and the companies responsible for their working conditions. Franchisors exercise “vertical restraints”—key
elements in how chains operate such as prices, customer rules, and suppliers—but franchisors are not liable for
what happens at individual sites.10 As in other fissured workplaces characterized by contracting, franchising, or
staffing agencies, labor violations are common. Franchising, in particular, frustrates enforcement. One study of
the top 20 fast-food franchises showed that franchisee-owned restaurants had higher levels of noncompliance
The Fast-Food Industry and COVID-19 in Los Angeles 3
with minimum wage and overtime rates than their counterparts that are owned and managed by the franchisor.
The study attributed this to the incentives built in to the franchise model that promote noncompliance, including
a profit squeeze due to franchise royalties, the relative unlikelihood of discovery because the average franchisee
owns just a single establishment, less commitment to upholding brand reputation, and a corporate management
structure that rewards productivity over labor standards compliance.11 Historically, the top 20 franchised fast-
food restaurants have an outsized effect on the industry as a whole, accounting for nearly 68% of annual sales
in limited-service restaurants, so we can safely infer that the franchise model in fast food contributes to poor
working conditions and higher rates of noncompliance with labor standards.

About this Study
The first of two reports on working conditions in the fast-food industry, conducted on behalf of the Los Angeles
County Board of Supervisors, this report provides a profile of fast-food workers in Los Angeles County and
conditions for workers during the COVID-19 pandemic. We provide relevant demographic and government
data, a literature review, and a review of existing surveys and data. The first section, based on past research and
government data, outlines labor issues in the sector as well as data on the public costs of low wages. The second
section provides an overview of fast-food worksites, inspections, and outbreaks. The third section uses census
data to demonstrate how select individual and household characteristics coincide with the disproportionate
impact of COVID-19 on particular communities. The second report, to be released in summer 2021, will provide
the results of surveys and interviews on the working conditions and experiences of fast-food workers.

The Fast-Food Industry and COVID-19 in Los Angeles                                                               4
The Precariousness
of Fast Food
This section explores existing research on labor issues and the public costs associated with low wages in the sector.
Though large-scale studies on fast food are limited, the available research has documented various difficult and
dangerous working conditions prior to the COVID-19 pandemic.

Labor Issues in Fast Food
The following presents key research findings from studies that highlight the issues workers face in the sector,
such as wage theft, retaliation, and harassment.
 Wage Theft       In a 2014 survey of 1,088 fast-food employees nationwide, 90% of respondents
                  reported that they had been forced to work off the clock, denied breaks, or
                  refused overtime pay. In Los Angeles, that study found that 81% of respondents
  Wage Theft      experienced wage theft, and 59% were forced to work off the clock.12 These find-
                  ings reflect a 2010 representative survey of low-wage workers in Los Angeles. In
 In a 2014 surveyaofbroader
                      1,088 fast-food
                               categoryemployees    nationwide,
                                         of restaurants         90%67%
                                                         and hotels, of respondents  reported
                                                                          were not paid        that79%
                                                                                         overtime,  they had
 been forced to work     off the clock, denied  breaks, or refused overtime pay. In Los Angeles, that
                  worked off the clock, and 82% were denied meal breaks.13 In 1,768 investigations    study
 found that 81% of   respondents
                  at 20             experienced
                         fast food franchises     wage theft,
                                                between   2001and
                                                               and59%  were
                                                                    2005,   forced
                                                                          40%       to work offminimum
                                                                               had confirmed    the clock.12 These
 findings reflect wage
                  a 2010orrepresentative   survey of
                             overtime violations.  14 low-wage workers in Los Angeles. In a broader category
 of restaurants and hotels, 67% were not paid overtime, 79% worked off the clock, and 82% were denied
 Sexual Ha- 13 Restaurant workers have the highest rates of sexual harassment of any industry.
 meal breaks. In 1,768 investigations at 20 fast food franchises between 2001 and 2005, 40% had confirmed
 rassment         They filed over a third of the 170,000 sexual harassment complaints with the
 minimum wage or overtime violations.14
                  US Equal Employment Opportunity Commission between 1995 and 2016, and
                  that total is almost certainly an undercount. Further, there is a correlation be-
                  tween racial discrimination and sexual harassment for women in the restaurant
                  industry.15 High-profile sexual harassment lawsuits against fast-food companies
                  abound.16 A 2016 survey of 1,217 women in the industry found that 40% of
                  women experienced unwanted sexual behaviors on the job, including 28% who
                  suffered multiple forms of harassment.17 The most common forms of harass-
                  ment were sexual teasing, jokes, remarks, or questions; hugging or touching; and
                  questions about sexual interests or unwanted information about others' sexual
                  interests.
 Safety           Fast-food workers face hazards such as burns, slips and falls, and exposure to
                  harmful chemicals, leading to exceptionally high rates of workplace injury. One
                  report showed that 87% or workers were injured at least once on the job in the
                  previous year.18 In a 1999 study, the National Institute for Occupational Safety
                  and Health estimated that 28,224 teenage fast-food workers went to the emer-
                  gency room for a workplace injury over a two-year period.19

The Fast-Food Industry & COVID-19 in Los Angeles                                                                     5
Safety
 Violence       Fast-food workers experience physical assault, harassment, intimidation, threats,
                and verbal abuse, especially in restaurants that are open all night. One study that
                analyzed
 Fast-food workers         721 instances
                    face hazards             of violence
                                  such as burns,          at McDonald’s
                                                    slips and                 nationwide
                                                                falls, and exposure         foundchemicals,
                                                                                      to harmful   that the shiftleading to
                from 10 p.m. to 4 a.m. accounted for 40% of those episodes. Another study esti-
 exceptionally high rates of workplace     injury. One  report   showed     that 87% of workers
                                                                                         20       were    injured  at least
 once on the jobmated
                 in the that 12% year.
                        previous   of all fast-food
                                        18
                                                      workers
                                           In a 1999 study,   thehave    beenInstitute
                                                                   National    assaulted
                                                                                       foron  the job.
                                                                                           Occupational21    Safety and
 Health estimated
 Retaliation    In the 2016 survey of women who experienced sexual harassment, only 40%emergency
                   that, over a two-year     period,  28,224   teenage    fast-food workers    went to  the    nts.
 room for a workplace  injury over  a two-year     period. 19
                Of those, onetaliation, including reduced hours, schedule changes, and termina-
                  tion. Women of color were especially likely to experience negative consequences
                  in response to reporting sexual harassment; 34% of Black women and 26% of
                  Latinas reported at least one instance of retaliation in response to their com-
  Violence plaints,        compared with 17% of White women.22 In one high-profile case, 5,000
                  McDonald’s employees in 100 establishments in Florida faced assaults, groping,
 Fast-food workersandexperience
                       sexually charged
                                  physicalcomments.     Managersintimidation,
                                            assault, harassment,   repeatedly failed to act,
                                                                                threats, andand    oneabuse,
                                                                                              verbal     em- espe-
                  ployee  was  eventually  terminated   after reporting the behavior. 23
                                                                                         A  2019  survey      of
 cially in restaurants that are open all night. One study that analyzed 721 instances of violence at McDonald’s
 nationwide found 539that
                       fast-food workers
                          the shift from 10inp.m.
                                               NewtoYork
                                                     4 a.m.City found that
                                                            accounted      half had
                                                                       for 40%       beenepisodes.
                                                                                of those   fired, laid20 off,
                                                                                                         Another
                  or compelled   to  quit and  65%  of those  terminated  were  not
 study estimated that 12% of all fast-food workers have been assaulted on the job.  given
                                                                                       21 a reason. In a

                  subsample of that study, 58% reported drastic, unexpected scheduling cuts.24

  Sexual Harassment
 Restaurant workers have the highest rates of sexual harassment of any industry. They filed over a third
 of the 170,000 sexual harassment complaints with the US Equal Employment Opportunity Commission
 between 1995 and 2016, and that total is almost certainly an undercount. Further, there is a correlation
 between racial discrimination and sexual harassment for women in the restaurant industry.15 High-profile
 sexual harassment lawsuits against fast-food companies abound.16 A 2016 survey of 1,217 women in the
 industry found that 40% of women experienced unwanted sexual behaviors on the job, including 28%
 who suffered multiple forms of harassment.17 The most common forms of harassment were sexual teas-
 ing, jokes, remarks, or questions; hugging or touching; and questions about sexual interests or unwanted
 information about others’ sexual interests.

  Retaliation
 In the 2016 survey of women who experienced sexual harassment, only 40% filed complaints. Of those,
 one in five experienced retaliation, including reduced hours, schedule changes, and termination.
 Women of color were especially likely to experience negative consequences in response to reporting
 sexual harassment; 34% of Black women and 26% of Latinas reported at least one instance of retaliation
 in response to their complaints, compared with 17% of White women.22 In one high-profile case, 5,000
 McDonald’s employees in 100 establishments in Florida faced assaults, groping, and sexually charged com-
 ments. Managers repeatedly failed to act, and one employee was eventually terminated after reporting the
 behavior.23 A 2019 survey of 539 fast-food workers in New York City found that half had been fired, laid off,
 or compelled to quit, and 65% of those terminated were not given a reason. In a subsample of that study,
 58% reported drastic, unexpected scheduling cuts.24
Public Cost of Low Pay in the Fast-Food Industry

The Fast-Food Industry & COVID-19 in Los Angeles                                                                              6
The majority of fast-food workers live in households experiencing economic precarity. Just one in three
fast-food workers in Los Angeles received health benefits through an employer.25 When employers did
not pay high enough wages to meet basic needs, workers turned to public safety net programs to make
ends meet.
We analyzed fast-food worker family enrollment in one or more major public safety net programs:
Medi-Cal, Children’s Health Insurance Program (CHIP), the federal Earned Income Tax Credit (EITC),
Supplemental Nutrition Assistance Program (SNAP), and Temporary Aid For Needy Families (TANF) Cash
Assistance.26 Two-thirds of fast-food workers in both Los Angeles County and the state of California as a
whole were themselves or had a family member who was enrolled in one of the five safety net programs,
at an average public cost of $1.2 billion in Los Angeles County and $4 billion statewide.27 Half or more of
the families of Los Angeles fast-food workers participated in EITC and adult Medicaid, and close to 3 in
10 were in the food stamp program, now known as SNAP.
A recent national study of public safety net use by low-wage workers found little difference between
those working only 10 hours a week and full-time workers.28 We can infer from this that while the right to
receive a minimum number of work hours is an important issue for many fast-food workers, the primary
driver of low earnings is the hourly wage. Improving wages for fast-food workers would assist families in
moving toward greater self-sufficiency.

Table 1. Fast-food workers with family members participating in health care and public
assistance programs, Los Angeles, 2015–2019

Table X. Fast-food workers with family members participating in health care and public assistance
                                                                           Average annual total
programs, Los Angeles, 2015–2019
                         Number of workers with   % of workers with a
                                                                                                             spending on fast-food
                                      a participating family               participating family
                                                                                                               workers’ families
                                             member                              member
                                                                                                                  ($ million)

 Any program                                 110,000                                  68                               1,150
 EITC                                        80,000                                   51                                190
 SNAP                                        50,000                                   29                                120
 Adult Medicaid                              80,000                                   50                               700
 Children’s Medicaid
 and CHIP
                                              30,000                                  22                                 120
 TANF                                         10,000                                   5                                 30
Source: Authors’ calculations based on the 2015–2019 American Community Survey, 2016–2020 March Current Population Survey, 2019
Occupational Employment Statistics, and administrative data from Medicaid, CHIP, EITC, SNAP, and TANF programs.
Note: The analysis is restricted to fast-food workers who work at least 27 weeks in a year and 10 or more hours per week. The cost
figures are in 2019 dollars.

Table X. Fast-food workers with family members participating in health care and public assistance

The Fast-Food Industry and COVID-19 in Los Angeles                                                                                   7
Table 2. Fast-food workers with family members participating in health care and public assistance programs,
California, 2015–2019

programs, California, 2015–2019                                                                              Average annual total
                                    Number of workers with                % of workers with a
                                                                                                            spending on fast-food
                                     a participating family               participating family
                                                                                                              workers’ families
                                            member                              member
                                                                                                                 ($ million)

 Any program                                 370,000                                 66                               3,950
 EITC                                        270,000                                 48                                660
 SNAP                                        150,000                                 27                                390
 Adult Medicaid                              270,000                                 48                               2,440
 Children’s Medicaid
 and CHIP
                                             110,000                                 20                                380
 TANF                                         20,000                                   4                                90
Source: Authors’ calculations based on the 2015–2019 American Community Survey, 2016–2020 March Current Population Survey, 2019
Occupational Employment Statistics, and administrative data from Medicaid, CHIP, EITC, SNAP, and TANF programs.
Note: The analysis is restricted to fast-food workers who work at least 27 weeks in a year and 10 or more hours per week. The cost
figures are in 2019 dollars.

The Fast-Food Industry and COVID-19 in Los Angeles                                                                                   8
COVID-19 Risks
and the Worksite
Between their sheer number and high customer volume, fast-food restaurants pose a particular risk of widespread
COVID-19 transmission. In 2018, there were nearly 9,000 fast-food establishments in Los Angeles, making up 39%
of all restaurants and 3% of all establishments in the county. As restaurants that rely on indoor seating and dine-in
service have shuttered or been temporarily closed under stay-home orders, fast food has likely increased its
share of the market, making its compliance with COVID-19 orders critical to preventing community transmission.
Figure 2. Number of establishments in Los Angeles County, select sectors, 2018
Figure X. Number of Establishments in Los Angeles County, select sectors, 2018
All sectors
280,826
Food services and drinking places
Source: US Census Bureau’s County Business Patterns, 2018.
22,668
Limited-service fast-food restaurants
8,941
Source: US Census Bureau’s County Business Patterns, 2018.
Fast-Food Worksites and Risk of Transmission
Workplaces are a common vector of COVID-19 community transmission, and service jobs such as fast food are
especially vulnerable.29 Cooks have the highest increased mortality rate of any occupation during the pandemic,
and mortality among Latinx workers in food and agriculture is 59% higher than prepandemic rates.30 In one recent
survey, 44% of food service workers reported that one or more of their coworkers had contracted the virus, 84%
worked within six feet of at least one person not wearing a mask, and 54% interacted with ten or more unmasked
people in one shift. Disturbingly, 37% reported no mandatory training on COVID-19 safety protocols, and only
28% of employers provided paid tests and time off to quarantine for employees with possible COVID-19 exposure.
Fifty-eight percent of workers surveyed felt reluctant to enforce COVID-19 safety protocols.31 In another COVID-
19 survey from March–April 2020, fast-food workers reported limited protective measures in their workplaces:
new workplace cleaning procedures (58%), gloves available (55%), gloves required (30%), masks available (4%),
and masks required (4%).32
The Fast-Food Industry and COVID-19 in Los Angeles 9A recent report from the UC Berkeley Labor Center showed that half of those working in food preparation and
serving occupations work in “very close proximity” and the other half in “moderately close proximity” to other
workers.33 It found that one-third of Los Angeles’s fast-food establishments had more than 20 employees at an
individual worksite, suggesting shared equipment, work spaces, bathrooms, and break areas. Such close quarters
necessitate strict adherence to social distancing, sanitation, and the PPE protocols outlined by the Los Angeles
County Department of Public Health (LACDPH).34
Figure 3. Establishment size for limited-service restaurants
30
27%
25 26%
25%
Table X. Establishment Size for Limited-Service Restaurants
20
15 16%
10
5 5%
< 1%
Source: US Census Bureau’s County Business Patterns, 2018.
0 < 5 employees 5–9 employees 10–19 20–49 50–99 100–249
employees employees employees employees
Source: US Census Bureau’s County Business Patterns, 2018.
COVID-19 Inspections and Outbreaks
A Los Angeles Times reporter, who recently reviewed more than 1,600 complaints in fast food filed with the
federal Occupational Safety and Health Administration along with 200 records and accounts, reported a pattern of
pressure to work at all costs, insufficient PPE and training, and a lack of interpretation and translation of COVID-19
protocols. As of January 15, 2021, inspectors had visited only 56 fast-food restaurants nationwide, opened 600
cases, and closed 1,000 others. Complaints from 37 other states found recurring allegations, including failure to
provide PPE or enforce social distancing in crowded restaurants and little or no provision of sick time.35
An LACDPH inspection in the summer of 2020 of more than 2,000 restaurants found widespread noncompliance
with protocols requiring physical distancing (33%) and face coverings (44%).36 Data on worksite outbreaks that
the County has made available on its website have shown at least 59 COVID-19 outbreaks in fast-food restaurants
affecting as many as 338 workers from July through December 2020. (LACDPH defines and reports outbreaks
as 3 or more COVID-19 cases among employees within a 14-day period.) The median outbreak size among these
establishments was 5 employees. The largest outbreaks occurred at 3 McDonald’s locations in East Los Angeles
(14 cases), Baldwin Park (12 cases), and Pico Rivera (12 cases), as well as a Chipotle in Baldwin Park (13 cases) and a
Poquito Mas in Studio City (12 cases). During the same period, LACDPH issued citations to 4 fast-food establish-
ments for failure to comply with county health officer orders.37
The Fast-Food Industry and COVID-19 in Los Angeles 10The number of outbreaks reported by LACDPH during this period is likely to be an undercount. The Service Employees International Union (SEIU) supplied us with 39 complaints they filed with LACDPH regarding health officer order violations and COVID-19 cases at 21 fast-food establish- ments in Los Angeles, and only one of these was on the LACDPH’s list of worksites with outbreaks. Often workers are unable to ascertain the actual number of COVID-19 infections because employers do not disclose when employees test positive. At a McDonald's in Littlerock, California, for example, a total of 32 cases of COVID-19 have been linked to the restaurant, including instances of workers passing the virus to members of their households. In eight complaints filed with Cal/OSHA and LACDPH, workers detailed troubling conditions, including management attempts to hide infections and pressure workers to work while sick, a lack of social distancing, and failure to conduct adequate wellness checks of workers before they clock in. Workers have waged several strikes at this location to demand improved safety protocols, but strikers have faced retaliation and had their hours cut. In a January 8, 2021, filed by SEIU with both Cal/OSHA and LACDPH, a worker wrote, "Even though there have been many cases of COVID-19 among coworkers at this McDonald’s, I have never been notified that I was in close contact with anyone. This does not make sense to me because I work in the kitchen, and the kitchen is small, so we cannot maintain physical distance. And [others] also work in the kitchen with me, and they all had COVID-19." As the Cal/OSHA Standards Board was considering a temporary statewide emergency standard for COVID-19 protections in the workplace during the summer and fall of 2020, workers testified publicly before the agency about employers’ failure to communicate and report outbreaks. According to one worker from a McDonald’s in Los Angeles, “Over the past few weeks I have heard about two cases of COVID-19 from management, but I have also heard about another four cases from my coworkers. I am concerned that McDonald's is not being open about who is sick in our store and who might have been exposed.”38 A worker from another Los Angeles fast-food establishment raised similar concerns: “These rules are very important for the fast-food industry because the fast-food chains have not complied with the rules—not even with basic rules such as wearing masks, social distancing, or sick pay. At the place that I work, six people were sick with COVID-19, and the employer did not disclose this to us. We had a strike at the store, and instead of listening to our concerns, they terminated us.”39 The Fast-Food Industry and COVID-19 in Los Angeles 11
COVID-19 Risks and
Worker Characteristics
The results of the interplay between essential workers, household size, race, and income are nowhere more
obvious or devastating than Los Angeles. Low incomes and limited paid time off require essential workers to
continue working, while larger households make social distancing difficult or impossible. A growing body of
data demonstrates the predictable effects, which include gross inequities in COVID-19 infection rates and delays
between the implementation of social distancing measures and their effects, devastating communities with high
concentrations of essential workers.40 One in five Boyle Heights residents has contracted COVID-19, compared
to only one in twenty-five residents of Brentwood.41
Our data shows that fast-food workers in California are more likely to be women, Latinx, and low-wage earners.
They face a disproportionately greater risk of COVID-19 workplace transmission, a particularly grave concern
given that fast-food workers are also more likely to live in crowded households, a third of which include people
older than 55. In this section, we list select characteristics that put fast-food workers at greater risk for COVID-19,
and appendix B provides a comprehensive profile of fast-food workers in Los Angeles and California.

The Fast-Food Industry and COVID-19 in Los Angeles                                                                   12
Worker and Household Characteristics
A growing body of data shows that Black, Latinx, and Asian populations have disproportionately high rates of
infection, hospitalizations, death, and economic devastation caused by COVID-19, compared to their White
counterparts.42 In Los Angeles, deaths among Latinx residents increased by 1,000% between November 2020
and January 2021.43 Nine in 10 fast-food workers in Los Angeles are workers of color, and nearly three-quarters
are Latinx.

Figure 4. Race/ethnicity

Figure X. Race/ethnicity
   Latinx
                   Latinx Fast-food                           46%                           73%
                                                                                            73%
                                   workersAll workers     46%
Latinx
    White             White
                      10%          10%
                                     73%          46% 29%
Black                                 5%      29% 7%
Asian                 Asian
                      10%            10% 16%
                                   10%            16%
    Asian                   16%
White                                10%          29%
Native American 5%
    Black
                      Black    5%    7%
                                      2%         < 1%                     Fast-food workers
Other              7%                              2%
   Native Native
Source:       2% American       < 1% | 2% IPUMS American Community Survey
 American Authors’ analysis of 2017–2019                                       (ACS) data.All workers
                                                                          All workers
            < 1%                                               Fast-food workers
                           Other      2%
    Other        2%
            01             02          03            04            05           06        07    08          0

Source: Authors’ analysis of 2017–2019 IPUMS American Community Survey (ACS) data.

The majority of fast-food workers are women. Nearly seven in ten fast-food workers in Los Angeles are women,
though they comprise only 45% of all workers in the county. Women were already vulnerable to workplace
harassment, and this has been exacerbated by COVID-19. More than 40% of restaurant workers in a recent survey
reported an increase in the frequency of unwanted sexualized comments from customers since the pandemic
began. A substantial number of the sexually explicit comments shared were from male customers who asked
female service workers to remove their masks to determine their tips.44

Figure 5. Gender
Figure X. Gender
             Fast-food                                      Female
             workers [sen-

 Male
             tence case]
                      31%
                           69% 31%
                           All workers
                                     55%
                                                                                 45% 55%
                                                            Male
 Female               69%            45%
Source: Authors’ analysis of 2017–2019 IPUMS American Community Survey (ACS) data.
                           FAST-FOOD                                                   ALL
                            WORKERS                                                  WORKERS

Source: Authors’ analysis of 2017–2019 IPUMS American Community Survey (ACS) data.

The Fast-Food Industry and COVID-19 in Los Angeles                                                              13
The vast majority of fast-food workers in Los Angeles (83%) are adults over age 18. Fast-food workers are younger
on average than workers as a whole in Los Angeles, with most between 19 and 39 and the largest group (45%)
between 19 and 24.
Figure 6. Age distribution Fast-food workers All workers
Figure X. Age distribution
Fast-food
50
workers All workers
16–18 16% 1% 47%
45%
19–24
40 45% 10%
25–39 26% 37% 37%
40–64 12% 47%
30
65+ < 1% 5%
26%
Source: Authors’ analysis of 2017–2019 IPUMS American Community Survey (ACS) data.
20
16%
10 12%
10% 5%
1% < 1%
0
16-18 19-24 25-39 40-64 65+
Source: Authors’ analysis of 2017–2019 IPUMS American Community Survey (ACS) data.
Though many fast-food workers in Los Angeles are young, they are much more likely than other workers to live in
large, crowded, multigenerational households. The majority (69%) live in households with four or more people,
and 45% are in households of five or more. Nearly one-quarter have children. The majority of all fast-food workers
in Los Angeles live with their parents in the home (see Table 10 in appendix B).
Figure 7. Number of household members Fast-food workers All workers
25
24%
23%
Figure X. Number of household members
20 21%
Fast-food 19% 20% 20%
workers All workers
1 15 3% 10%
2 9% 24% 13% 13%
12%
3 10 10% 19% 20%
9%
4 23% 21%
5 05 20% 12% 6% 7%
6 3% 13% 6%
7+ 13% 7%
0 1 2 3 4 Survey (ACS) data.
5 6 7+
Source: Authors’ analysis of 2017–2019 IPUMS American Community
Source: Authors’ analysis of 2017–2019 IPUMS American Community Survey (ACS) data.
The Fast-Food Industry and COVID-19 in Los Angeles 14Further, over a third share households with at least one person who is 55 years of age or older, placing these
households in an even more vulnerable group for severe COVID-19 infections or death.
Table 3. Number of people age 55+ in worker households
Fast-food All workers
workers
0 65% 56%
1 22% 21%
2 11% 20%
3+ 2% 3%
Source: Authors’ analysis of 2017–2019 IPUMS American Community Survey (ACS) data.
Our data suggests that fast-food workers face great risk of COVID-19 transmission from fast-food worksites to
households and surrounding communities. Fast-food workers live considerably closer to their workplaces than
the general population; in Los Angeles, 66% live less than 30 minutes from work, compared to 50% of all working
Angelenos. Consequently, worksite outbreaks pose a greater threat of community spread in some of the poorest
and densest neighborhoods in the city.45
Use of public transportation is another potential risk for COVID-19 transmission. Fast-food workers in Los Angeles
are much more likely than workers as a whole to rely on public transportation for their commutes to work.
Figure 9. Transportation mode to work
Fast-food All
workers workers
Private vehicle Bike or walk Private vehicle Bike or walk
72% Fast-food
workers
8%
All workers
84% 3%
Private Public
vehicle 72% 84% Other Public Other
transportation transportation
Public
tation
transpor-
17%
Bike or walk
17%
8%
6%
3%
3% 6% 7%
Other 3% 7%
Source: Authors’ analysis of 2017–2018 IPUMS American Community Survey (ACS) data.
The Fast-Food Industry and COVID-19 in Los Angeles 15Wages and Income
A recent study found a strong relationship between low-wage work and COVID-19 positive test rates.46 The
majority of fast-food workers earn wages at or near minimum wage. Between 2017 and 2019, the median wage
for fast-food workers in Los Angeles was $12.40, compared with $20.52 for all workers in the county. There is a
very narrow wage distribution for fast-food workers; even the 90th percentile earned only $15.22 an hour. Median
annual wage earnings for fast-food workers in Los Angeles was $25,791, compared to $42,680 for all workers.
Table 4. Hourly wage percentile, weighted average
Fast-food workers All workers
10th 11.28 11.92
25th 11.70 13.92
50th (median wage) 12.40 20.52
75th 13.88 35.34
90th 15.22 56.74
Source: 2019 Occupational Employment Statistics (OES) data, which includes 2017–2019 samples.
Despite their young age and low pay, fast-food workers’ wages in Los Angeles make up 40% of their families’
incomes. One-quarter of fast-food workers in Los Angeles are the main earners in their families. Fast-food work-
ers’ share of family income is much lower than for the workforce as a whole, largely because that they are much
more likely to live in multigenerational families with multiple family members contributing to the family income.
Figure 10: Income contribution and family size
Average share of total Main income earner Median family size
family
Figure income
X: Income Contribution and Family Size
Average share of total family Main income earner Median family size
income
Fast-food Fast-food
Fast-food workers All workers workers All workers
workers All workers 25% 55% 4 3
40%
Fast-food All77% Fast-food All Fast-food All
workers workers workers workers workers workers
Source: Authors’ analysis of 2017–2019 IPUMS American Community Survey (ACS) data.
40% 77% 25% 55% 4 3
Source: Authors’ analysis of 2017–2019 IPUMS American Community Survey (ACS) data.
The Fast-Food Industry and COVID-19 in Los Angeles 16Fast-food workers are more than twice as likely to live in families with incomes below the federal poverty line (15%)
compared to the overall workforce (7%). Angelenos are slightly poorer than their statewide counterparts; close
to half (45%) of all fast-food workers in Los Angeles are in families earning less than 200% of the federal poverty
level, slightly higher than fast-food workers in the state as a whole (41%).
Figure 11. Family poverty level Fast-food workers All workers
50
Figure X. Family poverty level 48%
40
Percent of feder- Fast-food
al poverty level workers All workers 37%
< 100%
30 15% 7%
31%
100–150% 13% 30% 6%
150–200% 17% 8%
20
200–400% 37% 31%
18%
400%+ 15% 18% 48% 15%
10
Source: Authors’ analysis of 2017–2019 IPUMS American Community Survey (ACS) data45
6%
0
< 100% 100– 200% 200 – 400% 400+
Source: Authors’ analysis of 2017–2019 IPUMS American Community Survey (ACS) data.
Fast-food workers are essential in more ways than one, providing crucial income for rent-burdened households
that spend over 30% of their household income on rent and utilities and many of which are in or near poverty.
Fast-food workers’ households are more likely than all workers’ households to be rent-burdened. Most (62%)
fast-food workers are renters, compared to 56% of all workers. Of those fast-food workers who rent, 54% spend
more than a third of their income on rent, compared to 44% of all working renters
The Fast-Food Industry and COVID-19 in Los Angeles 17Figure 12. Share of renters spending more than 30% of income on rent
Fast-Food All Workers
Fast-food Workers
workers
34%
All workers
23%
54% 45%
Source: Authors’ analysis of 2017–2019 IPUMS American Community Survey (ACS) data.
Work Hours
The majority of fast-food workers work part-time, between 16 and 34 hours a week, with a third working full-time.
They average 28 hours a week, though older workers typically work longer hours.
Figure 13. Full-time and part-time status
Full-time (35+ Full-time (35+
hours) hours)
Fast-food workers
Fast-food
workers 31%
All workers 77%
Full-time (35+ hours) Part-time 1 77%
31%
All workers
Part-time 1
Part-time 1 (16–34 (16–34 hours) (16–34 hours)
hours)
Part-time 2 (< 16
hours)
54%
54%
15%
17%
6%
17%
Part-time 2 Part-time 2
(< 16 hours) (< 16 hours)
15% 6%
Source: Authors’ analysis of 2017–2019 IPUMS American Community Survey (ACS) data.
The Fast-Food Industry and COVID-19 in Los Angeles 18Table 5. Average weekly work hours by age
Fast-food workers All workers
16–18 20 21
19–24 27 31
25–39 32 40
40–64 36 40
65+ 26 35
All 28 39
Source: Authors’ analysis of 2017–2019 IPUMS American Community Survey (ACS) data.
Health Insurance
Fast-food workers in Los Angeles are one and half times more likely to be uninsured and two and a half times
more likely to be enrolled in Medi-Cal than the workforce as a whole. Fast-food workers are half as likely to be
enrolled in a job-based health plan through their own or a family member’s employer.
Figure 14. Health insurance coverage
80
Fast-food workers All workers
70
Medi-Cal
60
(Medicaid)
61%
40% 16%
Employer-sponsored
50
health insurance 34% 61%
Private
40 health insurance
40%
purchased directly 34%
8% 10%
30
Other
20
health insurance 1% 2%
10% 17% 11%
None
10
16% 8% 17% 2%
11%
1%
Source:
0 Authors’ analysis of 2017–2019 IPUMS American Community Survey (ACS) data.
Medi-Cal Employer- Private Other None
(Medicaid) sponsored health insurance health insurance
health insurance purchased
directly
Source: Authors’ analysis of 2017–2019 IPUMS American Community Survey (ACS) data.
The Fast-Food Industry and COVID-19 in Los Angeles 19Conclusion A growing body of research shows that workplaces are a common vector of COVID-19 community transmission,47 and food service workers face particularly acute risk. Essential workers who risk getting sick on the job are more likely to be Latinx and to live in overcrowded housing where social distancing is difficult or impossible. Nowhere is the racial and economic inequality of COVID-19 transmission among essential workers more pronounced than in Los Angeles, where deaths among Latinx residents increased by 1,000% between November 2020 and January 2021.48 More than 72% of fast-food workers in Los Angeles are Latinx, nearly 70% are women, and 90% are workers of color. The average fast-food worker in Los Angeles County earns less than $26,000 per year. Nearly half live in households with five or more people, over half of those who rent their housing are rent-burdened, and seven in ten live in households where someone relies on the public safety net to survive. Fast-food workers live in multi-generational housing; 69% live in households of four people and one in three with someone older than age 55. These workers are the most likely to contract and transmit COVID-19 to communities the least able to contain it. This report provides a portrait of fast-food workers, one of the groups most hard-hit by COVID-19 transmission and mortality. These findings call for policy intervention to stop the transmission of COVID-19 in fast food and the communities where fast-food workers live . The Fast-Food Industry and COVID-19 in Los Angeles 20
Appendix A:
Detailed Methodology
Industry Data
For industry data, we used the NAICS code Food Services and Drinking Places (722) and code Limited-Service
Restaurants (722513) and included data from the following government sources:
    •    Quarterly Census of Employment and Wages 2019
    •    US Census Bureau, 2018 County Business Patterns

Worker Earnings and Demographics
To calculate wages, we used the May 2019 Occupational Employment Statistics (OES), which provides a three-
year sample for 2017–2019. We used occupation codes Cooks, Fast Food (35-2001) and Fast Food and Counter
Workers (35-3023).
For demographic, family, and household data, we used the American Community Survey 2017–2019, NAICS code
Restaurant and Other Food Services (8680). For 2017, we used occupation codes Combined Food Preparation
and Serving Workers, Including Fast Food (4050), Counter Attendants, Cafeteria, Food Concession, and Coffee
Shop (4060), and Cashiers (4720). For 2018 and 2019, we used occupation codes Fast Food and Counter Workers
(4055) and Cashiers (4720).

Public Cost of Safety Net Utilization
To calculate the utilization of safety net programs by families of fast-food workers (defined as working 27 or more
weeks per year and 10 or more hours per week), we mainly relied on four sources of data: the US Census Bureau’s
American Community Survey (ACS), the March Supplement of the US Bureau of Labor Statistics Current Population
Survey (CPS), the US Bureau of Labor Statistics Occupational Employment Statistics (OES), and administrative data
from the Medicaid, CHIP, TANF, EITC, and SNAP programs. Medicaid figures exclude aged, blind, and disabled
enrollees. The ACS surveys a large number of respondents and asks them about their work history, income, and
family structure. The March Supplement, also known as the Annual Demographic Supplement, asks respondents
about receipts of cash and noncash transfer payments during the past year and includes questions about the
programs we examined in this analysis. The OES provides accurate employment counts by occupation at the
substate level.
Survey databases like the ACS and CPS frequently have safety net program utilization counts that differ from
program administrative data. We adjusted the CPS so that its program utilization estimates match the program
administrative data. The CPS does not provide a large enough sample size to accurately estimate program utilization
for fast-food workers at the state or county levels. The ACS does have sufficient sample size for this analysis but
lacks specific questions about program utilization, and its occupational employment counts differ from more
accurate data like the OES. We built a model using CPS data to predict program utilization based on income,
demographics, and family structure. We then used that model to impute program utilization onto the ACS data
and adjust the employment counts in the ACS to match the OES data. We used that imputed and adjusted ACS
data to analyze safety net program utilization in families of fast-food workers.

The Fast-Food Industry and COVID-19 in Los Angeles                                                               21
Appendix B: Data Tables for
Los Angeles and California, 2017–2019
Table 6. Hourly wage distribution and median wage (weighted average)
Fast-food All workers, Fast-food
Hourly wage percentile All workers, CA
workers, LA LA workers, CA
10th 11.28 11.92 11.29 11.93
25th 11.70 13.92 11.72 14.17
50th (median wage) 12.40 20.52 12.47 21.24
75th 13.88 35.34 14.28 36.44
90th 15.22 56.74 16.56 58.75
Annual median wage 25,791 42,680 25,945 44,180
Source: 2019 Occupational Employment Statistics (OES) data, which includes 2017–2019 samples.
Table 7. Economic characteristics: Percent full-time/part-time, full-year/part-year
Fast-food workers, Fast-food workers, All workers, CA
Characteristic All workers, LA
LA CA
Full time/part time
Full-time
(35+ hours) 31.0 77.3 27.2 77.0
Part-time 1
(16–34 hours) 53.7 17.3 54.0 17.3
Part-time 2
(< 16 hours) 15.3 5.4 18.8 5.7
Full year/part year
Full-year
(50+ weeks) 61.8 83.0 58.7 82.3
Part-year
(< 50 weeks) 38.2 17.0 41.3 17.7
Source: Authors’ analysis of 2017–2019 IPUMS American Community Survey (ACS) data.
The Fast-Food Industry and COVID-19 in Los Angeles 22Table 8. Average weekly hours by age group
Fast-food workers, Fast-food workers,
Age group All workers, LA All workers, CA
LA CA
16–18 19.8 21.4 19.7 21.0
19–24 26.5 31.2 25.8 32.0
25–39 32.1 39.5 32.1 39.8
40–64 36.0 40.1 34.7 40.3
65+ 26.4 34.9 34.9 33.8
All 28.0 38.6 26.8 38.6
Source: Authors’ analysis of 2017–2019 IPUMS American Community Survey (ACS) data.
Table 9. Worker characteristics (percentages)
Fast-food Fast-food
Characteristic All workers, LA All workers, CA
workers, LA workers, CA
Gender
Male 31.0 54.5 32.3 54.4
Female 69.0 45.5 67.7 45.6
Race/ethnicity
Latinx 72.6 46.1 60.3 37.5
Black 4.9 7.1 4.5 5.1
Asian 10.4 15.6 12.2 15.8
White 10.4 28.7 20.0 38.3
Native American 1.8 0.2 0.2 0.3
Other 2.4 2.8 2.9
Foreign-born
No 68.1 58.9 73.3 65.8
Yes 31.9 41.1 26.7 34.2
Age group
16–18 16.7 1.0 22.9 1.4
The Fast-Food Industry and COVID-19 in Los Angeles 23Fast-food Fast-food
Characteristic All workers, LA All workers, CA
workers, LA workers, CA
19–24 44.9 9.6 44.1 10.5
25–39 25.7 36.7 21.6 36.0
40–64 12.0 47.5 10.7 46.7
65+ 0.6 5.1 0.8 5.3
Education level
Less than high
school 15.2 10.7 17.7 8.6
High school 41.9 27.6 44.3 28.6
Associate degree/
some college 36.7 25.1 32.3 25.7
Bachelor's degree 6.0 24.3 5.1 23.5
Advanced degree 0.3 12.4 0.7 13.6
Health insurance
Medi-Cal
(Medicaid) 39.7 15.5 36.4 13.9
Employer-
sponsored health 33.9 60.6 40.8 64.8
insurance
Private health
insurance 8.1 10.0 8.2 9.0
purchased directly
Other health
insurance 1.0 2.4 1.9 3.2
None 17.3 11.5 12.7 9.1
Transportation to work
Private vehicle 71.7 84.0 79.2 83.9
Public
transportation 16.5 6.3 9.5 5.5
Bike or walk 8.2 3.1 7.6 3.4
Other 3.5 6.6 3.7 7.1
Source: Authors’ analysis of 2017–2019 IPUMS American Community Survey (ACS) data.
The Fast-Food Industry and COVID-19 in Los Angeles 24Table 10. Household characteristics (percentages)
Fast-food Fast-food
Characteristics All workers, LA All workers, CA
workers, LA workers, CA
Federal poverty level
< 100% 15.2 6.5 16.1 6.2
100–150% 13.4 6.5 12.2 5.7
150–200% 16.4 8.4 12.7 7.4
200–400% 36.9 31.0 34.4 28.4
400+% 18.0 47.7 24.7 52.4
Other household
income characteristics
Renters who spend
more than 30% of 53.9 44.9 54.0 42.3
income on rent
Average worker
share of family 39.7 76.6 34.1 75.3
total income
Main earner in family 25.2 54.8 24.5 54.6
Family status
Married with-
out children 6.3 16.9 5.4 18.9
Married with
children 10.9 31.9 9.7 33.2
Not married with-
out children 70.6 40.8 75.1 38.4
Not married
with children 12.3 10.4 9.9 9.5
Median Family
Size (number) 4 3 4 3
No. of house-
hold members
1 3.5 10.3 3.6 9.5
2 9.3 23.4 10.3 24.7
3 18.6 20.2 18.2 20.5
4 23.2 20.8 24.9 21.0
The Fast-Food Industry and COVID-19 in Los Angeles 25Fast-food Fast-food
Characteristics All workers, LA All workers, CA
workers, LA workers, CA
5 19.8 12.2 18.8 12.1
6 13.1 6.3 11.3 6.1
7+ 12.5 6.7 12.9 6.2
No. of family members
1 10.3 18.2 12.0 17.6
2 8.9 21.6 9.7 23.3
3 16.2 18.3 16.7 18.5
4 22.6 19.5 23.1 19.4
5 18.9 11.2 17.4 10.9
6 12.5 5.7 10.1 5.4
7+ 10.7 5.6 10.9 5.0
No. of household
members age 55+
0 65.2 56.3 65.6 58.0
1 22.4 21.4 20.5 20.1
2 11.0 19.7 12.3 19.6
3+ 1.4 2.6 1.6 2.3
Age group sharing
household with a parent
16–18 92.5 83.9 90.1 85.0
19–24 82.1 66.5 75.2 60.9
25–39 39.2 28.5 37.6 24.4
40–64 7.5 8.5 9.3 7.5
65+ 8.2 2.0 8.6 1.6
Source: Authors’ analysis of 2017–2019 IPUMS American Community Survey (ACS) data.
The Fast-Food Industry and COVID-19 in Los Angeles 26Acknowledgments Research Team Kuochih Huang, UC Berkeley Labor Center Ken Jacobs, UC Berkeley Labor Center Tia Koonse, UCLA Labor Center Ian Eve Perry, Consultant Kevin Riley, UCLA Labor Occupational Safety and Health Program Laura Stock, UC Berkeley Labor Occupational Health Program Saba Waheed, UCLA Labor Center UCLA Graduate Student Research Support Gabino Abarca Victoria Copeland Lizbeth Diaz Jennifer Ray Additional Research Support Jenifer MacGillvary Editor Julie Monroe Design Antonio Rodriguez UCLA Administrative Support Luz Hernandez Claudia Saurez Communications Veena Hampapur, UCLA Labor Center Van Nguyen, UC Berkeley Labor Center Photo Credits: Wil Prada Unsplash Envato Elements Report Citation Kuochih Huang, Ken Jacobs, Tia Koonse, Ian Eve Perry, Kevin Riley, Laura Stock, and Saba Waheed, The Fast-Food Industry and COVID-19 in Los Angeles (Los Angeles: UCLA Labor Center and Labor Occupational Safety and Health; Berkeley: UC Berkeley Labor Center and Labor Occupational Health Program, February 2020). Creative Commons Attribution This work is licensed under the Creative Commons-Attribution-NonCommercial- ShareAlike 4.0 International License. The Fast-Food Industry and COVID-19 in Los Angeles 27
Notes
1
 “Food Environment Atlas,” USDA Economic Research Service, updated December 18, 2020, https://www.ers.usda.gov/
data-products/food-environment-atlas/.
2
 Alana Rhone, “ERS’s Updated Food Environment Atlas Shows an Increase in Fast Food Restaurants between 2009 and
2014,” USDA Economic Research Service, December 4, 2017, https://www.ers.usda.gov/amber-waves/2017/december/ers-
s-updated-food-environment-atlas-shows-an-increase-in-fast-food-restaurants-between-2009-and-2014/.
3
 “Quarterly Census of Employment and Wages, Limited-Service Eating Places, United States 2019 Annual Averages,” US
Bureau of Labor, modified January 2, 2020, https://www.bls.gov/cew/.
4
 “Quarterly Census of Employment and Wages, Limited-Service Eating Places, Los Angeles and California, 2019 Annual
Averages,” US Bureau of Labor, modified January 2, 2020, https://www.bls.gov/cew/.
5
 Deborah Berkowitz, Behind the Arches: How McDonald’s Fails to Protect Workers from Workplace Violence (New York:
National Employment Law Project, 2019), 1, https://s27147.pcdn.co/wp-content/uploads/Behind-the-Arches-McDonalds-
Workplace-Violence.pdf.
6
 “National COSH Fast Food Safety Online Survey,” Hart Research Associates, February 20–24, 2015, 3, https://www.
coshnetwork.org/sites/default/files/FastFood_Workplace_Safety_Poll_Toplines.pdf.
7
 “Key Findings from a Survey of Women Fast Food Workers,” Hart Research Associates, October 5, 2016, 1, https://
hartresearch.com/wp-content/uploads/2016/10/Fast-Food-Worker-Survey-Memo-10-5-16.pdf.
8
  See for example, Kwame Opam, “Fast-Food Chain Del Taco to Pay $1.25 Million to Settle Sexual Harassment Suit,” New
York Times, December 2, 2020, https://www.nytimes.com/2020/12/02/business/del-taco-sexual-harassment.html;
Kate Taylor, “McDonalds Slammed with 3 New Sexual Harassment Lawsuits as Workers Say the Fast-Food Giant Failed to
Protect Them on the Job,” Business Insider, January 14, 2021, https://www.businessinsider.in/retail/news/mcdonalds-
slammed-with-3-new-sexual-harassment-lawsuits-as-workers-say-the-fast-food-giant-failed-to-protect-them-on-the-job/
articleshow/80272522.cms; Bryce Covert, “McDonald’s Has a Real Sexual Harassment Problem,” The Nation, July 28, 2020,
https://www.thenation.com/article/society/mcdonalds-sexual-harassment-feature/.
9
 Leila Miller, “Low-Wage Workers Face Retaliation for Demanding COVID-19 Safety Measures at Work,” Los Angeles Times,
August 15, 2020, https://www.latimes.com/california/story/2020-08-15/coronavirus-workers-retaliation-claims.
10
  Brian Callaci, “Control without Responsibility: The Legal Creation of Franchising, 1960–1980.” Enterprise & Society: The
International Journal of Business History 21, no. 4 (December 2020): 5–7, https://doi.org/10.1017/eso.2019.58.
11
  Minwoong Ji and David Weil, “The Impact of Franchising on Labor Standards Compliance,” ILR Review 68, no. 5, (October
2015), 980–981, https://doi.org/10.1177%2F0019793915586384.
 Tiffany Hsu, “Nearly 90% of Fast-Food Workers Allege Wage Theft, Survey Finds,” Los Angeles Times, April 1, 2014, https://
12

www.latimes.com/business/la-xpm-2014-apr-01-la-fi-mo-wage-theft-survey-fast-food-20140331-story.html.
13
  Ruth Milkman, Ana Luz Gonzalez, and Victor Narro, Wage Theft and Workplace Violations in Los Angeles (Los Angeles:
UCLA Institute for Research on Labor and Employment, 2010), 36–39 https://www.labor.ucla.edu/publication/wage-theft-
and-workplace-violations-in-los-angeles/.
14
  David Weil, Improving Workplace Conditions through Strategic Enforcement: A Report to the Wage and Hour Division
(Boston: Boston University, May 2010), 44, https://www.fissuredworkplace.net/assets/D.Weil.Improving-Compliance-via-
Strategic-Enforcement.WHD.2014.pdf.
15
  Julia Lipper, Howard Rosing, and Felipe Tendick-Matesanz, “The Health of Restaurant Work: A Historical and Social Context
to the Occupational Health of Food Service,” American Journal of Industrial Medicine 63, no. 7 (July 2020), 570, https://doi.
org/10.1002/ajim.23112.
 See for example, Opam, “Fast-Food Chain Del Taco”; Taylor, “McDonalds Slammed with Lawsuits”; Covert, “McDonald’s
16

Has a Problem.”
17
     “Key Findings from Survey,” 1.
18
     “National COSH Fast Food,” 3.
19
  National Institute for Occupational Safety and Health, “Most Teen Worker Injuries in Restaurants Occur in Fast Food,
NIOSH Study Finds,” news release, December 22, 1999, https://www.cdc.gov/niosh/updates/teenfast.html.
20
     Berkowitz, “Behind the Arches,” 4.

The Fast-Food Industry and COVID-19 in Los Angeles                                                                           28
You can also read