Asset Management Strategy - Shire of Jerramungup
←
→
Page content transcription
If your browser does not render page correctly, please read the page content below
Shire of Jerramungup

Asset Management
     Strategy
Executive summary
The Shire of Jerramungup’s assets include roads, footpaths, buildings, parks and gardens. The
value of these assets has been determined using various methodologies including fair value,
replacement value and insurance value.
This asset management strategy includes a summary of the procedures, processes and plans
used to manage the Shire’s assets and the long term expenditure forecast. The document will
evolve as new systems and processes are developed and implemented. The Asset
Management Strategy (AMS) will be reviewed at least every year and updated when necessary.
The asset management strategy provides:
A document that describes the assets used to provide building and infrastructure services
provided by the Shire.
An understanding and forecasting of asset related management options and costs; and
Details of the drivers for forward works programs and the associated funding
requirements.
The plan also acts as a vehicle for communication with all stakeholders with an interest in the
Shire’s asset management systems. It provides a focus within the Shire for the development
and maintenance of good asset management practices.
The Plan aims to provide the Shire with a management framework to cost effectively achieve
the strategic goals, while meeting its customers’ expectations. To achieve the Shire’s strategic
objective of a more diligent approach to Asset Management will ensure that the longevity of
Shire-owned assets is maximised. This will be achieved through prioritisation and appropriate
allocations of maintenance funds, as well as the development of structured maintenance
programs. The strategy documents the current information and processes used for establishing:
Levels of Service and Performance Parameters,
Future Demands for Assets,
Lifecycle Management Strategies,
Financial Management and Budgets, and
Asset Management Improvement Plans.
The Shire has very slight growth projections over the next ten years and no expansion of the
current asset base is predicted. The building and infrastructure assets are of varying ages, are
generally in fair to good condition and perform effectively. Only minor replacements and
refurbishments have been projected in the next ten years.
The financial analysis of future operations, maintenance and renewals liabilities has been
finalised for this plan and the Shire average annual expenditure requirements to fully fund the
buildings and infrastructure assets has been determined.Table of contents
1. Introduction................................................................................................................ 1
1.1 Background ..................................................................................................... 1
1.2 Purpose of the Plan ........................................................................................ 1
1.3 Goal and Objective of Asset Management ..................................................... 1
1.4 Asset Environment .......................................................................................... 2
1.5 Assets Overview ............................................................................................. 4
2. Levels of Service and Demand Management ........................................................... 5
2.1 Customers and Expectations .......................................................................... 5
2.2 Strategic and Corporate Goals ....................................................................... 6
2.3 Current levels of Service ................................................................................. 6
2.4 Desired Levels of Service ............................................................................. 12
3. Future Demand ....................................................................................................... 13
3.1 Demand Forecast ......................................................................................... 13
3.2 Changes in Technology .................................. Error! Bookmark not defined.
3.3 Demand Management Plan .......................................................................... 14
4. Risk Management ................................................................................................... 14
4.1 Risk Identification .......................................................................................... 15
4.2 Probability Assessment................................................................................. 15
4.3 Consequence Assessment ........................................................................... 15
4.4 Risk Exposure Assessment .......................................................................... 16
4.5 Mitigation and Management Strategies ........................................................ 17
4.6 Heading 1 Example Summary of Risks ........................................................ 18
5. Lifecycle Management Plan .................................................................................... 19
5.1 Roads ............................................................................................................ 19
5.2 Footpaths ...................................................................................................... 23
5.3 Buildings ....................................................................................................... 25
5.4 Parks and Gardens ....................................................................................... 28
6. Financial Summary ................................................................................................. 31
6.1 Introduction ................................................................................................... 31
6.2 Accounting/Financial Systems ...................................................................... 31
6.3 Capital Investment Program ......................................................................... 31
6.4 Operations and Maintenance Program ......................................................... 31
6.5 Asset Disposals Program ............................................................................. 32
6.6 Income Summary .......................................................................................... 32
7. Plan Improvements and Monitoring ........................................................................ 33
7.1 Monitoring and Review Process ................................................................... 33
7.2 Data and Information Management .............................................................. 33Table index Table 1 Estimated Resident Population - at 30 June 2010 ......................................... 2 Table 2 Summary of Assets ......................................................................................... 4 Table 3 Legislative Requirements ............................... Error! Bookmark not defined. Table 4 Service Levels for Roads Key Performance Measure .................................... 7 Table 5 Service Levels for Footpath Key Performance Measure ................................ 8 Table 6 Service Levels for Buildings Key Performance Measure ................................ 9 Table 7 Service Levels for Parks and Gardens Key Performance Measure ............. 11 Table 8 Demand Factors ........................................................................................... 13 Table 9 Demand Management .................................................................................. 14 Table 10 Probability Assessment Scores .................................................................... 15 Table 11 Consequences Assessment Scale ............................................................... 16 Table 12 Risk Factor Assessment Matrix .................................................................... 16 Table 13 Risk Register - Major Corporate Risks ......................................................... 18 Table 14 Road Assets .................................................................................................. 20 Table 15 Building Assets ............................................................................................. 25 Table 18 Asset Management Action Plan .................................................................... 33 Figure index Figure 1 Shire of Jerramungup Map ............................................................................. 2 Figure 2 Jerramungup Climate Data ............................................................................. 4 Figure 3 Identification of the Levels of Service ............................................................. 5 Appendices A. Unsealed Roads Maintenance Plan B. Buildings Routine and Planned Maintenance Plans
1. Introduction
1.1 Background
This is the first edition of the Roads, Footpaths, Buildings & Parks and Gardens Asset
Management Strategy (AMS) for the Shire of Jerramungup. The assets covered by this plan
include building and infrastructure assets consisting of the following categories:
Roads,
Footpaths,
Buildings and
Parks and Gardens.
1.2 Purpose of the Plan
This AMS is a consolidation of all the information that is currently available in regard to the
Shire’s building and infrastructure assets and service delivery programs. It is a long range-
planning document that the Shire can use to provide a rational framework for current and future
understanding of its assets.
This AMS is to demonstrate responsive management of assets (and services provided from
assets) compliance with regulatory requirements, and to communicate funding required to
provide the required levels of service.
This AMS is intended to improve the Shire of Jerramungup’s ability to meet its corporate goals
and objectives in a way that best services its customers. It provides a rational framework
enabling systematic and repeatable processes to manage costs, risks and levels of service for
the Shire’s assets. The purpose of the Asset Management Plan is to:
Establish responsible management,
Communicate and justify funding requirements and
Comply with regulatory requirements
This is the Shire’s first version of an AMS and will therefore not meet all of the long term goals
of a fully developed AMS. It is intended that the continual improvement of asset management
practices within the Shire of Jerramungup will result in annual updates to this document. As
such, this AMS is a living document that will require ongoing refinement to reflect the evolution
of asset management maturity within the Shire over time.
1.3 Goal and Objective of Asset Management
The Shire of Jerramungup are the custodians of building and infrastructure assets and are
responsible for ensuring that the assets under their control are maintained at an appropriate
level, effectively utilised, and are renewed and refurbished to achieve an efficient whole of life
cost balance.
The Shire aims to provide the community with quality buildings and infrastructure. This objective
will be achieved by ensuring that built infrastructure is well utilised and maintained and adopting
whole of life asset management principles.To achieve this objective, the Shire of Jerramungup requires a fully integrated Asset
Management Strategy that identifies the most appropriate expenditure levels across various
asset classes to achieve maximum asset utilisation and physical longevity.
1.4 Asset Environment
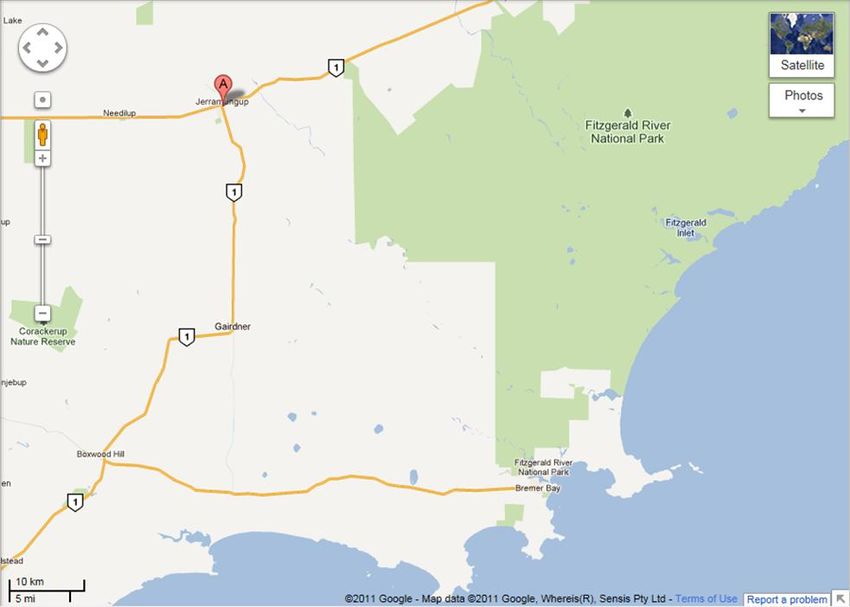
The Shire of Jerramungup was established on 1 July 1982. It is in the Great Southern region of
Western Australia, about 180 kilometres northeast of Albany and about 440 kilometres
southeast of the state capital, Perth. The Shire covers an area of 6,507 square kilometres and
has a population of approximately 1,166 in 2010.
Table 1 Estimated Resident Population - at 30 June 2010
Population by Sex 2006 2007 2008 2009 2010
Males No. 677 673 668 660 667
Females No. 519 513 509 502 499
Persons No. 1196 1186 1177 1162 1166
Source: Australian Bureau of Statistics - National Regional Profile: Jerramungup (Local Government Area)
The local area is predominantly agricultural and the farmland around this area is renowned for
its grain and livestock production with wheat and sheep farming the main industry. The Shire
Administration Office is in the town of Jerramungup.
Figure 1 Shire of Jerramungup Map
The Shire area contains the following towns:
Jerramungup
The town of Jerramungup is located on the Gnowangerup-Jerramungup Road, 461 km
southeast of Perth. Established in 1953, the town was opened up as a war settlement area
and primarily for agricultural purposes. The name Jerramungup comes from an Aboriginal word
meaning a “place of upstanding yate trees”. Yate trees are a variety of eucalypt trees. The
town is well established with a basic range of retail shops, agricultural service business,education and government services. In the past ten years there has been minimal growth in the
town. Over the next ten years, town growth is forecast to continue with slow growth and a
modest increase in population.
Boxwood Hill
This town was gazetted in 1963 and has a small population.
Bremer Bay
This town has a population of about 571. The bay was named by John Septimus Roe, who
visited the area in 1831, after Sir James Bremer, Captain of HMS Tamar. The town was
originally named Wellstead, but the local petition in 1951 was in favour of the current name. The
change of name was approved and the new name gazetted in 1962. The town of Bremer Bay is
growing both in terms of development and tourism.
Bremer Bay is known for its beautiful beaches. The unspoilt coastline offers numerous
recreational pursuits from fishing, beach combing and walking on some of the finest beach sand
in the southern hemisphere, whale watching and not to mention swimming in the magnificent
turquoise waters of the various bays and beaches.
Gairdner
Gairdner is a town in the Great Southern Region of Western Australia. The town is located
between Jerramungup and Boxwood Hill along the South Coast Highway and to the west of the
Gairdner River. The surrounding area was opened up by the state government for settlement in
the 1970s. The town is named after the Gairdner River which was named by John Septimus
Roe while on expedition in the area in 1848, he named it after Colonel Gordon Gairdner of the
Colonial Office.
Needilup
This town is situated between Ongerup and Jerramungup along the Gnowangerup-
Jerramungup Road. The establishment of a town arose after a local member petitioned the
lands department for land to be made available for a town site in 1951 after settlement in the
area lead to a demand for land. Lots were surveyed soon afterward and the townsite was
declared in 1954.
1.4.1 Geographic Characteristics
The relevant geographic characteristics for the area are:
– Height above sea level is 322m;
– Temperatures range from -2° mean daily minimum to 46.1° mean maximum daily,
recorded over 17 years of temperature readings;
– Mean Rainfall is 448.2 mm per annum;Figure 2 Jerramungup Climate Data
The Shire of Jerramungup also contains part of the Fitzgerald River National Park which was
established 1973 and is managed by Department of Environment and Conservation. The Park
is 419 kilometres southeast of Perth, in the Shire of Ravensthorpe and the Shire of
Jerramungup and includes the Barren Mountains and Eyre Range and the Fitzgerald River as
well as incorporating the Fitzgerald Biosphere.
There are 62 plant species which are unique to the 329,882 hectares (815,160 acres) park and
a further 48 are rarely found elsewhere. Recording almost 40,000 visitors in 2008, the park
received $20 million in funding from the federal government's economic stimulus plan with the
state government contributing an additional $20 million. The investment is to be used to
redevelop and seal 80 km of roads within the park, construct walking trails and upgrade existing
recreational facilities. Within the National Park is the Quaalup Homestead Wilderness Retreat.
The park can be accessed from the western side via Bremer Bay, or from the eastern side via
Hopetoun.
1.5 Assets Overview
The assets covered by this plan include building and infrastructure. The asset categories and
classes are quantified in the relevant sections of this report for each asset category. The table
below provides an overview:
Table 2 Summary of Assets
Asset Asset Class Quantity Unit of Value Valuation
Category Measure methodology
Roads Sealed 134.04 Km $9,087,157 Fair value
Unsealed 1004.86 Km $22,192,296 Fair valueFootpaths Asphalt, 7.39 Km $344,584 Fair value
Concrete & Brick
Paving
Buildings Community 87 Number $44,641,525 Insurance value
facilities, halls,
televison/radio
infrastructure,
toilets, houses
Parks Recreation, Not Known Hectares Not known Replacement
and playground, value
Gardens landscaped
open space
2. Levels of Service and Demand
Management
2.1 Customers and Expectations
One aim of an AMS is to clarify and define key levels of service for assets and to identify the
cost of future operations, maintenance, renewal and capital works required to provide these
levels of service. A key objective of this AMS is to allow efficient allocation of resources to
ensure levels of service provided by the assets match with customer expectations, which
requires a clear understanding of customers’ needs and preferences. The levels of service are
based on legislative requirements, the Shire’s strategic and corporate goals and customer
research as depicted in the diagram below.
Figure 3 Identification of the Levels of Service
In September 2009, Shire adopted an integrated Communications & Customer Service
Strategy. The purpose being a plan of action that will facilitate improved service delivery, the
efficient allocation of resources and a greater integration in terms of community aspirations and
the delivery of both operational and strategic projects.The first Community survey was developed and distributed in 2010. It is planned that future surveys will be conducted annually from 2013 and will provide a basis for comparison. This is the first step towards confirming the levels of service required by the community. The next step is to monitor relevant performance measures and undertake consultation with the Elected Members and community to confirm that these service levels are acceptable, relevant and affordable. Identification of customer expectations is an essential factor in the development of the Service Delivery Strategy. 2.2 Strategic and Corporate Goals In 2012, the Shire developed and adopted its Strategic Community Plan. This document addresses the State Government’s Strategic Community Planning requirements. This is a strategy and planning document that reflects the longer term (10+ year) community and local government aspirations and priorities. This Strategic Community Plan contains four aspirations. Environmental Aspirations The key aspirations within this area reflect the Shire’s location and proximity to the Fitzgerald River National Park. The Shire’s location is recognised internationally for its biodiversity, pristine coastal environment and human interaction with the landscape. Land use planning, land capability and natural resource management are addressed in this area. Social Aspirations This group of aspirations refers to the capacity of society to provide for the wellbeing of all residents and do so in a fair and equitable way. This includes good governance and civic leadership, provision of adequate income, feeling safe, good health, food and nutrition, adequate housing, employment opportunities, high standards of education and access to sport and recreation facilities. Economic Aspirations The key themes relating to this aspiration were basedon responsible fiscal policy, asset management and the provision of good quality and well utilised infrastructure.The continuation of broad hectare agriculture as a key industry and the improvement of road infrastructure are addressed under this pillar. Cultural Aspirations This group of aspirations refer to recognising our past and the contribution that previous generations have made. Embracing and recognising history and culture will facilitate a sense of place and community vibrancy. This can often drive economic development by providing a location that people want to live and visit. Active citizenship (volunteerism) featured prominently. 2.3 Current levels of Service Each of the sections below describe the current service response for each of the asset categories, however, as this is the first AMS, the data required to monitor and report on the
Shire’s specific performance is not available at this time and will be available when further
community consultation and surveys are completed in 2013.

2.3.1     Service Levels for Roads Asset Category

Road maintenance is performed as required, with activities such as road grading scheduled to
be carried out on a regular basis. All queries and requests relating to roads, drainage and
infrastructure are directed through the Shire office where one of the administration staff will
record and lodge a customer service request and the matter will be responded to by the relevant
employee. Road maintenance requests can also be lodged online through the Shire’s website.

The following information provides the service levels in table format. This table is based on the
“National Asset Management Society” template however there are many options for
documentation of Levels of Service and the Shire should choose a format that best suits the
data available and the Community Outcomes that need to be achieved.

Table 3      Service Levels for Roads Key Performance Measure

                 Level of Service
                                Performance                   Performance            Current
                                Measure Process               Target                 Performance
COMMUNITY / OPERATIONAL LEVELS OF SERVICE
Quality     Well maintained and User satisfaction             Customer requests
            suitable road       measurement                   < 25 per year
            network             survey
            Ride-ability and
            visibility
            Adequate road width
            for traffic demands
Function    Road network meets Assessment of                  No of reports per
            user requirements   Suitability for               annum of
            Provide a fully     Purpose                       inaccessibility due
            accessible network                                to lack of
                                                              maintenance < 10
Safety        Provide a safe             Number of injury     Nil / Per Year
              network                    / accidents
TECHNICAL LEVELS OF SERVICE
Legislative / Meet criteria detailed     Compliance with      100% Compliant
Statutory     in in License, Acts or     Legislative /
              Regulations                Statutory
                                         requirements
Operations       Road network meets      Assessment of        No of reports per
                 user requirements       suitability for      annum of
                                         purpose              inaccessibility due
                                                              to lack of
                                                              maintenance < 10
Maintenance      Manage the road         User satisfaction    70% of customers
                 network at the          measurement          believe the road
                 agreed standards for    survey               network provided is
                 the lowest lifecycle    Cost                 good value for
                 cost                    effectiveness of     money
                                         maintenance
Upgrade          Road network meets      Assessment of        No of reports per
                 user requirements       suitability for      annum assets not
                                         purpose              meeting
                                                              requirements < 10
Renewal Roads are suitable Useful life of Assets have useful
for purpose asset life of 30 years
Cost Undertake proactive Qualitative Measure of budget
effectiveness maintenance measure, based expenditure
Efficient use of on a cost-benefit
Shires Resources analysis
Affordability –
acknowledging that
we can only deliver
what we can afford
2.3.2 Service Levels for Footpath Asset Category
The Shire does not currently have a defined level of service for footpaths and maintains the
existing paths on a reactive maintenance basis.
The Shires long term planning in the areas of footpaths has also been actioned with the
installation of footpaths in Bremer Bay on Bennett, Roderick and between The Esplanade and
Borden Bremer Bay Road as identified in the Bremer Bay Shared Path Plan. This coordinated
approach seeks to deliver an achievable footpath upgrade and installation program and enable
the Shire to apply for funding through the Country Pathways Program.
Table 4 Service Levels for Footpath Key Performance Measure
Level of Service Performance Performance Current
Measure Process Target Performance
COMMUNITY / OPERATIONAL LEVELS OF SERVICE
Quality Well maintained and User satisfaction customer
suitable footpath measurement requests < 10 per
network survey year
Function Network is Assessment of customer
functionally fit for suitability for requests < 5 per
purpose purpose year
Safety Provide a safe User satisfaction 70% Satisfaction
network measurement
survey
Number of injury / Nil / Year
accidents
TECHNICAL LEVELS OF SERVICE
Legislative / Meet criteria detailed Compliance with 100% Compliant
Statutory in in License, Acts or Legislative /
Regulations Statutory
requirements
Operations Footpath assets will User satisfaction Repairs
be maintained in a measurement completed within
reasonably usable survey 14 day timeframe
condition. Defects 70% Satisfaction
found or reported that
are outside Shire’s
service standard will
be repaired.
Shire inspects all
footpath assets
intermittently and
prioritises and repairsLevel of Service Performance Performance Current
Measure Process Target Performance
defects in accordance
with its inspection
schedule to ensure
they are safe.
Maintenance Provide a fully User satisfaction 70% Satisfaction
accessible network measurement
survey
Upgrade Footpath network Assessment of No of reports per
meets user suitability for annum of assets
requirements purpose not meeting
requirements <
10
Renewal Footpaths are Assess useful life Assets have
suitable for purpose of asset useful life of 50
years
Measure, 70% Satisfaction
condition of assets
Cost Undertake proactive Qualitative Measure of
effectiveness maintenance measure, based budget
Efficient use of Shires on a cost-benefit expenditure
Resources analysis
Affordability –
acknowledging that
we can only deliver
what we can afford
2.3.3 Service Levels for Buildings Asset Category
The Shire has maintained its buildings on an annual maintenance program based on condition
assessment information provided by the Shire’s staff and community feedback. A structured
annual operations and routine maintenance program was initiated in 2006/07 for cleaning,
statutory compliance and minor annual preservation tasks.
The following table provides service levels in table format.
Table 5 Service Levels for Buildings Key Performance Measure
Level of Service Performance Performance Current
Measure Process Target Performance
COMMUNITY / OPERATIONAL LEVELS OF SERVICE
Quality Well maintained and User satisfaction Customer
suitable buildings measurement requests < 10
To ensure the survey per year
ongoing provision of
well-kept community
facilities
Function Functionally fit for Assessment of 70%
purpose Suitability for Satisfaction
Sufficient facilities to Purpose
meet userLevel of Service Performance Performance Current
Measure Process Target Performance
demand/needs
Safety Relates to the health User satisfaction 70% of
and safety risks measurement Customers
created by provision survey Satisfied
of the service and the Number of injury / Nil injury or
degree to which accidents accidents / per
these are mitigated. annum
TECHNICAL LEVELS OF SERVICE
Legislative / Meet criteria detailed Compliance with 100%
Statutory in in License, Acts or Legislative / Compliant
Regulations Statutory
Disability access requirements
Operations Defects found or Measurement of Repairs
reported that are timeframe for completed within
outside Shire’s undertaking 14 day timeframe
service standard will repairs
be repaired.
Adequate transport User satisfaction 70% Satisfaction
provision (walking measurement
distance, cycle racks, survey
and/or parking
facilities
Maintenance Maintain the facilities User satisfaction 70% Satisfaction
at a good condition or measurement
better survey
Annual Condition Average
Appraisal Condition is
better than good
Upgrade Buildings are Assessment of No of reports per
refurbished or suitability for annum of assets
replaced when purpose not meeting
scheduled to meet requirements <
the levels of service 10
and functionality
requirements of the
Shire.
Renewal Efficient use of Shires Assess useful life Assets have
Resources of asset useful life of 60
years
Measure, 70% Satisfaction
condition of assets
Cost Undertake proactive Qualitative Measure of
effectiveness maintenance measure, based budget
Efficient use of Shires on a cost-benefit expenditure
Resources analysis
Affordability –
acknowledging that
we can only deliver
what we can afford2.3.4 Service Levels for Parks and Gardens Asset Category
The following table provides service levels in table format but performance targets have not yet
been agreed for any of the Parks and Gardens assets. Performance cannot be measured until
targets are set. This will be completed in future updates of this plan.
Table 6 Service Levels for Parks and Gardens Key Performance Measure
Level of Service Performance Performance Current
Measure Process Target Performance
COMMUNITY / OPERATIONAL LEVELS OF SERVICE
Quality Well maintained User satisfaction Customer
parks measurement requests < 10
Amenity is protected survey per year
Quality town centres
for businesses and
users
Function Functionally fit for Assessment of 70%
purpose Suitability for Satisfaction
Purpose
Safety Safe design and User satisfaction 70%
management of measurement Satisfaction
facilities and parks survey
People feel safe in Number of injury /
parks accidents Nil
Passive security, site
lines, reduced graffiti
Safe working
environments
TECHNICAL LEVELS OF SERVICE
Legislative / Meet criteria detailed Compliance with 100%
Statutory in in License, Acts or Legislative / Compliant
Regulations Statutory
requirements
Operations Well maintained and User satisfaction Repairs
suitable measurement completed
Historic sites are survey within 14 day
protected timeframe
Natural areas are
protected
Easy to find and use
Adequate transport
provision (walking
distance, cycle racks,
and/or parking
facilities
Maintenance Sufficient facilities to User satisfaction 70%
meet user measurement Satisfaction
demand/needs survey
Upgrade Efficient use of Shires Assessment of No of reports
Resources suitability for per annum of
purpose assets not
meeting
requirements <
10
Renewal Assets are suitable Assess useful life Assets haveLevel of Service Performance Performance Current
Measure Process Target Performance
for purpose of asset useful life of 10
years
Measure, 70%
condition of assets Satisfaction
Cost Undertake proactive Qualitative Measure of
effectiveness maintenance measure, based budget
Efficient use of Shires on a cost-benefit expenditure
Resources analysis
Affordability –
acknowledging that
we can only deliver
what we can afford
2.4 Desired Levels of Service
At present, indications of desired levels of service are obtained from various sources including
the Customer Satisfaction Survey, residents’ feedback to Councillors and staff, service requests
and correspondence. The Shire has yet to quantify customer desired levels of service. This will
be done in future revisions of this AMS along with setting of performance targets.3. Future Demand
This section of the plan analyses the potential factors affecting demand including population
growth, social and technology changes. The impact of these trends is examined and demand
management strategies recommended as required to modify demand without compromising
customer satisfaction.
3.1 Demand Forecast
This first core AMS has not focussed on analysing the use/patronage of Shires existing facilities,
and networks the demand for new assets, which will be actioned in future years to further
develop this AMS. Table 7 below provides an example of the demand factors that will have an
impact on the Shires future demand for services. This will be completed in future updates of
this plan.
Table 7 Demand Factors
Present Position Projection Impact on services
Population Population of approximately Increase to Small increase in
1,166 people in 2010 1520 in ten demand for all services
years or 30%
increase
Demographic 20% of population over age Percentage over Change in usage or
60 60 will increase required services to
to 40% in 10 support the
years demographic
Seasonal During Christmas & Easter, The current Short term high impact
the population of Bremer peak population on services resulting in
Bay swells from 500 will remain additional wear and
permanent residents to stable increased maintenance
between 6,000 and 10,000 requirements
Recreation/leisure Increase demand for boat The current May result in a need to
ramp or other types of demand for upgrade or provision of
facilities services will new facilities
continue
Technology Wider / Larger Access roads may need
farm machinery to be upgraded, road
equipment surface changed or load
limits applied to bridges
Customer Fitzgerald River National Increase traffic on
Preference Park is expected to attract access roads resulting in
an increased number of additional wear and
visitors each year increased maintenance
requirements
For most of the Shire area the population is expected to remain relatively stable in terms of
population numbers however there is expected to be a population increase in Bremer Bay of
around 350 people, representing a 30% increase in Shire area population.
Bremer Bay is a regionally significant location from a holiday and recreation perspective. During
Christmas and Easter, the population of Bremer Bay swells from 500 permanent residents to
between 6,000 and 10,000 people. A majority of these visitors are from surrounding towns and
the central wheat belt region of Western Australia. It is anticipated the seasonal activity in
Bremer Bay is to remain the same or slightly increase.In addition to this seasonal activity, the permanent population of Bremer Bay is expected to
increase significantly (350 additional people) within the coming years as a result of;
The proposed Southdown Magnetite mine in Wellstead is located approximately 80 km
from Bremer Bay. It is anticipated that between 10-20% of Southdown employees will
reside in Bremer Bay.
The $40 million upgrade to the Fitzgerald River National Park is expected to attract an
increased number of visitors each year.
The Shire has recently supported several scheme amendments that will facilitate further
rural residential subdivision and industrial development in Bremer Bay.
3.2 Demand Management Plan
Demand for new services will be managed through a combination of managing existing assets,
upgrading of existing assets and providing new assets to meet demand and demand
management. Demand management is defined here as the management of assets by the
manipulation of demand for services and practices include non-asset solutions, insuring against
risks and managing failures.
Opportunities identified to date for demand management are shown in Table 9. Further
opportunities will be developed in future revisions of this asset management plan.
Table 8 Demand Management
Service Activity Demand Management Plan
Community Engagement Engage with the community to identify justifiable community needs from
other expectations and consider only community needs consistent with
Shire’s charter.
Customer Requests Analyse customer requests to optimise the use and performance of
existing assets and look for non-asset based solutions to meet demand
for services.
Explanatory marketing and Help modify community behaviour through explanatory marketing and
education campaigns education campaigns.
Traffic load and volume Improve road and pavement performance through road mass
control restrictions and reducing traffic volumes.
4. Risk Management
Risk Management is defined in the Standards Australia AS/NZS ISO31000:2009 as
“coordinated activities to direct and control an organisation with regard to risk”. In an Asset
Management application, risk assessment and management facilitates:
Management of corporate responsibilities,
Identification of critical assets and the consequences of asset failures upon the customer
and the Shire,
Identification of potential failures and development of contingency plans,
Facilitation of decision making through prioritisation of potential actions, and
Development of Emergency Management procedures and protocols. The risk assessment and management procedures described in this section are based on
the International Infrastructure Management Manual 2006, Version 3 and include:
The identification of corporate process and asset failures,
Evaluation of the probability of the event occurring,
Assessment of the consequences of failure event,
Assessment of the risk exposure, and
Development of management and mitigation plans.
4.1 Risk Identification
1
Risk identification is the “process of finding, recognising and describing risks”. The process is
a brain storming exercise for each element of the management processes and assets and is
completed by asking the questions:
Can this fail?, and
What happens if the failure occurs?
The process is simplified by breaking the activities down into individual tasks and
responsibilities for each asset in turn. Once the failure event has been identified, the probability
and consequences of the event can be assessed.
4.2 Probability Assessment
2
Likelihood is “the chance of something happening”. The term probability is also used to assess
the statistical measure of the event occurring. In this document and the AM Software, a five
point assessment scale is used as follows:
Table 9 Probability Assessment Scores
Score Likelihood Definition PoF Frequency
A Almost Certain Is likely to occur in most circumstances 0.9 within 1 year
B Likely Will probably occur in most circumstances 0.5 1 to 2 years
C Moderate Might occur at some time 0.15 3 to 10 years
D Unlikely Could occur at some time 0.07 11 to 20 years
E Rare May occur in exceptional circumstances 0.02 >20 years
Assessments have been related to actual experience and the reliability of the processes and
assets.
4.3 Consequence Assessment
3
Consequence is the “outcome of an event affecting objectives” . The consequence must relate
to each specific failure event and represent the actual impact of a failure of process or asset.
The consequence assessment used in this document and the AM Software are categorised into
the impact of Customers, the Community and the State.
The five point scales used assesses risk consequences is defined in the following table:
1
AS/NZS ISO 31000:2009, Section 2.15 Definitions
2
Ibid Section 2.19 Definitions
3
AS/NZS ISO 31000:2009 Section 2.19 DefinitionsTable 10 Consequences Assessment Scale
Risk Score Assessment Safety Community Economic
1 Negligible Near miss Minimum interest, impact or Less than
disruption $25,000
2 Minor First Aid Some disruption to normal access, $25,000 to
required minor interest, local media reports, $250,000
claims from business for repairs or
other services.
3 Moderate Lost time injury Disruption to public access, $250,000
of up to 5 days increased potential for incidents. to $2.5m
Community discussion, broad
media coverage, significant
claims, questions from regulator.
4 Major Serious injury Extensive disruption to public $2.5m to
requiring access, incidents and accidents $25m
hospitalisation involving public, loss of confidence
in Shire, loss of substantial
business opportunity,
5 Severe Fatality Broad impact on community health Above
or the environment, public furore $25m
and investigations, management
changes demanded, loss of
substantial part of business, loss
of licence for large area or region
Consequences can also be assessed in terms of financial impact, occupational health and
safety, and environmental. Additional guidance is contained in Standards Australia AS/NZS
ISO 31000:2009.
4.4 Risk Exposure Assessment
Risk Exposure assessment is the evaluation process of combining the probability and
consequence assessment by matrix evaluation to decide the severity of the risk event and
consequently the action required to manage the risk exposure. The matrix evaluation tool used
in this document is included below:
Table 11 Risk Factor Assessment Matrix
Consequence
Likelihood Severe
Negligible Minor Moderate Major
(1) (2) (3) (4) (5)
Almost Certain
Medium High High Extreme Extreme
(5)
Likely (4) Medium Medium High High Extreme
Possible (3) Low Medium Medium High High
Unlikely (2) Low Low Medium Medium High
Rare (1) Low Low Low Medium Medium
The actions required for each risk exposure in order of severity are: Low – risks can be managed routine procedures and are unlikely to require the
application of specific resources or management systems.
Medium – risks can be managed by specific monitoring or response procedures with
management responsibilities specified.
High – risks cannot be accepted and require specific procedures and management
responsibilities that reduce the probability or consequence of the event.
Extreme – these events cannot be managed. Mitigation measures must be implemented
to actively reduce the probability or consequence of the event occurring.
4.5 Mitigation and Management Strategies
Mitigation and management strategies are action plans required to reduce the residual risk by
reducing either the probability or the consequence of a risk event. There were no risks or
processes identified with inherent risks that were either significant or higher to warrant mitigation
and management strategies.4.6 Heading 1 Example Summary of Risks
As a risk assessment is not yet been conducted, the following table provides a template for documenting any major corporate risk identified when the
risk assessment and management analysis has been completed.
Table 12 Risk Register - Major Corporate Risks
Risk Identified Probability Consequence Risk Rating Proposed Treatment Responsibility Completion
Date
Tba5. Lifecycle Management Plan
The Lifecycle Management (LCM) section of this Plan provides the broad strategies and work
programmes required to achieve the goals and standards, outlined in Sections 2 and 3 for the
assets.
Assets are created and acquired to deliver the required services for the Shire. These assets are
operated and maintained throughout their useful life and their performance and condition are
monitored to ensure they deliver the necessary service.
Section 5 presents an analysis of available asset information and the life cycle management
plans covering the key work activities necessary to run the asset portfolio including:
Operations – including administration costs, utilities costs, cleaning and the like;
Maintenance – proactive (planned) and reactive (unplanned) to keep the assets and
facilities serviceable, but not increase its service potential;
Renewal / replacement and rehabilitation to restore the buildings and infrastructure to
near original condition or replacement with another;
New capital, vested assets and levels of service (improvements), and regulatory
improvements including acquisition of new facilities or upgrade beyond the original
design;
Asset Disposals.
The assumption in this initial plan is that there are no changes to current Shire policies or in the
level of service provided. Options for future consideration include alternative service provision
models (eg service centralisation, multi-function buildings, use of non-Shire assets in the
community and the like). Each of the Asset categories are discussed separately below.
5.1 Roads
5.1.1 Background Data
Physical parameters
The Shire of Jerramungup has approximately 1,192 km of roads, with road maintenance and
construction programmes utilising the majority of Shire’s budgeted funds. For this plan the road
asset class includes the following categories:
Sealed roads and streets
Unsealed Gravel Roads
Formed Tracks
And a fourth category has been added (Unknown) as there are a number of roads yet to
be classified.Table 13 Road Assets
Road Types Sub Category Length in Km
Sealed Town 50.67
Rural Distributor 85.72
Unsealed Class 1 190.39
Class 2 444.56
Class 3 269.54
Formed Tracks 123.49
Unknown 27.41
Total 1191.78 Km
Main Roads (Gnowangerup-Jerramungup Road M5, South Coast Highway H8 and Borden-
Bremer Bay Road M4) are not maintained by the Shire and have been excluded from this AMS.
Town roads are sealed roads within the townships of Jerramungup, Bremer Bay and Boxwood
Hill. Rural Distributor are sealed connection roads between the towns. The AMS does not
include the lifecycle analysis of sealed roads, which will be included in later versions of this plan
when the age and condition information has been collected.
Infrastructure Drainage
Infrastructure drainage includes underground pipes & structures, lined and unlined channels,
detention basins, access pits, inlet structures, wetlands and pollution control structures. As
there was no information available on the extent or condition of infrastructure drainage, it has
not been considered in this version of the AMS.
Asset Condition
The Shire has developed an automated valuation model to determine the fair value of all roads
within the Shire of Jerramungup. In developing this linear regression model, fair value was used
as the dependent variable against a number of other independent variables in the data set that
were determined as being significant contributors to the variation in price. Asset condition was
one of these variables.
Asset Valuations
The Shire’s roads have been valued according to fair value methodology. Future revisions of
this plan will include a lifecycle cost replacement analysis based on the age condition and
utilisation rates of each asset.
A road is made up of many separate components that have different useful lives and residual
values. These separate components are as follows; clearing, earthworks and formation (usually
not depreciated) pavement (including gravel) road seal (asphalt, aggregate, concrete etc) kerb
& road furniture (eg. traffic control devices and signage)
The following useful life estimates have been applied to the Shire of Jerramungup road network:
Clearing and earthworks = not depreciated
Pavement (for sealed roads) = 2% (50 year useful life)
Pavement (for unsealed/gravel roads) = 3.33% (30 year useful life)
Seal = 5% (20 year useful life)
Kerbing = 3.33% (30 year useful life)
Drainage = 2% (50 year useful life) Other = 2% (50 year useful life)
5.1.2 Current Maintenance Activities
Routine maintenance is the regular on-going work that is necessary to keep assets operating,
including instances where portions of the asset fail and need immediate repair to make the
asset operational again. Maintenance includes reactive, planned and cyclic maintenance work
activities.
Reactive maintenance is unplanned repair work carried out in response to service requests and
management/supervisory directions.
Planned maintenance is repair work that is identified and managed by the Shire through the
budget preparation process.
Cyclic maintenance is replacement of higher value components/sub-components of assets that
is undertaken on a regular cycle including road grading, etc. This work generally falls below the
capital/maintenance threshold.
Road maintenance is performed as required, with activities such as road grading scheduled to
be carried out on a regular basis. All queries and requests relating to roads, drainage and
infrastructure should be directed through the Shire office where one of the administration staff
will record and lodge a customer action request and the matter will be responded to by the
relevant employee. Road maintenance requests can also be lodged online.
The Shire has decided to limit roads maintenance expenditure to the current levels and has
used the preparation of this plan to re-evaluate the maintenance strategy. Sealed roads will be
maintained on a reactive maintenance basis, with potholes and defects being repaired as they
occur.
Unsealed roads are regraded and rolled on a frequency suited to the utilisation rate of the road.
For this AMS, the Shire provided a listing of all roads and a series of maps. The Roads Register
included in Appendix A made assumptions on the road types based on the available documents
and information provided by the Shire staff during discussion on site. All unsealed roads have
been classified under the following four maintenance categories:
Type 1 rural distributor which connects several minor roads or provides a direction
connection between the towns will be graded and rolled up to four times each year.
Type 2 minor roads which connect rural distributors to individual property roads will be
graded and rolled twice per year.
Type 3 roads provide access to properties. These roads will be rolled and graded once
per year if required.
Type 4 roads are formed tracks, which will be graded on a three yearly cycle if needed.
The Roads Register file extracted from ROMAN included several roads that were not
found in the maps and plans provided by the Shire. These roads have been assumed to
be Type 3 roads for the purposes of maintenance and financial planning.
The Shire advised that the current unsealed maintenance costs were approximately $850 per
road kilometre for each grade and roll and that the road crew had a production capability of one
kilometre per hour. Therefore the crew should be able to grade and roll 1408 kilometres per
year at an efficiency rate of 80% on a standard work week of 40 hours. The analysis of
unsealed roads maintenance requirements indicate that the crew need to maintain 1989 road
kilometres per year and therefore need to work overtime or be supplemented with a second
crew for four months of each year. This can be achieved by using authorised contractors.Current maintenance expenditure levels are considered to be adequate to meet required
service levels. Future revision of this asset management strategy will include linking required
maintenance expenditures with required service levels.
Road & Footpath Maintenance
1400000
1200000
1000000
800000
600000
Maintenance
400000
200000
0
Figure 4 Road and Footpath Maintenance 2013/14 to 2022/23
5.1.3 Renewals
Renewal expenditure is major work which does not increase the asset’s design capacity but
restores, rehabilitates, replaces or renews an existing asset to its original service potential.
Work over and above restoring an asset to original service potential is upgrade/expansion or
new works expenditure.
Projected future renewal expenditures are forecast to increase over time as the asset stock
ages. The costs for sealed and unsealed roads have not been completed for this version of the
AMP.
Shire's roadworks programme takes up a significant portion of the total budget and is prepared
well before the budget is formulated, taking into account the funds that can be raised from all
areas, including rate revenue, State grants and Federal grants, to reduce the impact on
ratepayers. Due to the amount of work that goes into the roadworks budget preparation and the
costs involved in roadworks construction, the Shire is not able to approve additional road
construction works during the year without deleting works already included.
5.1.4 New Works (Asset Creation)
New works are those works that create a new asset that did not previously exist, or works which
upgrade or improve and existing asset beyond its existing capacity. They may result from
growth, social or environmental needs. Assets may also be acquired at no cost to the Shire
from land development.
New assets and upgrades/expansion of existing assets are identified from various sources such
as Councillor or community requests, identified by strategic plans or partnerships with other
organisations.Roads and Footpaths Renewal & New
Works
2500000
2000000
1500000
1000000
Renewal & New Works
500000
0
2021/22
2013/14
2014/15
2015/16
2016/17
2017/18
2018/19
2019/20
2020/21
2022/23
Figure 5 Road and Footpath Renewal and New Works 2013/14 to 2022/23
5.1.5 Asset Disposal
Disposal includes any activity associated with disposal of a decommissioned asset including
sale, demolition or relocation. For the purpose of this plan, disposal of road is defined as being
the complete removal of a road (road closure and sale or other use).
There are no roads disposals currently planned within the Shire. Documentation of potential
and agreed asset disposals will be included in future revisions of this AMS following
investigations relating to the potential rationalisation of Shire owned assets.
5.2 Footpaths
An inventory of the footpaths through the Shire has been completed for this AMS.
5.2.1 Background Data
Physical parameters
Includes concrete, paved or gravel which are separate structures from the road.
The Shire’s long term planning in the areas of footpaths has also been actioned with the
installation of footpaths in Bremer Bay on Bennett, Roderick and between The Esplanade and
Borden Bremer Bay Road as identified in the Bremer Bay Shared Path Plan. This coordinated
approach seeks to deliver an achievable footpath upgrade and installation program and enable
the Shire to apply for funding through the Country Pathways program.
Asset Condition
The Shire has developed an automated valuation model to determine the fair value of all
footpaths within the Shire of Jerramungup. In developing this linear regression model, fair value
was used as the dependent variable against a number of other independent variables in the
data set that were determined as being significant contributors to the variation in price. Asset
condition was one of these variables.
Asset Valuations
The Shire’s footpaths have been valued according to fair value methodology. Future revisions of
this plan will include a lifecycle cost replacement analysis based on the age condition and
utilisation rates of each asset.5.2.2 Current Maintenance Activities Routine maintenance is the regular on-going work that is necessary to keep assets operating, including instances where portions of the asset fail and need immediate repair to make the asset operational again. Maintenance includes reactive, planned and cyclic maintenance work activities. Reactive maintenance is unplanned repair work carried out in response to service requests and management/supervisory directions. The Shire does not currently use a computerised maintenance management system (CMMS). Maintenance activities include inspection, assessing the condition against failure/breakdown experience, prioritising, scheduling, actioning the work and reporting what was done to develop a maintenance history and improve maintenance and service delivery performance. Cyclic maintenance is replacement of higher value components/sub-components of assets that is undertaken on a regular cycle including repairing cracked and broken footpaths and repairing potholes in bitumen footpaths. This work is generally of a minor nature and completed by the Shire’s workforce and a reactive basis. 5.2.3 Renewals Renewal expenditure is major work which does not increase the asset’s design capacity but restores, rehabilitates, replaces or renews an existing asset to its original service potential. Work over and above restoring an asset to original service potential is upgrade/expansion or new works expenditure. Projected future renewal expenditures are forecast to increase over time as the asset stock ages. The costs for renewals will be included in future versions of the AMP. 5.2.4 New Works (Asset Creation) New works are those works that create a new asset that did not previously exist, or works which upgrade or improve an existing asset beyond its current capacity. These may result from growth, social or environmental needs. Assets may also be acquired at no cost to the Shire from land development. New assets and upgrades/expansion of existing assets are identified from various sources such as Councillor or community requests, identified by strategic plans or partnerships with other organisations. 5.2.5 Asset Disposal Disposal includes any activity associated with disposal of a decommissioned asset including sale, demolition or relocation. For the purpose of this plan, disposal of footpath is defined as being the complete removal of a footpath (footpath closure and sale or other use). There are no current asset disposals planned for footpaths. Documentation of potential and agreed asset disposals will be included in future revisions of this AMP following investigations relating to the potential rationalisation of Shire owned assets.
You can also read


