Annual !nancial statement release - Klarna Bank AB (publ) January-December 2020
←
→
Page content transcription
If your browser does not render page correctly, please read the page content below

Annual financial
statement release
Klarna Bank AB (publ)
January–December 2020

Table of
contents.

3   Financial information
4   Highlights of the year
5   To our shareholders
7   Key achievements 2020
13 Business overview
18 Group financials
25 Notes with accounting principles
45 Parent company financials
Financial information
The information is presented for the Klarna Bank Group.

Full year 2020
Strong performance of the business over the year has delivered:

46%                       (32)   1
                                                                                       USD 53bn                                     3

                                                                                                                                    (35)

Gross merchandise volume2 – YoY growth                                                 Gross merchandise volume – SEK 484bn (332)

40%                       (31)                                                         USD 1,087m                                              (753m)

Total net operating income – YoY growth                                                Total net operating income – SEK 10,000m (7,155)

29.5%                                   (28.1)

CET 1 ratio

July–December 2020

46%                        (35)                                                        USD 31bn                                     4

                                                                                                                                        (19)

Gross merchandise volume – YoY growth                                                  Gross merchandise volume – SEK 270bn (184)

43%                       (30)                                                         USD 627m                                     (400)

Total net operating income – YoY growth                                                Total net operating income – SEK 5,482m (3,841)

29.5%                                    (28.1)

CET 1 ratio

All growth figures are based on SEK results figures.
1

2
    Total monetary value of sold products and services through Klarna over a given period of time.
3
 Klarna’s results are reported in SEK. To arrive at USD values, the average exchange rates for 2019 and 2020 have been used;
1 USD equals approximately 9.5 SEK for full year 2019, and 1 USD equals approximately 9.2 SEK for full year 2020.
4
 Klarna’s results are reported in SEK. To arrive at USD values, the average exchange rates for 2019 and 2020 have been used;
1 USD equals approximately 9.6 SEK for the last six months 2019, and 1 USD equals approximately 8.7 SEK for last six months 2020.
Highlights of the year.
       Accelerated growth                                                                    Active retailers globally
       Year-on-year growth in gross merchandise volume (rolling                              Growth in number of retailers with transactions during the
       12 months).                                                                           last twelve months.
                                                                                                                                            1.4x vs 2019
                                     SEK       Constant FX

                                                                                48%

                                                                     41%          46%
                                                             39%

                                                   34%
                                            31%
              29%        28%     28%

              2019       2019    2019       2019   2020 2020         2020 2020                                     2019                           2020
               Q1         Q2      Q3         Q4     Q1   Q2           Q3   Q4

      US app installs                                                                        Global app installs
                                                                                                                            2.3x vs 2019
       10m                                                                                   20m
                                             2.6x vs 2019

                          2019                     2020                Closest                              2019                    2020              Closest
                                                                   competitor (2020)                                                              competitor (2020)

      Savings account                                                                        Vibe - Klarna loyalty program
      Immediate traction for our savings accounts with                                       The first loyalty program of its kind, rewarding consumers
      competitive interest rates during the first 12 weeks in                                who pay on time. Launched in September. # of vibe
      Sweden. Amount of SEK in deposit account.                                              members in the US.

      4bn
                                                                                              1m

 # of weeks
post launch   0      1      2    3      4     5    6     7    8     9      10    11     12            Sep 20              Oct 20           Nov 20          Dec 20

       Average number of orders                                                              Managing down late fees
       Our most mature market, Sweden, showcases the strength                                Indexed late fees as share of volume. Late fees are defined
       of our offering and the frequency per cohort increases                                as fees that originate from consumers not paying on time.
       over time.

                                                                                 ~27x          100

                                                                                 ~20x
                                                                                 ~17x
                                                                                 ~16x
                                                                                 ~14x
                                                                                 ~11x
                                                                                 ~9x

                                                                                                                                                                      15

                     2014               2016              2018              2020                     2013    2014     2015         2016    2017     2018   2019     2020
To our Shareholders
Dear Shareholders
2020 will be forever remembered as the year Covid 19 changed everything we define as everyday life. This is a
tragedy that sadly has impacted many and I want to take the opportunity to share my condolences with
everyone that has suffered and lost loved ones to the pandemic. Covid 19 has also had a huge impact on
businesses big and small everyone is simply trying to find their own way through this but I particularly feel for
those whose livelihoods have been impacted over the last year. To our own Klarna employees I am deeply
impressed with how you have seamlessly managed the transition to new ways of working while continuing with
the same engagement passion and determination to deliver a superior experience for our consumers and
retailers. Klarna always seeks to move at speed but how our employees not only adapted but met the
accelerated demand with ease has been quite remarkable. Together we have maintained the high level of
service that our consumers and partners have come to expect from us. This makes me very proud.
The last year has seen consumer expectations of how they bank pay and shop grow despite the limiting factors
of the pandemic. More and more people are shopping online across demographics and in new retail sectors
gaining trust and confidence in the online marketplace. I cannot see how this will return to pre pandemic levels
now since this behaviour is so well established. But as we return to physical stores consumers now more than
ever expect a seamless convergence of online and in store experience. Why should shopping in store limit what
a good shopping experience now looks like Why shouldn t consumers be able to shop in person but pay in a
way they do online that suits them better These are challenges Klarna has already responded to. While we
have supported our retailers to expedite their transition to online we also accelerated the launch of new
in store services meeting evolving consumer expectations and supporting retail partners in creating a smoooth
experience across channels. Naturally our ambitions for 2021 are high more products across more markets
continued innovation and creating new ways for retailers to connect with consumers building on our extensive
shopper insight and technology. And all of this is on one platform and with one global partner Klarna.
While the last decade was about the disruption of retail I am convinced this decade will be about the disruption
of retail banking and the credit card industry and to the benefit of consumers. In the US alone the Federal
Reserve Bank of New York reported that credit card balances are 108 billion lower than in 20195 and this is the
largest yearly decline in the history of the data since 1999 accelerating the structural shift from credit to
debit despite the economic pressures of a pandemic. Consumers are demanding greater control of their
finances simplicity and flexibility and this is driving both Klarna s ambitions for innovation and our growth. In
2020 our volumes grew by 46 to USD 53bn resulting in USD 1.1bn of net operating income for Klarna 40 .
Our continued investment in innovation means we are now the preferred growth partner for more than 250 000
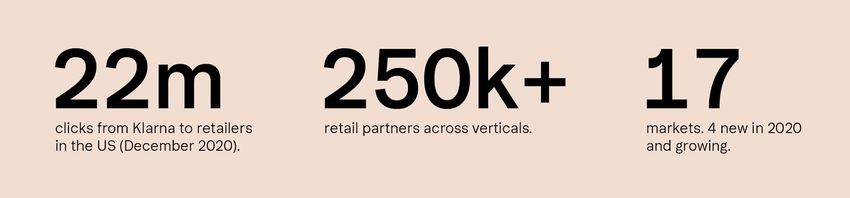
retailers working with many of them across geographies as a truly global partner. In the US we have reached a
record in shopping volume in the app and an all time high in monthly active app users. At the close of Q4
5
https www.newyorkfed.org microeconomics hhdc
5 Klarna Bank AB publ Annual Financial Statement Release 2020Klarna was ranked in the Top 10 most downloaded shopping apps in US app stores for the entire period ensuring Klarna is a key competitive advantage for retailers to attract new consumers. As a result thousands of new partners have joined Klarna including Macy s Sephora Urban Outfitters Lululemon and Etsy. We are now working with more top 100 US retailers than all our closest competitors combined and the pipeline of new partners is strong. Our offering is incredibly relevant and it is clearly resonating with our 87 million active consumers. The strength of the Klarna platform is powering our growth but we can never be complacent. We must evolve every day and continue to raise the bar for the industry. We are strongly committed as a business to positively contribute to a more sustainable world. Klarna s own carbon neutrality for the last few years is a building block for an ambitious series of actions we will undertake in 2021. The global context we operate in continues to shift at a rapid pace and we are investing in key areas including people to further strengthen our capabilities and efficiencies laying the foundation for continued growth. This year more than 30 of our new hires were within engineering reflecting our focus on innovation and anticipating consumer needs that have yet to crystallize. We will continue to build on our global offering at pace. In 2020 we launched our pay later services in four new markets enabling retail partners to integrate with just one partner and platform across 17 global markets. Based on this and our strong balance sheet and decreasing credit losses in relation to volume I feel confident that we are in a very strong position to meet the accelerated demand in the coming years. We believe that the value we create is directly linked to the problems that we can solve for our consumers. As we look forward we see a tremendous opportunity to continue to serve our consumers in new and better ways by enabling them to shop pay and bank in a convenient transparent and intuitive way saving them time and money and liberating them from worry. Financial health is key to this ambition and Klarnasense our global platform to support mindful and healthy spending habits will be developed to support even more consumers to shop wisely and sustainably managing their finances with confidence. I want to thank the millions of consumers who believe in us appreciate what we do and challenge us to never stop improving. We are still just at the beginning and our focus on providing you with the best possible experience remains relentless. To our retail partners this has been far from an easy year and I am impressed by your resilience and immense adaptability and what we have been able to accomplish together in challenging circumstances. At Klarna we remain committed to helping you by connecting you to consumers delivering a superior experience and supporting you in your growth ambitions every day. To our shareholders we are thankful for the confidence you continue to show in our ambitious plans particularly during this period and we are grateful for your continued support. Sebastian Siemiatkowski CEO and Co founder 6 Klarna Bank AB publ Annual Financial Statement Release 2020
Key achievements
The year of 2020 was defined by Covid 19. The pandemic is a tragedy and has had wide ranging
impacts at a personal national and economic level. Like everyone else Klarna had to adapt but we
have seen two clear changes an acceleration in the structural shift of preference from credit to
debit amongst consumers and e commerce becoming the increasingly dominant and at times the
only engagement channel for retail.
Our ambitions for 2020 were naturally high increase consumer preference by building the most
consumer centric offering in the industry grow our user base by enabling Klarna wherever and
however consumers wish to shop and confirm our position as the preferred growth partner for
retailers globally. We are pleased with the results but most importantly they establish a strong
platform for continued growth in the year ahead.
● 87 million active consumers6 globally are now choosing Klarna for a healthier simpler and
smarter way to shop pay and bank every day.
● For 250 000 retailers including Macy s Ralph Lauren Sephora Urban Outfitters Etsy North
Face Saks OFF 5TH H M and Lululemon Klarna is the global partner of choice to connect
them with consumers drive loyalty and deliver growth.
● US growth continues to accelerate strongly with more than 1 million new consumers joining
Klarna each month in Q4 the Klarna app reaching record shopping volumes in December
and at the close of Q4 we were ranked among the Top 10 most downloaded shopping apps in
US app stores for the entire period.
● Record gross merchandise volumes processed on the platform USD 53bn 46 generating
USD 1.1bn in Total net operating income 40 breaking the USD 1bn threshold for the first
time.
● Credit losses as a percentage of total gross merchandise volume decreased across all major
markets.
● Proven concept to expand to new markets pay later offering live in four new markets
Australia Belgium Spain and Italy and established presence in China to support Chinese
retail partners scaling to a global consumer base.
6
Defined as having used Klarna s services at least once the last 12 months.
7 Klarna Bank AB publ Annual Financial Statement Release 2020Our commitment to consumers and retailers
Klarna is committed to helping consumers shop pay and bank with ease. Our continued investment
in flexible and innovative products under our trusted and engaging brand offers consumers
convenience inspiration and control.
Our global partnerships with retailers give consumers a superior shopping experience while Klarna
provides retailers with a smooth operating platform and enhanced customer acquisition which
powers their growth. Covid 19 has forced retailers to quickly adapt to a transformed retail
environment by moving to predominantly online channels but equally recognizing the importance of
developing an in store experience which meets evolving consumer expectations. The investment we
have made in our offering has supported this demand. This has driven adoption of Klarna by a
broader demographic of consumers as well as retailers across new vertical segments.
In e ing fo g o h in ma and in i i e od c
● The Kla na a powers the whole shopping journey giving consumers inspiration
convenience and rewards. Continued investment in new functionality such as price drop
notifications and wish lists is driving engagement and enabling consumers to make the best
purchases for them at the right time. The offering is clearly resonating monthly active app
users reached record levels of 18 million globally and 3.5 million in the US.
● Vibe the first loyalty program of its kind in our industry is now live in the US and Australia
and rewards consumers who pay for their goods on time gaining one million members during
the first three months.
● Kla na in o e is now live in 10 markets enabling Klarna contactlessly for consumers while
supporting multichannel retailers. US consumers can now shop in over 60 000 physical
stores while in Australia Klarna is available in any store through the app.
● The Kla na ca d has seen strong volume growth of 137 in Sweden and Germany as it
enables consumers to pay now or pay later with Klarna everywhere with the added benefits
of no fees no added FX cost and instant purchase notifications. The popularity of the Klarna
card is evident as Klarna users shift a larger portion of their everyday purchases to Klarna
and we have seen an increase of 160 in volumes after sign up.
8 Klarna Bank AB publ Annual Financial Statement Release 2020● The integrated banking experience to manage purchases payments and a ing on one
platform is now live in Sweden and SEK 4bn was deposited through our new accounts within
the first 12 weeks.
Em o e ing con me i h con ol and con enience
Consumers should have complete control of their finances saving them time money and worry. Our
consumer centric offering is empowering consumers to intuitively manage their purchases. To
further expand our efforts within this area we have launched
● The global platform Kla naSen e encouraging more mindful shopping has resonated
strongly with consumers and will be launched across markets starting in 2021.
● The Ne e Fo ge Te highlighting the services and app features to pay on time
incentivised by the opportunity to earn back any existing fees.
● Mi ion Ze o Nollmissionen our commitment to reduce complaints to zero and increase
transparency as customer satisfaction is a key driver of customer acquisition and retention.
Complaints in Sweden have reduced by 50 since 2018. It will become a global platform in
2021.
● The global Con me Co ncil allowing us to engage directly with consumers and their
feedback is used to improve our products and drive customer satisfaction.
Wh million con me cho e Kla na
The global shift towards e commerce continues and more than 87 million active consumers
have used Klarna in 2020 as they look for a smarter way to shop pay and bank. To find out
even more about how Klarna supports consumers we surveyed 7 100 UK Klarna consumers
and below are the three main reasons they chose to shop with Klarna.
Sol ion ha gi e con me con ol o e hei e onal finance
said they use us to spread the cost of a purchase into smaller more manageable
amounts
Klarna offers various flexible payment solutions and app features that empower consumers
to manage their finances and budget in a responsible manner.
Engaging fea e ha make ho ing moo h
said they use us to try on a few different sizes at home and keep the one that fits best
The Klarna app provides an end to end hassle free shopping experience that helps
consumers through every step. From discovering what they love to reporting a return it
allows consumers to try on their favorite items in the comfort of their home without having to
part with any money before deciding what they want to keep.
9 Klarna Bank AB publ Annual Financial Statement Release 2020Comfo and afe hen ho ing online
3 said they use us because of the additional protection it offers them when shopping
online
Knowing who to trust when shopping online can be hard. Earning consumers trust has
always been a top priority at Klarna and consumers can count on Klarna s Buyer Protection
Policy which states our commitment to supporting our consumers in finding the best
solution in the unlikely event that there is a problem with their purchase as well as in our
capacity to fully authenticate retailers who integrate Klarna into their checkout processes.
Global a ne of choice
Global retailers want global partners. One platform across 17 markets with 87 million active
consumers makes Klarna the global partner of choice.
● Klarna has over 250 000 retailer partners live globally including some of the top 100 highest
grossing retailers in the US7 H M Macy s Sephora Ralph Lauren Etsy Urban Outfitters
IKEA Samsung One Peloton Anthropologie and Nike.
● The Klarna app has proven to be a key driver of customer acquisition for our retail partners
and in December alone we enabled 22 million monthly clicks to retailers in the US. As we
continue to expand our omnichannel experience globally our consumer base grows to the
benefit of our retail partners.
● Investment in our brand continues to benefit our retail partners with campaigns designed to
engage consumers and drive preference and loyalty for Klarna. We reached 1.2 billion total
global impressions by partnering with Lady Gaga and Bea Åkerlund for Valentine s day Get
What You Love . Sneaker lovers Sneakerheads and gamers Playing for keeps played to
vertical sectors while our Clothes Love All celebrated diversity and body positivity
reflecting our brand values.
7
Data Digital Commerce 360 2020
10 Klarna Bank AB publ Annual Financial Statement Release 2020Kla na Se ho a
Smooo h fa e ac o channel and ma ke
Sephora wanted to provide new levels of financial flexibility online in app and in store across
the US and Canada to help their clients shop more easily for the beauty brands and
essentials they love. Klarna enabled Sephora to go live with new payment options across
markets and channels in less than two months making us the partner of choice across global
markets with Klarna launching across Sephora in Italy and Spain.
Mee ing con me need d i ing con me cha e
Being able to spread a payment over time is liberating for our clients They can buy
complimentary items that complete their collection color palette or skin care regime all at
the same time rather than split them over two or three transactions
Carolyn Bojanowski General Manager of E commerce at Sephora US
Kla na d i e e aile g o h
Sephora launched with Klarna in May 2020 and has so far seen
● 65 increase in average order value AOV in physical stores in North America.
● 36 increase in AOV on their mobile app in North America.
● 35 increase in AOV on their webstore in North America.
11 Klarna Bank AB publ Annual Financial Statement Release 2020Strong base of more than
retail partner
12 Klarna Bank AB publ Annual Financial Statement Release 2020Business overview.
Business overview The Board and the CEO of Klarna Bank AB publ hereby submit the report for the period July 1 December 31 2020 and the full year. Klarna Bank AB publ s parent company is Klarna Holding AB publ . This report presents the figures for Klarna Bank AB publ and its subsidiaries. The report has been prepared in thousands of Swedish kronor unless otherwise stated. Info ma ion abo he b ine Klarna Bank AB publ is an authorized bank and is under the supervision of the Swedish Financial Supervisory Authority Finansinspektionen . Klarna is a leading global provider of innovative payments and shopping services and we continuously develop new products and services to elevate the entire shopping experience for consumers which in turn drives value for our retail partners. At the core of everything we do is the focus to give our consumers the choice and control of how to shop and manage their personal finances in a sustainable way. Together our products and services build the Klarna everywhere concept enabling consumers to choose how where and when to shop pay and bank with Klarna based on their own needs and preferences. Our success to date is a result of the high degree of trust that has been built with consumers retailers and partners in all markets. This trust is critical in the financial sector and maintaining it requires that we operate with the highest ethical standards and strive to do what is right every day. Such standards are necessary across all parts of the business from the handling of sensitive personal data to a robust corporate governance framework and ensuring all employees are treated with respect in a secure working environment. Klarna s personal data protection officer is responsible for ensuring that all personal details are handled in accordance with the General Data Protection Regulation GDPR . Klarna was founded in 2005 in Sweden and has been a fully licensed bank since 2017 active in 17 markets. 14 Klarna Bank AB publ Annual Financial Statement Release 2020
B    ine   e   l

Net operating income

In 2020 growth accelerated in both new and core markets. The step change in e commerce
penetration globally the structural shift from credit to debit combined with our attractive offering
and enhanced features has driven this growth. As a result gross merchandise volume increased by
46    YoY to SEK 484bn USD 53bn and Total net operating income increased by 40                       YoY to SEK
10 000m USD 1 087m at period end.

Merchant revenue increased by 57         above the level of gross merchandise volume growth as
interest free products in the US and the UK grew well ahead of the group average. Commission
income grew at a lower pace by 47       YoY to SEK 7 673m USD 834m as we continued to actively
manage down late fees in the Nordics. We intend to diversify our revenue streams with a particular
focus on affiliate services as we become a key customer acquisition channel for retailers.

Growth in interest income SEK 3 265m USD 355m of 17              YoY remained below that of total net
operating income as consumer demand for our interest free shorter duration payment products
outpaced other payment alternatives.

Interest expenses grew to SEK 601m USD 65m at period end driven by our rapid growth of gross
merchandise volume as well as additional liquidity buffers to ensure business stability.

Operating expenses

We are committed to investing in expanding and enhancing our consumer focused product offering
and increased brand awareness with a focus on the US and UK and continued market expansion.
This year we launched in four new markets Australia in partnership with Commonwealth Bank of
Australia CBA Belgium Spain and Italy. Consequently our operating expenses increased by 43                       as
we built scale in every market with the goal of becoming the clear global market leader. This
expansion has required increased resources globally with the average number of full time
equivalents FTEs increasing by 44     compared to the same period last year to 3 238.

Net credit losses of SEK 2 531m USD 275m increased by 36                slower than gross merchandise
volume showing continued improvement during the year. As a proportion of total gross merchandise
volume losses fell across all our major markets with the sharpest improvements in the US and the
UK. We continue to build our global database and leverage our underwriting technology across
markets which allows us to simultaneously optimize acceptance rates for retailers and have a
prudent approach towards our consumers whilst driving a continuous improvement in relative losses
on a market by market basis.

15                                                     Klarna Bank AB publ   Annual Financial Statement Release 2020
Liquidity and funding

Volume growth contributed to an increase in Loans to the public of 41               YoY to SEK 41 718m USD
4 535m . Growth has been funded by the increase in Deposits from the public which are primarily
driven by EUR deposits.

The average duration of our credit portfolio is 40 days. This means we can steer balance sheet
growth and related risk quickly. In the context of the current macro environment we maintain a
reserve of SEK 70m as market conditions remain uncertain in light of Covid 19 and its related effects.

Capital adequacy has strengthened compared to the last year due to equity raises in H2 2020 and
Klarna is now at a CET1 ratio of 29.5   creating a strong capital position.

B anche ab oad

Klarna Bank AB publ operates Klarna Bank AB UK branch.

Since June 2020 Klarna Bank AB publ operates Klarna Bank AB German branch.

Significan e en    d    ing he e iod

Klarna Bank AB publ has added a reserve totalling SEK 70m during the period for potentially
increased credit risk given the Covid 19 situation and its effect on macroeconomic factors.

On June 1 2020 a cross border merger between Klarna GmbH and Klarna Bank AB publ was carried
out. Klarna GmbH was merged into Klarna Bank AB which is present in Germany through its German
branch Klarna Bank AB German Branch. The merger resulted primarily in an increase in tangible
assets of SEK 400m an increase in equity of SEK 85m and in lease liabilities of SEK 190m in Klarna
Bank AB publ .

In June November and December 2020 Klarna Bank AB publ received unconditional shareholders
contributions of SEK 1 000m SEK 500m and SEK 1 000m respectively from Klarna Holding AB publ .

F    e de elo men

Klarna continues to establish its position as a leading global payments provider and shopping service
by creating an elevated shopping experience supporting retailer growth and driving consumer
engagement and loyalty. With a proven concept for market expansion Klarna will continue to grow by
entering new markets and continuing to diversify revenue streams including expanding new
non credit and affiliate services. Klarna will further enhance the offering towards both retailers and
consumers across markets and following the successful launch of the savings accounts Klarna will

16                                                      Klarna Bank AB publ   Annual Financial Statement Release 2020
go further into establishing an integrated banking experience for consumers. By continuing to build
global consumer centric products that create an exciting shopping experience Klarna will be able to
offer services that are even more tailored to each consumer therefore setting up a platform for
driving sustained preference and growth for the future.

Ri k managemen

Klarna is through its business activities subject to a number of different risks where credit risk is the
most significant one. Other major risks are operational risk liquidity risk and business risk.

The external regulations set forth requirements for good internal control identification and
management of risks as well as responsibilities for internal control functions. The Board and
management regularly decide on policies and instructions for the governance and management of
risks including risk appetite and tolerance limits.

The basis for the risk management and internal control framework is the three lines of defense
model. The first line of defense refers to all risk management activities carried out by line
management and staff. All managers are fully responsible for the risks and the management of these
within their respective area of responsibility.

The second line of defense refers to Klarna s independent control functions that report to the CEO
and the Board. The functions consist of Risk Control Engineering Assurance and Compliance. To
ensure independence these functions are not involved in business operations but set the principles
and framework for risk management facilitate risk assessment and perform independent control
including reporting of adherence to risk appetites limits and frameworks as well as ensuring that
operations are carried out in compliance with external regulations and internal policies. They shall
also promote a sound risk management and compliance culture by supporting and educating
business line managers and staff.

The third line of defense refers to the Internal Audit function which performs independent periodic
reviews of the governance structure and the system of internal controls. The Board has appointed
Deloitte as internal auditors.

17                                                      Klarna Bank AB publ   Annual Financial Statement Release 2020
Group
financials.
Five Year Summary Jan - Dec, Group
    Amounts in SEKk                                   Jan - Dec 2020 Jan - Dec 2019 Jan - Dec 2018 Jan - Dec 2017 Jan - Dec 2016
    Income statement
    Total net operating income                           10,000,104           7,154,668         5,450,781         4,158,045         3,289,503
    Operating profit                                     −1,629,127          −1,088,649            160,910           523,987           168,300
    Net profit for the year                              −1,375,809             −902,356           105,224           345,613           113,427

    Balance sheet
    Loans to credit institutions                          2,614,447           1,907,129         2,367,631         1,211,778         1,234,684
    Loans to the public                                  41,717,591          29,654,552        19,979,002        13,874,164         8,450,037
    All other assets                                     17,463,216           8,305,879         5,513,199         3,901,290         2,397,103
    Total assets                                         61,795,254          39,867,560        27,859,832        18,987,232        12,081,824

    Liabilities to credit institutions                    2,414,897           4,939,524         1,418,054            396,965           754,944
    Deposits from the public                             30,834,677          12,287,653        14,581,769         8,491,654         5,839,490
    All other liabilities                                22,221,717          17,344,917         7,717,750         6,065,083         2,870,025
    Total equity                                          6,323,963           5,295,466         4,142,259         4,033,530         2,617,365
    Total liabilities and equity                         61,795,254          39,867,560        27,859,832        18,987,232        12,081,824

    Key ratios and figures1
    Return on equity                                           −28.0%              −23.1%              3.9%             15.8%              6.6%
    Return on assets                                            −2.7%               −2.7%              0.4%              2.2%              1.1%
    Debt/equity ratio                                              7.7                 6.2              4.7                3.7               3.1
    Equity/assets ratio                                         10.2%               13.3%             14.9%             21.2%             21.7%
    Cost/revenue ratio                                          91.0%               89.2%             82.6%             75.4%             82.0%

    Own funds (Total capital)                            13,529,578           8,448,158         3,424,327         2,830,504         1,928,585
    Capital requirement                                   3,391,228           2,115,637         1,820,881         1,244,297            820,138
    Total capital ratio                                         31.9%               31.9%             15.0%             18.2%             18.8%

    Average number of full-time equivalents                     3,238               2,248             1,713             1,380             1,244

1
    See "Definitions and Abbreviations" for definitions of how the ratios are calculated.

19                                                                               Klarna Bank AB (publ) - Annual Financial Statement Release 2020
Five Year Summary Jul - Dec, Group
Amounts in SEKk Jul - Dec 2020 Jul - Dec 2019 Jul - Dec 2018 Jul - Dec 2017 Jul - Dec 2016
Income statement
Total net operating income 5,482,244 3,840,588 2,946,510 2,264,878 1,713,529
Operating profit −939,173 −1,010,887 49,263 203,480 34,895
Net profit for the period −824,051 −818,828 34,206 117,169 16,931
Balance sheet
Loans to credit institutions 2,614,447 1,907,129 2,367,631 1,211,778 1,234,684
Loans to the public 41,717,591 29,654,552 19,979,002 13,874,164 8,450,037
All other assets 17,463,216 8,305,879 5,513,199 3,901,290 2,397,103
Total assets 61,795,254 39,867,560 27,859,832 18,987,232 12,081,824
Liabilities to credit institutions 2,414,897 4,939,524 1,418,054 396,965 754,944
Deposits from the public 30,834,677 12,287,653 14,581,769 8,491,654 5,839,490
All other liabilities 22,221,717 17,344,917 7,717,750 6,065,083 2,870,025
Total equity 6,323,963 5,295,466 4,142,259 4,033,530 2,617,365
Total liabilities and equity 61,795,254 39,867,560 27,859,832 18,987,232 12,081,824
Key ratios and figures1
Return on equity −28.0% −23.1% 3.9% 15.8% 6.6%
Return on assets −2.7% −2.7% 0.4% 2.2% 1.1%
Debt/equity ratio 8,2 6.5 4.9 3.5 3.2
Equity/assets ratio 10.2% 13.3% 14.9% 21.2% 21.7%
Cost/revenue ratio 92.8% 93.9% 83.9% 76.7% 84.9%
Own funds (Total capital) 13,529,578 8,448,158 3,424,327 2,830,504 1,928,585
Capital requirement 3,391,228 2,115,637 1,820,881 1,244,297 820,138
Total capital ratio 31.9% 31.9% 15.0% 18.2% 18.8%
Average number of full-time equivalents 3,129 2,416 1,804 1,456 1,194
1
See "Definitions and Abbreviations" for definitions of how the ratios are calculated.
20 Klarna Bank AB (publ) - Annual Financial Statement Release 2020Income Statement, Group Amounts in SEKk Note Jul - Dec 2020 Jul - Dec 2019 Jan - Dec 2020 Jan - Dec 2019 Interest income calculated according to the effective interest rate method 4 1,673,274 1,488,687 3,264,747 2,794,769 Interest expenses 5 −323,078 −210,870 −601,096 −368,203 Net interest income 1,350,196 1,277,817 2,663,651 2,426,566 Commission income 6 4,250,884 2,843,844 7,672,573 5,232,181 Commission expenses −330,292 −275,744 −574,101 −476,023 Net result from financial transactions 118,610 −45,376 92,140 −76,437 Other operating income 92,846 40,047 145,841 48,381 Total net operating income 5,482,244 3,840,588 10,000,104 7,154,668 General administrative expenses −4,850,196 −3,450,888 −8,680,168 −6,081,229 Depreciation, amortization and impairment of intangible and tangible assets 7 −234,870 −155,877 −418,249 −299,271 Total operating expenses before credit −5,085,066 −3,606,765 −9,098,417 −6,380,500 losses Operating profit before credit losses, net 397,178 233,823 901,687 774,168 Credit losses, net 8 −1,336,351 −1,244,710 −2,530,814 −1,862,817 Operating profit −939,173 −1,010,887 −1,629,127 −1,088,649 Income tax 115,122 192,059 253,318 186,293 Net profit for the period −824,051 −818,828 −1,375,809 −902,356 Whereof attributable to: Shareholders of Klarna Bank AB (publ) −831,529 −826,116 −1,390,691 −916,588 Additional Tier 1 capital holders 7,478 7,288 14,882 14,232 Total −824,051 −818,828 −1,375,809 −902,356 Statement of Comprehensive Income, Group Amounts in SEKk Jul - Dec 2020 Jul - Dec 2019 Jan - Dec 2020 Jan - Dec 2019 Net profit for the period −824,051 −818,828 −1,375,809 −902,356 Items that may be reclassified subsequently to the income statement: Exchange differences, foreign operations −115,463 −23,110 −116,496 35,049 Other comprehensive income for the period, net after tax −115,463 −23,110 −116,496 35,049 Total comprehensive income for the period −939,514 −841,938 −1,492,305 −867,307 Whereof attributable to: Shareholders of Klarna Bank AB (publ) −946,992 −849,226 −1,507,187 −881,539 Additional Tier 1 capital holders 7,478 7,288 14,882 14,232 Total −939,514 −841,938 −1,492,305 −867,307 21 Klarna Bank AB (publ) - Annual Financial Statement Release 2020
Balance Sheet, Group
Amounts in SEKk                                           Note               31 Dec 2020             31 Dec 2019
Assets
Cash and balances with central banks                                          5,014,210                 107,076
Treasury bills chargeable at central banks, etc.                              5,219,426               2,510,606
Loans to credit institutions                                9                 2,614,447               1,907,129
Loans to the public                                         10              41,717,591              29,654,552
Bonds and other interest-bearing securities                                   1,609,770               1,833,567
Other shares and participations                                                   20,081                  20,081
Intangible assets                                                             2,449,280               2,145,846
Tangible assets                                                               1,003,664                 892,654
Deferred tax assets                                                             643,879                 310,666
Other assets                                                11                1,140,244                 337,071
Prepaid expenses and accrued income                                             362,662                 148,312
Total assets                                                                61,795,254              39,867,560

Liabilities
Liabilities to credit institutions                                            2,414,897               4,939,524
Deposits from the public                                    12              30,834,677              12,287,653
Debt securities in issue                                    13                4,182,723               5,582,703
Deferred tax liabilities                                                          75,998                  76,411
Other liabilities                                           14              15,797,011                9,822,329
Accrued expenses and prepaid income                                           1,423,335                 907,475
Provisions                                                                      143,530                 357,674
Subordinated liabilities                                                        599,120                 598,325
Total liabilities                                                           55,471,291              34,572,094

Equity
Share capital                                                                     52,869                  52,752
Other capital contributed                                                     7,305,180               4,805,140
Reserves                                                                        109,325                 225,821
Additional Tier 1 instruments                                                   250,000                 250,000
Retained earnings                                                               −17,602                 864,109
Net profit for the year                                                     −1,375,809                 −902,356
Total equity                                                                  6,323,963               5,295,466

Total liabilities and equity                                                61,795,254              39,867,560

22                                                 Klarna Bank AB (publ) - Annual Financial Statement Release 2020
Statement of Changes in Equity, Group

                                                                                    Additional
                                           Share Other capital                           Tier 1    Retained
    Amounts in SEKk                       capital contributed       Reserves4     instruments      earnings         Net profit     Total equity
    Balance as at                         52,752    4,805,140        225,821         250,000       864,109          −902,356        5,295,466
    January 1, 2020
    Transfer of previous year's
    net profit                                 -                -             -               - −902,356              902,356                      -
    Net profit for the year                    -                -             -               -             -    −1,375,809        −1,375,809
    Exchange differences,
    foreign operations                         -                - −116,496                    -             -                 -      −116,496
    Total comprehensive                        -                - −116,496                    -             -    −1,375,809        −1,492,305
    income for the year
    New share issue                         117                 -             -               -             -                 -              117
    Shareholders' contribution1                -    2,500,040                 -               -             -                 -     2,500,040
    Restricted stock units                     -                -             -               -     35,527                    -         35,527
                                      2
    Additional Tier 1 instruments              -                -             -               -    −14,882                    -        −14,882
    Balance as at                         52,869    7,305,180        109,325         250,000       −17,602       −1,375,809         6,323,963
    December 31, 2020

                                                                                    Additional
                                           Share Other capital                           Tier 1    Retained
    Amounts in SEKk                       capital contributed       Reserves4     instruments      earnings         Net profit     Total equity
    Balance as at                         52,752    2,805,140        190,772         250,000       738,371           105,224        4,142,259
    January 1, 2019
    Opening balance adjustment                 -                -             -               -             4                 -                    4
    Transfer of previous year's
    net profit                                 -                -             -               -    105,224          −105,224                       -
    Net profit for the year                    -                -             -               -             -       −902,356         −902,356
    Exchange differences,
    foreign operations                         -                -      35,049                 -             -                 -         35,049
    Total comprehensive                        -                -      35,049                 -             -       −902,356         −867,307
    income for the year
    Group contribution3                        -                -             -               -     44,200                    -         44,200
    Tax effect group
    contribution                               -                -             -               -     −9,458                    -         −9,458
                                  1
    Shareholders' contribution                 -    2,000,000                 -               -             -                 -     2,000,000
                                      2
    Additional Tier 1 instruments              -                -             -               -    −14,232                    -        −14,232
    Balance as at                         52,752    4,805,140        225,821         250,000       864,109          −902,356        5,295,466
    December 31, 2019

1
    Shareholders' contribution from parent company Klarna Holding AB (publ) through conversion of loans between Klarna Bank AB (publ) and
    Klarna Holding AB (publ).
2
    Amounts in Additional Tier 1 instruments column consist of issued instruments, while amounts in Retained earnings column consist of interest
    on and cost of issuance of these issued instruments.
3
    Group contribution from parent company Klarna Holding AB (publ), paid in 2020.
4
    The reserves consist of exchange differences from foreign operations.

Equity is in its entirety attributable to the shareholders of Klarna Bank AB (publ) and its additional tier 1 holders.

23                                                                            Klarna Bank AB (publ) - Annual Financial Statement Release 2020
Cash Flow Statement, Group
Amounts in SEKk Note Jul - Dec 2020 Jul - Dec 2019 Jan - Dec 2020 Jan - Dec 2019
Operating activities
Operating profit −939,173 −1,010,887 −1,629,127 −1,088,649
Taxes paid −132,995 −105,214 −150,858 −286,084
Adjustments for non-cash items in operating
activities
Depreciation, amortization and impairment 7 234,870 155,877 418,249 299,271
Gain or loss from shares in unlisted companies - - - 915
Provisions excluding credit losses 625 149,585 1,527 222,718
Provision for credit losses 394,894 590,478 631,229 651,791
Share-based payments 35,527 - 35,527 -
Financial items including unrealized exchange rate
effects −56,083 27,724 −55,370 −38,460
Changes in the assets and liabilities of operating
activities
Change in loans to the public −8,862,770 −7,593,974 −12,466,089 −9,345,613
Change in liabilities to credit institutions −298,531 4,473,261 −2,697,220 3,521,470
Change in deposits from the public 7,163,188 −2,930,047 18,562,508 −2,294,116
Change in other assets and liabilities 7,358,483 3,035,280 4,934,236 5,926,842
Cash flow from operating activities1 4,898,035 −3,207,917 7,584,612 −2,429,915
Investing activities
Investments in intangible assets −225,990 −142,319 −410,761 −234,059
Investments in tangible assets −2,859 −130,025 −63,921 −186,263
Sales of fixed assets 3,288 - 3,723 -
Investments in business combinations 20 −128,291 - −141,943 −979,077
Investments and divestments in other shares and
participations 214,057 - 142,106 20,220
Cash flow from investing activities −139,795 −272,344 −470,796 −1,379,179
Financing activities
New share issue 117 - 117 -
Group contribution received - - 44,200 -
Debt securities in issue 13 −607,582 3,579,247 −1,458,368 3,579,247
Lease liabilities −74,571 −49,592 −137,368 −104,863
Cash flow from financing activities −682,036 3,529,655 −1,551,419 3,474,384
Cash flow for the period 4,076,204 49,394 5,562,397 −334,710
Cash and cash equivalents at the beginning of the
period 3,117,984 1,579,769 1,618,008 1,917,407
Cash flow for the period 4,076,204 49,394 5,562,397 −334,710
Exchange rate diff. in cash and cash equivalents −279,722 −11,155 −265,939 35,311
Cash and cash equivalents at the end of the period 6,914,466 1,618,008 6,914,466 1,618,008
Cash and cash equivalents include the following
items
Cash and balances with central banks 5,014,210 107,076 5,014,210 107,076
Loans to credit institutions2 1,900,256 1,510,932 1,900,256 1,510,932
Cash and cash equivalents 6,914,466 1,618,008 6,914,466 1,618,008
1
Cash flow from operating activities includes interest payments received and interest expenses paid.
2
Adjusted for non-cash items such as money in transfer.
24 Klarna Bank AB (publ) - Annual Financial Statement Release 2020Notes with accounting principles.
Note 1           Corporate information

The Parent Company, Klarna Bank AB (publ), Corp. ID 556737-0431, maintains its registered office in Stockholm
at the address Sveavägen 46, 111 34 Stockholm, Sweden. The consolidated financial statements for 2020 consist
of the Parent Company (including branches in the United Kingdom and Germany) and its subsidiaries, which
together make up the Group. The G o p business is described in the Business overview.

The parent company of Klarna Bank AB (publ) is Klarna Holding AB (publ), Corp. ID 556676-2356. Klarna Holding
AB (publ) has its registered office in Stockholm at the address Sveavägen 46, 111 34 Stockholm, Sweden.

Note 2           Accounting and valuation principles

Basis for the preparation of the reports
This interim report has been prepared in accordance with IAS 34, Interim Financial Reporting. The financial
statements for both the Group and the Parent Company have also been prepared in accordance with the
applicable regulations in the Annual Accounts Act for Credit Institutions and Securities Companies (ÅRKL,
1995:1559), the Swedish Financial Supervisory Authority regulations (FFFS 2008:25) and the Swedish Financial
Repo ing Boa d ecommenda ion RFR S pplemen a Acco n ing R le fo G o p and RFR 2 Accounting
for Legal Entities).

The accounting principles and calculation methods applied in this report are identical to those applied in the
Annual Report for 2019 except for the changes stated below.

Changed accounting principles
IASB has amended IFRS 3 Business Combinations to distinguish further if a purchase constitutes a business
combination or the purchase of a group of assets. This amendment has not had any significant impact on the
group's financial statements.

No other significant new standards (IFRS) or interpretations have come into effect during the period.
New and changed standards and interpretations which have not yet come into effect and which have not been
applied in advance by the Group:
     1)      IFRS 17 Insurance contracts
     2)      Amendments to IAS 16 Property, Plant and Equipment for proceeds before intended use
     3)      Amendments to IAS 37 for the Costs of fulfilling a contract related to onerous contracts
     4)      Interest rate benchmark reform phase 2 (Amendments to IFRS 9, IAS 39, IFRS 7, IFRS 4 and IFRS 16)
     5)      Amendments to references to the conceptual framework in IFRS standards
     6)      Amendments to IAS 1 in the classification of liabilities as current or non-current

None of the changes in IFRS or IFRIC interpretations that have not yet come into effect are expected to have a
significant impact on the Group.

Changed presentation of Commission expenses for the Parent Company
The presentation of income and expenses has changed in the income statement for the Parent Company. In
2020, the Parent Company presents certain fees, which were previously reported as general administrative
expenses within commission expenses, in order to provide more relevant information about the effects of
transaction related expenses. The change has been applied for comparable figures to better illustrate the
comparative trends between periods. The outcome is that the comparable figures for commission expenses
have increased by SEK 545m in 2019 to SEK 999m and general administrative expenses have decreased by the
same amount to SEK 5,017m.

The presentation is consistent with the Swedish Financial Supervisory Authority regulations (FFFS 2008:25) and
the Annual Accounts Act for Credit Institutions and Securities Companies (ÅRKL, 1995:1559).

26                                                           Klarna Bank AB (publ) - Annual Financial Statement Release 2020
Note 3 Operating segments and income by geographical area
The segment information is presented based on the perspective of the Chief Operating Decision Maker (CODM),
and the IFRS measurement principles and allocation between operating segments follow the information
reported to the Chief Executive Officer, who is identified as the CODM.
Financial information is presented for the two main operating segments, based on regions; Nordics (Sweden,
Norway, Finland and Denmark) and DACH (Germany, Austria and Switzerland). The remainder of operating
segments falls below the quantitative threshold in IFRS 8 and are included in O he operating segments. Items
not fully allocated to any of the operating segments are shown separately as reconciling items.
Kla na main geographical markets are Sweden and Germany. The remainder of the geographical markets falls
below the quantitative threshold in IFRS 8 and are included in O he geographical markets. Revenues are
distributed to geographical areas based on either the location of the end-consumer or the location of the
e aile operations.
Jul - Dec 2020
Operating segments Nordics DACH Other1 Total
Revenue 2,216,220 2,227,059 1,566,549 6,009,828
Gross profit 1,649,169 1,544,542 225,030 3,418,741
Geographical breakdown Sweden Germany Other2 Total
Revenue 1,388,951 1,965,500 2,655,377 6,009,828
Non-current assets 1,327,845 1,981,799 143,300 3,452,944
Jul - Dec 20193
Operating segments Nordics DACH Other1 Total
Revenue 2,036,793 1,585,624 736,655 4,359,072
Gross profit 1,550,759 1,071,514 −227,917 2,394,356
Geographical breakdown Sweden Germany Other2 Total
Revenue 1,243,285 1,409,451 1,706,336 4,359,072
Non-current assets 984,006 2,023,210 31,284 3,038,500
Jan - Dec 2020
Operating segments Nordics DACH Other1 Total
Revenue 4,319,442 4,044,273 2,666,508 11,030,223
Gross profit 3,192,489 2,848,676 311,849 6,353,014
Geographical breakdown Sweden Germany Other2 Total
Revenue 2,695,804 3,555,613 4,778,806 11,030,223
Non-current assets 1,327,845 1,981,799 143,300 3,452,944
Jan - Dec 20193
Operating segments Nordics DACH Other1 Total
Revenue 3,939,278 2,930,172 1,190,564 8,060,014
Gross profit 2,962,691 2,032,184 −138,774 4,856,101
Geographical breakdown Sweden Germany Other2 Total
Revenue 2,390,774 2,606,568 3,062,672 8,060,014
Non-current assets 984,006 2,023,210 31,284 3,038,500
1
"Other" mainly includes the countries Belgium, the Netherlands, the United Kingdom and the United States.
2
"Other" mainly includes the countries Austria, Belgium, Denmark, Finland, the Netherlands, Norway, Switzerland, the United Kingdom and the
United States.
3
Revenue and gross profit figures for 2019 have been updated due to changes in the internal financial reporting.
27 Klarna Bank AB (publ) - Annual Financial Statement Release 2020Certain revenues and costs are not allocated to the segments as they are managed on an overall group basis.
The reconciliation between reportable segments to the G o p income statement is as follows:
Reconciliation between total operating segments
and income statement Jul - Dec 2020 Jul - Dec 20191 Jan - Dec 2020 Jan - Dec 20191
Revenue
Revenue - total operating segments 6,009,828 4,359,072 11,030,223 8,060,014
Interest income from central activities 40,307 13,506 86,079 15,317
Interest expenses −323,078 −210,870 −601,096 −368,203
Other commissions −363,423 −275,744 −607,242 −476,023
Net result from financial transactions 118,610 −45,376 92,140 −76,437
Total net operating income 5,482,244 3,840,588 10,000,104 7,154,668
Reconciliation between total operating segments
and income statement Jul - Dec 2020 Jul - Dec 20191 Jan - Dec 2020 Jan - Dec 20191
Gross profit
Gross profit - total operating segments 3,418,741 2,394,356 6,353,014 4,856,101
Other general administrative expenses −3,838,938 −2,879,595 −6,932,726 −5,083,715
Depreciation, amortization and impairment of
intangible and tangible assets −234,870 −155,877 −418,249 −299,271
Other interest expenses −67,085 −43,954 −112,630 −54,454
Other commissions −363,423 −275,744 −607,242 −476,023
Other result from financial transactions 192,069 −6,293 204,145 −6,329
Other credit losses −45,667 −43,780 −115,439 −24,958
Operating profit −939,173 −1,010,887 −1,629,127 −1,088,649
1
Figures for 2019 have been updated due to changes in the internal financial reporting.
Note 4 Interest income calculated according to the effective interest rate
method
Jul - Dec 2020 Jul - Dec 2019 Jan - Dec 2020 Jan - Dec 2019
Loans to credit institutions 1,261 1,090 3,689 1,728
Loans to the public 1,632,966 1,475,182 3,178,668 2,779,450
Other interest income 39,047 12,415 82,390 13,591
Total 1,673,274 1,488,687 3,264,747 2,794,769
28 Klarna Bank AB (publ) - Annual Financial Statement Release 2020Note 5 Interest expenses
Jul - Dec 2020 Jul - Dec 2019 Jan - Dec 2020 Jan - Dec 2019
Interest-bearing securities and chargeable treasury
bills etc. −56,170 −38,476 −94,142 −43,060
Liabilities to credit institutions −25,363 −24,067 −46,906 −44,183
Deposits from the public −149,807 −83,002 −263,496 −169,785
Debt securities in issue −23,416 −18,143 −58,072 −31,801
Subordinated liabilities −12,590 −12,382 −25,761 −24,514
Group companies −57,150 −32,891 −95,881 −38,793
Other interest expenses 1,418 −1,909 −16,838 −16,067
Total −323,078 −210,870 −601,096 −368,203
All interest expenses are calculated using the effective interest rate method.
Note 6 Commission income
Revenues from contracts with customers divided by segments under IFRS 15:
Jul - Dec 2020 Nordics DACH Other1 Total
Commission income 1,148,864 1,781,995 1,320,025 4,250,884
Jul - Dec 2019 Nordics DACH Other1 Total
Commission income 995,193 1,263,751 584,900 2,843,844
Jan - Dec 2020 Nordics DACH Other1 Total
Commission income 2,210,677 3,224,043 2,237,853 7,672,573
Jan - Dec 2019 Nordics DACH Other1 Total
Commission income 1,923,610 2,364,231 944,340 5,232,181
1
Other" mainly includes the countries Belgium, the Netherlands, the United Kingdom and the United States.
Commission income split by product category Jul - Dec 2020 Jul - Dec 2019 Jan - Dec 2020 Jan - Dec 2019
Retailer 3,353,150 2,024,974 5,855,032 3,612,383
Consumer 897,734 818,870 1,817,541 1,619,798
Total 4,250,884 2,843,844 7,672,573 5,232,181
All commission income arises from financial instruments measured at amortized cost.
29 Klarna Bank AB (publ) - Annual Financial Statement Release 2020Note 7 Depreciation, amortization and impairment of intangible and tangible
assets
Jul - Dec 2020 Jul - Dec 2019 Jan - Dec 2020 Jan - Dec 2019
Amortization and depreciation
Intangible assets −107,780 −80,613 −194,294 −151,801
1
Tangible assets −109,727 −75,264 −206,592 −147,319
Total −217,507 −155,877 −400,886 −299,120
Impairment
Intangible assets −17,363 - −17,363 −151
Total −17,363 - −17,363 −151
Total depreciation, amortization and impairment of
intangible and tangible assets −234,870 −155,877 −418,249 −299,271
1
Depreciation of leased assets is included in tangible assets. During 2020, the depreciation of leased assets amounted to SEK 147m (117) in the
Group.
Note 8 Credit losses, net
Loan losses divided by class Jul - Dec 2020 Jul - Dec 2019 Jan - Dec 2020 Jan - Dec 2019
Loans to credit institutions
Increase in provisions −2,111 −619 −2,180 −672
Reversal of previous provisions 1,334 579 1,432 613
Total −777 −40 −748 −59
Loans to the public
Realized loan losses −1,322,363 −1,003,928 −2,690,074 −1,858,103
Allowances to cover realized loan losses 540,184 332,086 1,510,473 765,695
Recoveries on previous realized loan losses 361,559 335,660 771,143 647,077
Increase in provisions −3,780,508 −2,786,324 −6,282,384 −4,193,284
Reversal of previous provisions 2,858,913 1,896,429 4,200,342 2,759,393
Total −1,342,215 −1,226,077 −2,490,500 −1,879,222
Financial guarantees and commitments
Increase in provisions −58,749 −61,793 −106,906 −104,630
Reversal of previous provisions 65,390 43,200 67,340 121,094
Total 6,641 −18,593 −39,566 16,464
Total credit losses, net −1,336,351 −1,244,710 −2,530,814 −1,862,817
30 Klarna Bank AB (publ) - Annual Financial Statement Release 2020Note 9 Loans to credit institutions
31 Dec 2020 31 Dec 2019
Loans to credit institutions 2,614,447 1,907,129
By currency
- in SEK 532,018 174,927
- in EUR 1,136,350 1,001,128
- in USD 281,553 286,401
- in AUD 279,836 97,454
- in GBP 59,379 80,399
- in other currencies 325,311 266,820
Total 2,614,447 1,907,129
All loans to credit institutions are payable on demand. For the fair value amounts, see note 16.
The loss allowance for loans to credit institutions at the end of the reporting period amounts to SEK 843k (97) for
the Group and is allocated to impairment stage 1. The Group has no purchased or originated credit-impaired
assets (POCI) related to credit institutions.
Note 10 Loans to the public
31 Dec 2020 31 Dec 2019
Loans to the public 43,733,235 31,300,571
Allowance for credit losses −2,015,644 −1,646,019
Total 41,717,591 29,654,552
For the fair value amounts, see note 16.
Note 11 Other assets
31 Dec 2020 31 Dec 2019
Current tax assets 189,543 138,973
VAT receivables 21,632 38,703
Derivatives 341,203 84,327
Cost to obtain a contract 522,698 50,589
Other receivables 65,168 24,479
Total 1,140,244 337,071
For the fair value amounts, see note 16.
31 Klarna Bank AB (publ) - Annual Financial Statement Release 2020Note 12 Deposits from the public
31 Dec 2020 31 Dec 2019
Private individuals 30,240,723 11,420,928
Companies 593,954 866,725
Total 30,834,677 12,287,653
By currency
- in SEK 6,322,367 2,119,141
- in EUR 24,140,360 9,968,505
- in other currencies 371,950 200,007
Total 30,834,677 12,287,653
For the fair value amounts, see note 16.
Note 13 Debt securities in issue
31 Dec 2020 31 Dec 2019
Senior unsecured bonds 2,301,006 3,450,758
Commercial papers 1,696,206 2,083,509
Other bonds 185,511 48,436
Total 4,182,723 5,582,703
In January 2020, Klarna Bank AB (publ) issued a second tranche of an existing loan of SEK 400m under the
Medium Term Notes program. The notes have a final maturity in June 2021 and pay interest on a quarterly basis.
The loan was listed on Nasdaq Stockholm in December 2019.
In February 2020, Klarna Bank AB (publ) issued a second tranche of an existing loan of SEK 300m under the
Medium Term Notes program. The notes have a final maturity in August 2022 and pay interest on a quarterly
basis. The loan was listed on Nasdaq Stockholm in November 2019.
For the fair value amounts, see note 16.
32 Klarna Bank AB (publ) - Annual Financial Statement Release 2020Note 14 Other liabilities
31 Dec 2020 31 Dec 2019
Accounts payable 237,993 152,534
Personnel related taxes 106,057 62,129
Liabilities to group companies 7,987,182 4,340,522
Current tax liabilities 77,432 69,142
Liabilities to retailers 5,650,051 4,325,140
Derivatives 418,336 59,869
Lease liabilities 763,141 641,884
Other liabilities 556,819 171,109
Total 15,797,011 9,822,329
Klarna Bank AB (publ) has received a line of credit from its parent company Klarna Holding AB (publ). The credit
liability amounted to SEK 7,842,976k (4,126,636) as of December 31, 2020 and is included in Liabilities to group
companies. The line of credit is ranked pari passu with all other unsecured indebtedness.
For the fair value amounts, see note 16.
Note 15 Pledged assets and contingent liabilities
31 Dec 2020 31 Dec 2019
Pledged assets
Assets pledged for own liabilities
Pledged loans and receivables 9,248,248 8,358,790
Pledged treasury bills chargeable at central banks, etc., and pledged bonds and
other interest-bearing securities 1,714,570 2,313,711
Other pledged assets 25,812 9,859
Total 10,988,630 10,682,360
Contingent liabilities and commitments
Contingent liabilities
Guarantees 40,327 483,315
Commitments 16,396,546 10,136,918
Total 16,436,873 10,620,233
Parts of the Swedish receivables are continuously pledged as collateral for liabilities to credit institutions which
provides security for the Group's credit facility. The credit liability amounted to SEK 0k (2,157,060) as at
December 31, 2020.
Treasury bills chargeable at central banks, etc., and bonds and other interest-bearing securities pledged for own
liabilities contain securities pledged as collateral in repurchase agreements. Associated liabilities amounted to
SEK 1,714,572k (2,298,059) as at December 31, 2020.
Commitments contain undrawn part of irrevocable consumer credit line amounted to SEK 10,780,554k
(6,383,300) and commitment to refund consumers in case of returns to a defaulted retailer amounted to SEK
5,615,992k (3,753,618) as at December 31, 2020.
33 Klarna Bank AB (publ) - Annual Financial Statement Release 2020You can also read