State Infrastructure Program as a Countercyclical Tool - By Yonghong Wu April 2021
←
→
Page content transcription
If your browser does not render page correctly, please read the page content below
April 2021

State Infrastructure
Program as a
Countercyclical Tool
By Yonghong Wu
Government Finance Research Center                                                  2

                         Acknowledgment
               Financial support from the Joyce Foundation is gratefully
         acknowledged. Katherine Barrett and Richard Greene provided helpful
          synthesis of this work. Special thanks to Farhad Kaab-Omeyr in the
         Department of Public Administration at University of Illinois at Chicago
                                for his research support.

                    Yonghong Wu is a Professor and Director of International
                         Programs in the Department of Public Administration
                       at University of Illinois at Chicago and a member of the
                 Government Finance Research Center Faculty Advisory Panel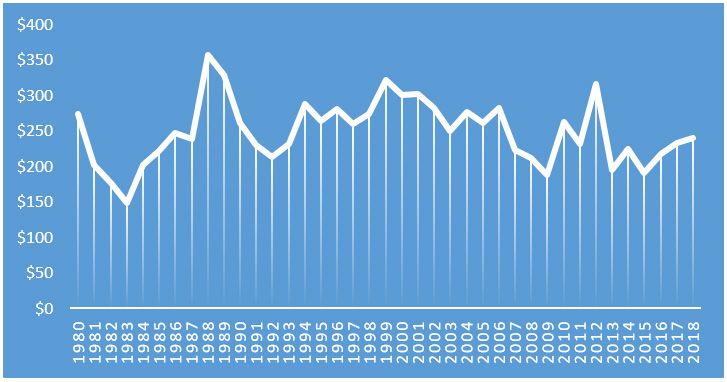
Table of Contents
Introduction											4
Should States Play an Economic Stabilization Function?				                     4

   Conventional Wisdom and Critique							5
   Empirical Evidence about Benefit Spillovers						          5
   Budget Stabilization vs. Economic Stabilization 					      6
   Should States Play an Economic Stabilization Function?				 7
Government Investment in Public Infrastructure					                            7

   Infrastructure Investment as a Countercyclical Fiscal Policy			             7
   Short-run and Long-run Impact of Public Infrastructure Investment		         8
   Investment in Infrastructure in the United States					                      8
   Trend of Annual State Capital Spending						                                9
How Do States Finance Infrastructure Projects?					                            10

   Infrastructure Spending through Debt							                                 10
   Infrastructure Spending from Current Revenues					                          11
   Infrastructure Funding through Public-Private Partnership				               11
   State Infrastructure Investment Fund as Countercyclical Tool			             12
Barriers and Pathways for State Countercyclical Investment in Infrastructure   13
Findings and Recommendations								15
References											17
Appendix A: Direct General Capital Outlays per Capita for Six States		         19
Appendix B: Individual State Balanced Budget Requirements and Debt Limits      23
Government Finance Research Center                                                                            4

Introduction
The COVID-19 pandemic has created and will               the extraordinary situation still calls for state
continue to create unprecedented challenges              governments to play a more important role
to regional economic growth and government               in stabilizing regional economies. Although
fiscal landscape. The states’ stay-at-home               state governments do not possess monetary
orders shut down a significant portion of                policy instruments, they do have fiscal policy
economic activities, leading to precipitous              authority under state constitutions with regard
drops in employment across the country. The              to investing in public infrastructure. The
number of active employees dropped by about              unprecedented challenges require creative
35 and 25 percent in Michigan and Ohio in the            ideas beyond conventional or mainstream
middle of April 2020.1 Although employment               thinking about what states can do to promote
numbers rebounded after the end of stay-at-              growth and development.
home orders, unemployment rates stayed
high through December 2020 in some of the                This paper will explore if and how state
states: 4.3 percent in Indiana, 4.4 percent in           governments can create a capital spending
Minnesota, 5.5 percent in Ohio, 5.5 percent in           program as a deliberate countercyclical
Wisconsin, 7.5 percent in Michigan, and 7.6              strategy to mitigate the devastating effects of
percent in Illinois.2                                    an economic downturn. After a review of the
                                                         classic theory of public finance with a focus
Although substantial budget gaps are                     on the appropriate economic role for state
anticipated during and shortly after the                 governments in a federal system, the paper
pandemic, governments at all levels are                  focuses on a particular fiscal policy – investing
expected to play a stabilizing role during               in public infrastructure. After a discussion of
this downturn. According to orthodox                     public infrastructure investment in the U.S.
macroeconomic theory, the federal                        and the trend of annual state capital spending,
government has the primary responsibility                the paper explores various ways of financing
for stabilizing macroeconomic conditions                 state infrastructure projects. The last two
using its unique fiscal and monetary                     sections examine institutional barriers to the
policy instruments. While the new Biden                  creative implementation of state infrastructure
Administration and Democrats’ control of both            programs, and conclude with a summary
the Senate and House raise the hope of more              of key findings and discussion of major
and stronger federal stimulus assistance,                recommendations.

Should States Play an Economic Stabilization Function?
Richard Musgrave (1959) identified three                 allocation of resources. It is widely accepted
traditional economic functions for government:           that the cycles of aggregate economic activity
(1) stabilizing macroeconomic conditions,                require government intervention into the
(2) maintaining socially preferred distribution          private marketplace to maintain employment
of resources, and (3) achieving efficient                and price stability, particularly to mitigate

1 The employment data are from the Opportunity Insights Economic Tracker project. Accessed November 1, 2020
https://www.tracktherecovery.org/
2 The data of unemployment rates are from U.S Bureau of Labor Statistics. Accessed January 28, 2021 https://www.
bls.gov/web/laus/laumstrk.htm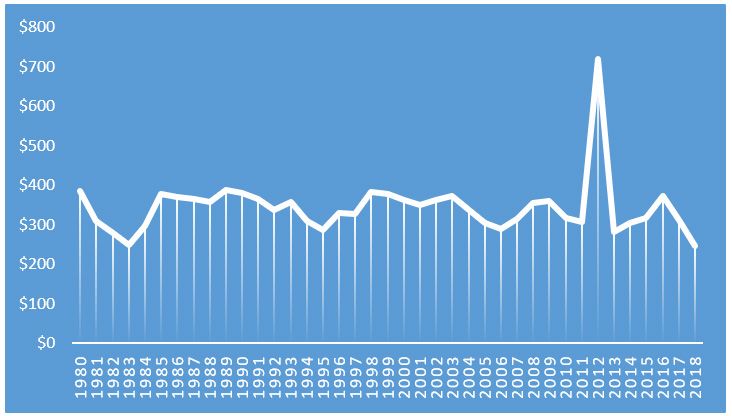
Government Finance Research Center                                                                  5

the depth of economic downturns. However,            study finds that the long-run multiplier is 4.5
it has become somewhat controversial                 for total public investment spending, and
regarding what level of government should            about 2.0 for public investment in highways
be responsible for the economic stabilization        and streets (Pereira, 2000). In a latter study,
function in a federal governance system. This        Perotti (2004) reports a short-run multiplier of
section provides a theoretical discussion about      about 1.5, and a long-run multiplier of only 0.4.
whether state governments should play a              The small long-run multiplier is primarily due
significant role in stabilizing state and regional   to substantial crowd-out effects of government
economies during recessionary periods.               spending on private investment.

Conventional Wisdom and                              Some scholars argue that state fiscal policies
Critique                                             may be more effective than what is believed
As the founding authors of the “theory of            in conventional wisdom, and contend that
fiscal federalism”, Musgrave (1959) and              changes in the economy may even make
Oates (1972) argued that the stabilization           state countercyclical fiscal policies necessary.
function should be assigned to the federal           Gramlich (1987) is the first economist in
or central government. State and local               modern history to make such an argument.
governments should not even attempt to               He argues that state and local governments
conduct discretionary countercyclical fiscal         should conduct countercyclical fiscal policy
policy (Oates, 1972). This conventional              by raising taxes or cutting spending in booms
wisdom was derived directly from economic            and lowering taxes or raising spending in
efficiency criterion. Because state economies        recessions. Given the balanced budget
are relatively small and economically open,          requirement at state and local levels, this
any state fiscal stimulus policy inevitably          countercyclical strategy requires fiscal asset
creates substantial benefit spillovers to other      accumulation during expansionary periods
states so that states may be reluctant to adopt      and fiscal asset decumulation in recessionary
their own fiscal policies. Therefore, Musgrave       times.
and Oates conclude that only the federal
                                                     Gramlich (1997) furthermore notes that
government can efficiently manage simulative
                                                     states, particularly large states, may be able
fiscal policies during economic recessions.
                                                     to internalize a large share of the benefits of
Another often-cited justification is that federal
                                                     stimulating their economies when there are
or central government can effectively stabilize
                                                     underutilized resources. However, another
macroeconomic conditions using fiscal and
                                                     economist from University of Michigan, James
monetary policy tools. State governments do
                                                     Hines, Jr., could not find supporting evidence.
not have monetary authority, and their access
                                                     Hines (2010) reports that larger states do
to fiscal policy instruments is also limited
                                                     not have spending and tax policies that more
because of the balanced budget requirement
                                                     closely resemble federal countercyclical
(BBR).
                                                     polices, whereas smaller states’ expenditure
Federal fiscal spending is generally an              and revenue appear to more closely behave in
effective buffer to steep declines in the market     a countercyclical fashion.
economy. Measured by the dollar change in
economic output caused by a $1 additional            Empirical Evidence about Benefit
fiscal spending, the multiplier is generally over    Spillovers
1 or even substantially exceeding 1 in some          There has been limited empirical evidence
empirical studies. For example, according to a       regarding benefit spillovers of state stimulus
Moody’s report, the multiplier of infrastructure     policies. Carlino and Inman (2013) conduct an
spending is 1.57, meaning that a $1 additional       empirical test and find evidence of significant
federal spending on infrastructure led to $1.57      fiscal spillovers. They examine how the
increase in GDP (Zandi, 2009). One important         annual growth of jobs and population in a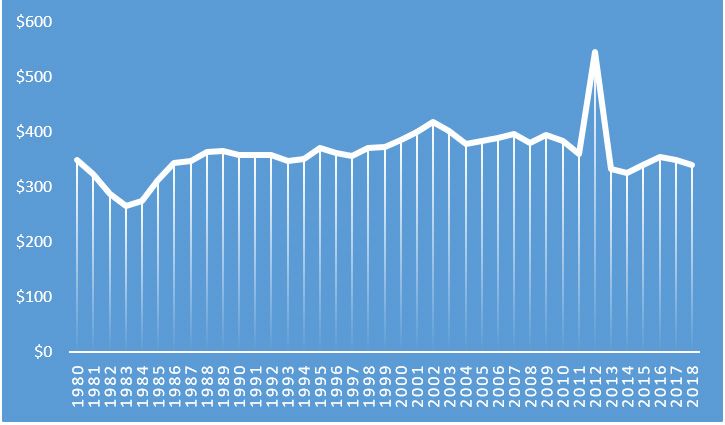
Government Finance Research Center                                                                                 6

state are affected by its own deficit across               stabilization, and at the subnational-level
all state funds, which is equal to aggregate               budget stabilization (Hou, 2013). Some
state own expenditures minus aggregate                     studies have shown that state governments
state own revenues.3 4 To measure interstate               have used countercyclical fiscal policies to
fiscal spillovers, the states are divided into             stabilize their budgets and service provisions
eight economic clusters according to their                 during downturns (Sobel & Holcombe, 1996;
common business cycle patterns. The Great                  Wagner, 2003; Hou, 2003; Knight & Levinson,
Lakes cluster includes Indiana, Illinois,                  1999). Although tax revenue reductions during
Michigan, Minnesota, Ohio, Wisconsin, and                  recessionary times generally discourage
West Virginia. Their results show that a state             government spending no matter whether the
deficit can create new jobs within the state               balanced budget requirements are present
and other states in the region. For example,               or not, states rely on budget stabilization
in the Great Lakes cluster, Illinois’ deficit may          funds and general fund surpluses as their
create 63,294 jobs in Illinois and 43,356 jobs             countercyclical policy tools for budget
in the other states in the cluster, with the total         stabilization. According to the National
job creation of 106,650 within the region. In              Association of State Budget Officers (NASBO),
other words, about 40 percent of new jobs                  nearly all states had some form of stabilization
are created in other states by Illinois’ fiscal            or rainy day fund as of fiscal year 2014
stimulus policy. The spillovers run in both                (NASBO, 2015).
directions. If all other states in the region adopt
similar fiscal policies, about 38,907 additional           If well designed and implemented, budget
jobs will be created in Illinois. This provides            stabilization funds could function properly
clear evidence of fiscal spillovers across                 as a countercyclical fiscal device for state
states.                                                    governments to bolster spending in lean
                                                           years. Empirical analyses have shown that
An important finding from Carlino and Inman                states with a budget stabilization fund (BSF)
(2013) is that a deficit policy that may not               tend to save more than those without a
be attractive for any one state may become                 BSF (Sobel & Holcombe, 1996), and they
attractive when all states agree to cooperate              can better stabilize their outlays during
and collectively adopt similar fiscal stimulus             recessionary periods than those without the
policies. For example, in the Great Lakes                  fund (Douglas & Gaddie, 2002). Hou (2003)
cluster, the own deficit cost to Illinois would be         finds that budget stabilization funds are a
$78,851 per job. But cooperating so that all               countercyclical tool to stabilize state general
seven states provide similar stimulus reduces              fund expenditures, especially to minimize the
the deficit cost per job to $47,121. Therefore,            negative gap in general fund expenditures.
stabilization fiscal policy works more efficiently         However, unreserved fund balances do not
at the regional or even national level than at             exert a countercyclical effect on state general
the state level.                                           fund expenditures during downturn years. This
                                                           suggests that budget stabilization funds have
Budget Stabilization vs. Economic                          become the primary countercyclical tool at the
Stabilization                                              state level.
Some scholars distinguish economic
stabilization from budget stabilization, and               The distinction between economic stabilization
tend to believe that the function at the                   and budget stabilization makes sense
federal or national level is macroeconomic                 because they aim to achieve different policy
                                                           objectives: The former targets on economic

3 State own expenditures include spending for current goods and services plus aid to local governments, capital
spending for infrastructures, state pension benefit spending, and state spending for unemployment insurance and
workmen’s compensation (Carlino and Inman, 2013).
4 State own revenues include state taxes and fees, state and local employee contributions into the state pension
plan, and employee and employer contributions into the unemployment and workmen’s compensation trust funds
(Carlino and Inman, 2013).
Government Finance Research Center 7
recovery, while the latter focuses on budget issuance for capital investment to enhance
stabilization. They are also interrelated, as their countercyclical fiscal capacity.
state countercyclical spending helps stabilize
employment in both public and private sectors. In summary, the classic theory of public
The key bottleneck is that budget stabilization finance does not support subnational efforts
efforts may have limited macroeconomic to stabilize economic conditions due to the
impact because of the relatively modest size of presence of substantial economic spillovers
state budget stabilization funds.5 and a lack of policy instrument and fiscal
capacity. However, those limits do not
Should States Play an Economic preclude states from playing an economic
Stabilization Function? stabilization function. The economic spillovers
The review of theoretical and empirical can be significantly reduced if all states or
evidence does not preclude states from states within a particular region take similar
conducting discretionary economic stimulus actions, and when there are a
stabilization policy. The benefit spillovers can large unemployed workforce. The lack of
be reduced by targeting fiscal stimulus to fiscal capacity cannot be addressed through
business and workers within the state, and innovative financing arrangements. State
can be further mitigated if all states in a region level stimulus efforts are necessary if political
cooperate in their stabilization efforts. The impasse prevents federal government
lack of fiscal capacity is a major constraint at from taking immediate and effective fiscal
the state level because of limited resources measures. Another advantage of state
in state budget stabilization funds. Given that countercyclical fiscal policy is that states are
balanced budget requirements only apply to generally more responsive to local needs and
operating budgets, state governments can their stimulus programs can be tailored to local
use other sources of funding such as debt economic situations.
Government Investment in Public Infrastructure
Unlike other fiscal policies such as expanding Infrastructure Investment as a
government purchases, the construction and Countercyclical Fiscal Policy
improvement of public infrastructure provides High-quality public infrastructure is the
an opportunity for state fiscal policy to be bedrock of a thriving community. A healthy
effective. The economic values created by public capital infrastructure is critical to
well-implemented government infrastructure economic activities and outcomes. Krol (2020)
investment are likely to be contained within elaborates several ways in which infrastructure
the state jurisdiction. As an investment in investment can improve long-term economic
productive capacity, investment in public outcomes. For example, highways increase
infrastructure will likely generate long-term the mobility of workers and help businesses
economic growth in the state as it provides the deliver their products/services to customers
support for private economic activity. States and clients. Clean water and environment
have taken their economic development (as the result of a high-quality and functional
responsibilities seriously by making sewer system) can have a positive impact on
investments in major infrastructure projects population health, reduce disease, lower infant
such as railroads, canals, water, sewer, ports mortality rates, and increase life expectancy.
and roads.
Because it is perceived as being more
5 The average size of BSF as a ratio of state general fund expenditure was about 2% in 1980 and 1990, and rose to
about 5% in 2000 and about 4.5% in 2007 (Wang, Zhan, & Hou, 2016).Government Finance Research Center 8
effective than other types of spending, investment in the United States. Leduc and
infrastructure investment has often been Wilson provide empirical estimates of the
considered as a critical countercyclical fiscal short-run economic impact of transportation
policy tool for economic growth as well as spending during economic downturns. They
during economic downturns (Haider, Crowley, report that highway spending between 1993
& DiFrancesco, 2013; Ludec & Wilson, 2014). and 2010 positively affects GDP but not
Germaschewski (2020) points out that public employment in the short-run. The lack of
infrastructure spending tends to “enhance effect on employment is likely due to long
the productivity of the private sector and is delays between increases in infrastructure
thus likely to promote economic prosperity funding and actual spending, meaning that
in normal times, while often offsetting falling infrastructure spending is not capable of
private demand and stimulating the economy providing any meaningful short-term benefits
during recessions” (p. 322). (Ludec & Wilson, 2013, 2014). It may take a
substantial amount of time for an infrastructure
Many see infrastructure investment as an project to get planned, processed, and
effective form of fiscal policy that can boost approved. Even more, an infrastructure
the economy and provide tangible benefits project may get entangled in legal challenges
(e.g., employment of skilled and unskilled associated with the environmental impact or
construction workers) in the long run as well neighborhood displacement effects that delay
as in shorter time periods (Haughwout, 2019). significant projects, thereby delaying capital
One of the main benefits of infrastructure outlays (Krol, 2020).
investment is job creation potential. Although
all forms of spending will produce jobs, A review of the literature in this area shows
infrastructure investment is considered to that, overall, the infrastructure investment’s
be a highly effective engine of job creation. impact on the economy is positive in the short-
According to one study, infrastructure run, but the magnitude of its impact on the
spending in the United States would create economy varies across various regions and
18,000 total jobs for every $1 billion in new can depend on economic conditions and type
infrastructure spending, which would be of infrastructures (Haider et al., 2013). Ramey
22 percent more jobs created by a rise in (2020) confirms the earlier findings that delays
household spending levels generated by a tax in implementation that are inherent in any
cut (Heintz, Pollin, & Garrett-Peltier 2009). infrastructure project can reduce the short-
term impacts of such projects. The author also
Short-run and Long-run Impact of finds that long-term effects of infrastructure
Public Infrastructure Investment projects tend to be sizeable as the long-run
There is a near consensus in the literature benefits are not affected by the implementation
about the positive long-run effects of public delays of projects.
infrastructure investment. A meta-analysis
conducted by the World Bank shows many Investment in Infrastructure in the
more positive results than negative results United States
related to the impacts of infrastructure In the United States, programs such as the
stock and quality on long-run aggregate Public Works Administration (PWA) and
economic growth (Straub, 2008). Leduc Works Progress Administration (WPA) under
and Wilson (2014) also suggest that studies President Franklin Roosevelt were key
of transportation infrastructure spending elements of the overall countercyclical fiscal
tend to find substantial impacts on real investment that federal government adopted
GDP, employment, population flows, and during the Great Depression of 1929. Similarly,
interregional trade. capital and infrastructure investment programs
were a major part of the American Recovery
There has been limited evidence regarding and Reinvestment Act (ARRA) of 2009 – a
the short-run impact of public infrastructureGovernment Finance Research Center 9
massive fiscal policy adopted by the federal Trend of Annual State Capital
government in order to help stimulate the Spending
economy after the Great Recession of 2008. This section also examines the pattern and
trend of annual state capital spending with
State governments have taken their
a focus on its countercyclical role through
economic development responsibilities
recessionary periods since 1980. Table 1
seriously by making investments in major
presents all state direct general capital outlays
infrastructure projects such as canals and
per capita. The data are collected from U.S.
railways. According to Goodrich (1960),
Census Bureau’s Annual Survey of State and
public funds financed about 70 percent of
Local Government Finances. According to
canal construction and between 25 and 30
the U.S. Census Bureau, government capital
percent of railway construction during the
outlay is defined as “Direct expenditure
first half of the nineteenth century, and the
for purchase or construction, by contract
investments were primarily made by states
or government employee, construction
while the federal government commitment
of buildings and other improvements; for
was much smaller. Despite critiques on
purchase of land, equipment, and existing
public infrastructure investment, Goodrich
structures; and for payments on capital leases”
(1960) believes that public investment in the
(U.S. Census Bureau, 2006). The annual
construction of canals and railroads promoted
capital outlays are converted to real 2012
economic development in nineteenth-century
dollars using the Bureau of Economic Analysis
America.
price index for state and local government
State and local governments own and manage consumption expenditure and gross
the majority of the investment divided by state population.
nondefense public Figure 1: Six state government direct general capital
capital stock in the
United States. In
2018, for instance,
out of a total of
$522 billion in total
nondefense capital
spending, about
three-quarters was
invested by state and
local governments
(Haughwout, 2019).
Furthermore, out of a
total of $107 billion in
2016 highway capital
investment, state and
local governments
spent $78 billion
and $28 billion,
respectively, while
the federal government’s direct expenditure
The data show a clear spike of all state capital
was a mere $500 million (Haughwout, 2019).
outlays in 2012, a 51 percent increase from
It should be noted that a large segment of
2011. This one-time big increase is attributable
the state and local highway investment is
to the massive investment from the ARRA of
transferred from the federal government.
2009. During the Great Recession (DecemberGovernment Finance Research Center 10
2007–June 2009), all state capital outlays per per capita in 2001. The state capital outlays
capita dropped by 4.1 percent in 2008 and per capita dropped by 3.6 percent in 2001
increased by 3.7 percent in 2009. For the 2001 but increased by 3.6 percent in 2002 for
recession (March–November 2001), all state Minnesota. During the early 1990s recession
capital outlays per capita increased by 3.8 and (July 1990–March 1991), the state capital
4.7 percent in 2001 and 2002, respectively. outlays per capita declined in 1990 for all
During another recession from July 1990 to the states, but increased in 1991 for Illinois,
March 1991, all state capital outlays per capita Indiana, Ohio, and Wisconsin.
dropped by 2.0 percent in 1990, and increased
by 0.2 percent in 1991. The data do not show a clear countercyclical
pattern in state capital spending for the six
Figures 2-7 in the Appendix A show the Upper Midwest states during the three recent
trends of state direct general capital outlays recessions. The state capital outlays not
per capita for Illinois, Indiana, Michigan, only fluctuated during and shortly after the
Minnesota, Ohio, and Wisconsin. Similar to economic recessions. Moreover, there exist
the all-state data, there was a clear spike of substantial delays in state capital outlays,
state capital outlays per capita in 2012 in five especially during the Great Recession,
of the six states, with a range of increase from when federal government made enormous
22.5 percent in Indiana to 134.5 percent in investment in public infrastructure projects
Minnesota. Other increases during and shortly (Leeper, Walker & Yang, 2010; Ludec &
after the Great Recession occurred in both Wilson, 2013, 2014; Ramey, 2020). Although
2009 and 2010 for Illinois, in both 2008 and the ARRA funds were intended to support
2009 for Indiana and Minnesota, and in 2010 “shovel-ready” capital projects, the spike of the
only for Michigan and Ohio. Unlike the other six-state capital spending occurred three years
five states, the Wisconsin state capital outlays after ARRA was passed and the recession
per capita increased for four consecutive years was officially over in 2009. The delayed capital
from 2008 to 2011, but declined in 2012. outlays mitigated the stabilization function of
government fiscal policies. In other words,
In the 2001 recession, four of the six state capital planning and engineering were not
governments (Illinois, Indiana, Michigan, and advanced enough to spend the funds when
Wisconsin) increased their capital outlays the economy needed it most.
How Do States Finance Infrastructure Projects?
State infrastructure projects are traditionally spending in California was borrowed using
financed by state own current revenues, bonds in the period 2008–2017. Roughly 41
funds provided by federal government, and percent of capital spending in Illinois was
borrowed funds that are repaid using future funded through municipal bonds (Mattoon &
tax revenues or user charges. Private funding Wetmore, 2019).
of public infrastructure projects increased both
in value and number in late 2000s, particularly Infrastructure Spending through
through highway public-private partnerships Debt
(PPPs), although it still remains a small part State governments can sell municipal bonds
of total infrastructure spending in the U.S to receive up-front funding for infrastructure
(Congressional Budget Office, 2020). State projects and then repay the investors, with
governments pay for infrastructure spending interest, over a certain period of maturity.
through a combination of proceeds from The two main types of bonds are general
municipal bonds and special fund revenues. obligation (guaranteed) bonds and revenue
For example, over 60 percent of infrastructure bonds (non-guaranteed). States repay generalGovernment Finance Research Center 11
obligation bonds using the revenue from officials who may postpone a significant part of
their general funds, while revenue bonds are the borrowing cost beyond their terms in office.
typically repaid using the revenue from fees
and charges paid by the users of the facility. Infrastructure Spending from
In some cases, certain revenue bonds are Current Revenues
paid using state general fund revenue. For Concerned with excessive debt burden,
example, lease revenue bonds are a special the requirement of cash payment for large
kind of revenue bond that a state repays with expenditures emerged under the name
the rent payments made by the department “pay as you go”. The cash payment is from
that occupies the facility. current special fund revenues that are usually
reserved or designated for capital use only.
Debt financing has been one of the primary Dedicated revenues include state gasoline
sources of funding for state infrastructure. taxes, tolls or fees from bridges, or other
Because of high price tags for infrastructure facilities.
projects, state governments can avoid
undue pressure on their current revenues by Compared with debt financing, cash payment
financing the projects using borrowed funds. avoids immediate costs of issuing bonds and
By matching the term of debt maturity with long-term commitment of interest payments
the useful life of the funded capital project, so that state governments will have more
debt financing meets the criterion of inter- resources available for operating purposes. In
generational equity because the cost of addition, cash payment reduces the need for
repaying the debt will fall on the users who will issuing debt and thereby helps control the debt
benefit from the facility.6 Another advantage burden, which is critical to maintain desirable
of debt financing is that interest rates charged credit ratings and preserve flexibility in future
on borrowing for infrastructure are often lower financing of capital projects. However, the
than those on borrowing for other purposes mismatch between cost bearers and service
because the interest received from municipal beneficiaries is a major shortcoming of the
bonds is tax-exempt to the holder of debt. The pay-as-you-go system, which violates the
interest subsidies help lower the borrowing criterion of inter-generational equity. Another
cost of state governments if they issue general potential issue is that the cash payment is
obligation bonds or qualified private activity likely insufficient to meet the need of capital
bonds. spending. For example, Illinois revenues from
the motor fuel tax only increased by 6 percent
There are some drawbacks associated with between 2012 and 2018 due in part to more
government debt financing of capital projects. fuel-efficient vehicles (Mattoon & Wetmore,
First, it requires a variety of expenses to issue 2019). Taking inflation into account, the motor
a bond because the issuing government fuel tax revenues in constant dollars actually
needs to pay for necessary legal, financial, declined during that period.
and underwriting costs. Second, the debt
service for general obligation bonds and Infrastructure Funding through
some revenue bonds comes from government Public-Private Partnership
general funds, and substantial debt service State governments often hire private
payments may compete with financial contractors for constructing or maintaining
resources that would otherwise be available public infrastructure. PPPs have been
for other programs. Debt financing commits increasingly used recently as an alternate
government resources for extended periods of way of financing public infrastructure
time, and therefore can be misused by public projects. For example, Florida, Texas, and
6 Inter-generational equity means that each generation should pay fully for the cost of its use of public capital
assets.Government Finance Research Center 12
Virginia implemented most of their highway state control. State debt issuance and cash
partnerships with private financing in recent payment are constrained by various rules
years (Congressional Budget Office, 2020). and limits. Private financing is limited by risk
PPPs are usually structured so that the private aversion of private investors and state laws
partners share risks and benefits from a governing the extent and form of private
capital project and have incentives to minimize financing. All funding sources may become
potential risks such as cost overturn and even more insufficient during recessionary
schedule delays and to maximize potential years. In other words, without necessary
benefits like increased return on investment. policy adjustment, the conventional
Private financing can expedite capital projects sources of funding cannot sufficiently meet
because various legal and fiscal rules restrict the economic stabilization function at the
state governments’ ability to spend their state level.
current revenues or issue new debt.
A new funding mechanism is needed for
If private partners provide financing, they states to play a meaningful role in stabilizing
are expected to be repaid by collecting user their economic conditions. One option is to
charges from the financed project and/or establish a state infrastructure stabilization
receiving installments of direct payment from fund. Almost all states use specialized and
state government. The receipt of government formalized BSFs as their major countercyclical
direct payment is often guaranteed, while mechanism, and studies have shown that
the collection of user charges is subject to BSFs have been effective in stabilizing
demand fluctuation. A review of recent PPPs state budget outlays (Sobel & Holcombe,
indicates a trend of reducing the risk borne by 1996; Douglas & Gaddie, 2002). A separate
private partners. For partnerships with private infrastructure investment fund could be
financing before 2008, 17 percent of the established to play economic stabilization
private investment was guaranteed by direct function by saving cash during expansionary
payments. That percentage increased to about periods and investing in infrastructure projects
44 percent after 2008 (Congressional Budget during recessionary periods.
Office, 2020).
The presence of a BSF does not necessarily
PPPs are still uncommon for transportation stabilize government budgets because its
infrastructure in the U.S. and quite rare in the effectiveness depends on specific structure
six Upper Midwest states. Private financing of the fund. Douglas and Gaddie (2002)
of public infrastructure projects can help report that the BSFs in many states are not
address the delay of government funding large enough to have the expected effects.
due to various institutional and fiscal limits. Sobel and Holcombe (1996) point out that the
Studies also show that PPPs can reduce the deposit rules also make a difference. Unlike
average length of design and building phases smoothing state budget expenditures, the
and the lifecycle costs of public infrastructure infrastructure investment fund is designed
projects (Congressional Budget Office, 2020). to stabilize economic condition through
However, PPPs can also result in a reduction infrastructure investment. The high price tags
of public control and, in some cases, higher of capital projects require substantial savings
costs for users of the infrastructure. during good economic years. Deposit and
withdraw rules must also meet the expected
State Infrastructure Investment economic stabilization function. The deposit
Fund as Countercyclical Tool should be closely tied to a state’s economic
Government infrastructure projects are condition and infrastructure need. The
normally financed by debt issuance, cash release of the fund can only be triggered by
payment, private funding, and federal precipitous decline of statewide employment,
assistance. Federal assistance is out of and can only be used for investment inGovernment Finance Research Center 13
productive capital assets. capital spending during expansionary periods.
This does not mean that states need to spend
A countercyclical infrastructure investment more than they should on public infrastructure.
fund can reduce the need to borrow and It calls for a restructuring of the state capital
serves a stabilization function during both financing mechanism so that state investment
economic recession and expansion through in infrastructure can also help stabilize its
the acceleration of capital spending during and regional economies, especially during
recessionary periods and the deceleration of economic recession.
Barriers and Pathways for State Countercyclical
Investment in Infrastructure
As discussed in the prior section, state either limits on supplementary appropriations
governments may use a combination of debt or within fiscal-year controls to avoid a deficit.
issuance and cash payment to pay for their According to this classification, Illinois,
share of infrastructure cost. However, state Michigan, Minnesota, Ohio and Wisconsin
fiscal policies are made within the confinement have strong BBRs whereas Indiana has a
of relevant legal limits and prevailing political weak BBR.7
culture. For example, most of the states
face BBRs when they decide on operating Appendix B presents the details of BBRs for
expenditures. There are also constitutional the six states. For example, Article 8, Section
or statutory limits on states’ capacity to 2 of the Illinois State Constitution requires the
issue general obligation or other types of governor to submit a balanced budget to the
debt. Therefore, the implementation of the assembly for appropriation. The same article
proposed state countercyclical infrastructure also requires the state legislative body to
program requires mitigating some of the legal pass a balanced budget. The state of Indiana
and institutional barriers that restrict states’ amended Article 10, Section 5 of the Indiana
capacity to finance a fiscally countercyclical Constitution to introduce a weak BBR that
and economically simulative infrastructure went into effect for the 2019-2020 biennial
program. state budget. As the amendment stipulates, if
costs exceed revenue at the end of a biennial
BBRs are constitutional or statutory rules budget period, then the next biennial budget
that prevent state government from spending has to subtract the shortfall from the projected
more than their revenues. The rules vary in revenue for the next budget period. Unlike
design and stringency across states. Some the other five states, the amended Indiana
states only require the proposed or enacted Constitution allows for the balanced budget
budget to be balanced. A more stringent rule requirement to be suspended if at least two-
requires that the budget must be balanced thirds of both state legislative houses vote to
when the fiscal year is over. Rueben, Randall do so.
and Boddupalli (2018) classify a strong BBR
as one that meets at least one of the following The legally binding BBRs limit a state’s
requirements: (1) the governor must sign a capacity of using its current revenues to
balanced budget; (2) the state is prohibited finance capital projects. The restricting
from carrying over a deficit into the following effects are particularly troublesome for the
fiscal year or biennium; or (3) the legislature proposed state countercyclical infrastructure
must pass a balanced budget accompanied by program because states are not able to make
7 “What are state balanced budget requirements and how do they work?” https://www.taxpolicycenter.org/briefing-
bookGovernment Finance Research Center 14
important infrastructure investment due to values in a state. For example, in Minnesota,
revenue shortfalls during economic downturn. the total tax-supported principal outstanding
The reality is even worse as some state shall be 3.25 percent or less of total state
governments often postpone their capital personal income. Wisconsin State Constitution
spending plan as a strategy to balance their limits the aggregate state debt in any calendar
budgets. In this sense, the BBRs play a year to a certain percent of the aggregate
pro-cyclical rather than countercyclical role value of all taxable property in the state. The
because the delayed capital expenditures debt limits in Illinois, Michigan and Minnesota
likely further drag the economy down when can be overridden with a supermajority of the
economic stability is much needed during state legislature. The Ohio State Constitution
recessionary times. limits the annual debt service to 5 percent of
the estimated total general fund revenues.
In order to effectively implement the state Indiana does not have a debt limit on state
infrastructure program, the pro-cyclical nature general obligation debt. Appendix B includes
of BBRs should be addressed. The primary the details of debt limits for the six states.
intent of BBRs is to control government
spending within its available resources. Figure 8 shows state general obligation debt
However, to balance government budget as percent of personal income for the Upper
annually or biennially may not in the best Midwest states except Indiana. It shows that
interest of a state. The state economy expands four of the five states (MI, MN, OH and WI)
and contracts through business cycles. So it have relatively low debt burden, and their
is more sensible to balance a state budget general obligation debt was below 3 percent of
over a multi-year cycle. At least it does more state personal income. In 2019, Minnesota’s
harm than good to require a balanced budget state general obligation debt was about 2.1
in every year during a recession. Therefore percent of state personal income, well below
we suggest that the BBRs be suspended the limit of 3.25 percent. The figure also
if needed to provide necessary funding for indicates that state general obligation debt has
states to stabilize economic condition through been declining relative to state’s total personal
investing in public infrastructure. Some states income in recent years. This suggests that
would need to rewrite their constitutions the six states of the Upper Midwest should
or statues to allow
temporary suspension Figure 8: State government general obligation debt as
of BBRs similar to the percent of personal income
newly enacted BBR in
Indiana’s Constitution.
States’ BBRs do
not apply to capital
projects financed
through bonded debt.
However, most states
face other limits on
their capacity to issue
general obligation
bonds. The limits
on state general
obligation debt are
either tied to the total
personal income or
the taxable propertyGovernment Finance Research Center 15
have sufficient space within their legal debt economic downturn and still maintains BBRs’
limits to issue general obligation debt for spirit of controlling excessive government
countercyclical infrastructure investment spending. The deficits during recessionary
immediately without changing their periods can be balanced by raising additional
constitutions or statutes. revenues during expansionary periods. As a
result, state budgets will be in balance over
This section examines relevant institutional a multi-year timeframe although the annual
barriers to the implementation of a or biennial budgets may not necessarily be
countercyclical infrastructure program. The balanced. The debt limits can be made flexible
focus is on BBRs and debt limits that may in a similar way by allowing government debt
constrain necessary state countercyclical to be temporarily over the limits if economy
policy responses during economic recessions. condition requires and achieving the control
We suggest that BBRs be made responsive to of debt level over a multi-year period. Since
business cycles through temporary suspension many state governments are well below their
of the requirements if needed. The temporary current debt limits, there is no urgent need
measure provides necessary funding for the to make adjustment to the current debt limit
proposed state infrastructure program during policy.
Findings and Recommendations
The paper is motivated by the practical need region cooperate their stimulus efforts. The
for states to play a significant role in economic underutilized workforce during an economic
stabilization by establishing a countercyclical recession may also help contain the fiscal
infrastructure investment program. The spillovers within the state boundaries. Second,
state role can be complimentary to federal states can enhance their fiscal capacity
fiscal stimulus program, or fill in the gap of by utilizing funding from multiple sources
government action if federal policy-making including private financing and a proposed
is absent or delayed. Compared with federal state infrastructure investment fund. The
policies that apply to the entire country, state temporary suspension of state institutional
level countercyclical fiscal policies can be limits can enhance state revenue generating
customized to address specific regional and capacity. This does not change the nature of
state economic issues and challenges. those institutional arrangements. We propose
a flexible way to implement those control
The orthodox public finance theorists are mechanisms in order to stabilize economic
suspicious about the role states play in conditions and control government spending
stabilizing economic conditions because of over a multi-year timeframe.
substantial fiscal spillovers and limited fiscal
capacity at the state level. We agree that it The reason why the countercyclical state
is theoretically sound to assign economic program focuses on public infrastructure is
stabilization function only to federal or twofold. First, well-implemented infrastructure
national government, and it is suboptimal that investment can stimulate the economy and
subnational governments take discretionary generate sustained benefits to a diverse
countercyclical fiscal actions. However, workforce including skilled and unskilled
economic efficiency is one of several criteria in workers. Infrastructure investment is generally
government policymaking, and there are ways considered to be a highly effective engine
to mitigate the potential efficiency loss. of job creation that is much needed during
recessionary periods. Second, there has
First, the spillover effects can be substantially been a substantial gap between the condition
curtailed if all states or states in a particularGovernment Finance Research Center 16
of and investment in critical infrastructure in applicable to a multi-year period.
the United States. The American Society of Flexible BBRs and debt limits will
Civil Engineers estimated an infrastructure provide state governments necessary
investment gap of $2 trillion in 2016-2025; resources to stabilize their economies in
failing to close this gap could have serious case of economic recession.
economic consequences.8 Substantial
government investment is required to
improve public infrastructure, which is a major
determinant of economic competitiveness.
The proposed infrastructure program does
not mean states should make excessive
investment in public infrastructure. What
we propose is to adjust the timing of state
infrastructure investment in response to
business cycles.
Following are specific actions for state
governments to consider in order to play
their part in stabilizing state economies. We
recommend:
• Each state to incorporate economic
stabilization into their capital planning
as an important policy goal. The
countercyclical capital budget should
direct more capital spending during
recessionary periods and less capital
spending during expansionary periods.
In particular, state investment in
infrastructure should be substantially
increased to serve as a meaningful
buffer to economic downturns.
• Each state to establish an infrastructure
investment fund in addition to the
existing budget stabilization fund.
State governments take responsible
actions to stabilize both their budgets
and economies. Necessary deposit
rules should be enacted to accumulate
sufficient resources in the infrastructure
investment fund, which can only be
released under certain conditions such
as precipitous decline of statewide
employment.
• Each state to alternate their BBRs
and debt limits, and make the rules
8 Please see http://www.infrastructurereportcard.org/the-impact/economic-impact/Government Finance Research Center 17
References
Carlino, Gerald, and Robert P. Inman. 2013. Heintz, James, Robert Pollin, and Heidi
“Local Deficits and Local Jobs: Can US States Garrett-Peltier. 2009. “How Infrastructure
Stabilize Their Own Economies?” Journal of Investments Support the US Economy:
Monetary Economics 60 (July): 517-30. Employment, Productivity and Growth.”
Political Economy Research Institute (PERI),
Congressional Budget Office. 2020. Public- University of Massachusetts-Amherst.
Private Partnerships for Transportation and
Water Infrastructure. Available at https://www. Hines, James R. 2010. “State Fiscal Policies
cbo.gov/publication/56044 and Transitory Income Fluctuations.”
Brookings Papers on Economic Activity (Fall
Denison, Dwight V., Merl Hackbart, and 2010): 313-337.
Michael Moody. 2006. “State Debt Limits:
How Many Are Enough?” Public Budgeting & Hou, Yilin. 2003. “What Stabilizes State
Finance 26(4): 22-39. General Fund Expenditures in Downturn
Years—Budget Stabilization Fund or General
Douglas, James W., and Ronald K. Gaddie. Fund Unreserved Undesignated Balance?”
2002. “State Rainy Day Funds and Fiscal Public Budgeting & Finance 23(3): 64-91.
Crises: Rainy Day Funds and the 1990–1991
Recession Revisited.” Public Budgeting & Hou, Yilin. 2013. State Government Budget
Finance 22(1): 19-30. Stabilization: Policy, Tools, and Impacts. New
York, NY: Springer.
Germaschewski, Yin. 2020. “Stabilization
Policy, Infrastructure Investment, and Welfare Kiewiet, D. Roderick, and Kristin Szakaty.
in a Small Open Economy.” Economic 1996. “Constitutional Limitations on Borrowing:
Modelling 84: 322-339. An Analysis of State Bonded Indebtedness.”
The Journal of Law, Economics, and
Goodrich, Carter. 1960. Government Organization 12(1): 62-97.
Promotion of American Canals and Railroads,
1800–1890. New York: Columbia University Knight, Brian, and Arik Levinson. 1999. “Rainy
Press. Day Funds and State Government Savings.”
National Tax Journal 52(3): 459-472.
Gramlich, Edward M. 1987. “Subnational
Fiscal Policy.” Perspectives on Local Public Krol, Robert. 2020. “Will a Burst in Federal
Finance and Public Policy 3: 3-27. Infrastructure Spending Accelerate the
Recovery from the COVID-19 Recession?”
Gramlich, Edward M. 1997. “Subnational Mercatus Center Policy Brief, George
Fiscal Policy.” In Financing Federal Systems: Mason University. https://www.mercatus.org/
The Selected Essays of Edward M. Gramlich. publications/covid-19-economic-recovery/
Cheltenham, U.K.: Edward Elgar will-burst-federal-infrastructure-spending-
Haider, Murtaza, David Crowley, and Richard accelerate
DiFrancesco. 2013. “Investing in Ontario’s Leduc, Sylvain, and Daniel Wilson. 2013.
Infrastructure for Economic Growth and “Roads to Prosperity or Bridges to Nowhere?
Prosperity.” Available at SSRN 2288379. Theory and Evidence on the Impact of
Haughwout, Andrew. 2019. “Infrastructure Public Infrastructure Investment.” NBER
Investment as an Automatic Stabilizer.” The Macroeconomics Annual 27(1): 89-142.
Hamilton Project. https://www.hamiltonproject. Leduc, Sylvain, and Daniel Wilson. 2014.
org/assets/files/Haughwout_web_20190506. “Infrastructure Spending as Fiscal Stimulus:
pdfGovernment Finance Research Center 18
Assessing the Evidence.” Review of Shape Tax and Spending Decisions. Available
Economics and Institutions 5(1): 1-24. from https://www.urban.org/research/
publication/budget-processes-and-great-
Leeper, Eric M., Todd B. Walker, and Shu- recession
Chun Susan Yang. 2010. “Government
Investment and Fiscal Stimulus.” Journal of Sobel, Russell S., and Randall G. Holcombe.
Monetary Economics 57(8): 1000–1012. 1996. “The Impact of State Rainy Day Funds
in Easing State Fiscal Crises during the 1990–
Mattoon, Richard H., and Sarah Wetmore. 1991 Recession.” Public Budgeting & Finance
2019. Best Practices for Financing Illinois 16(3): 28-48.
Infrastructure: A Conference Summary.
Available from https://www.chicagofed.org/ Straub, Stéphane. 2008. “Infrastructure and
publications/chicago-fed-letter/2019/414 Growth in Developing Countries: Recent
Advances and Research Challenges.” World
Moody, Michael, and Merl Hackbart. 2005. The Bank Policy Research Working Paper No.
Impact of State Road Fund Debt Limits: An 4460.
Empirical Analysis. Kentucky Transportation
Center Research Report. Available from U.S. Census Bureau. 2006. Government
https://uknowledge.uky.edu/cgi/viewcontent. Finance and Employment Classification
cgi?article=1169&context=ktc_researchreports Manual. https://www.census.gov/govs/
classification/
Musgrave, Richard. 1959. The Theory of
Public Finance. New York: McGraw-Hill. Wagner, Gary A. 2003. “Are State Budget
Stabilization Funds only the Illusion of
National Association of State Budget Officers, Savings? Evidence from Stationary Panel
2015. Budget Processes In The States: Spring Data.” The Quarterly Review of Economics
2015. Washington, DC: National Association and Finance 43(2): 213-238.
of State Budget Officers. Available from
https://higherlogicdownload.s3.amazonaws. Zandi, Mark. 2009. “The Impact of the
com/NASBO/9d2d2db1-c943-4f1b-b750- Recovery Act on Economic Growth.” Written
0fca152d64c2/UploadedImages/Budget%20 Testimony before the Joint Economic
Processess/2015_Budget_Processes_-_S.pdf Committee. Available from https://www.
economy.com/mark-zandi/documents/JEC-
Oates, Wallace. 1972. Fiscal Federalism. New Fiscal-Stimulus-102909.pdf
York: Harcourt, Brace, Jovanovich.
Pereira, Alfredo M. 2000. “Is All Public Capital
Created Equal?” Review of Economics and
Statistics 82(3): 513-518.
Perotti, Roberto. 2004. Public Investment:
Another (different) Look. Working Paper at
IGIER – Università Bocconi.
Ramey, Valerie A. 2020. “The Macroeconomic
Consequences of Infrastructure Investment.”
National Bureau of Economic Research
Working Paper No. w27625.
Rueben, Kim, Megan Randall, and Aravind
Boddupalli. 2018. Budget Processes and the
Great Recession: How State Fiscal InstitutionsGovernment Finance Research Center 19
Appendix A: Direct General Capital Outlays per Capita for
Six States1
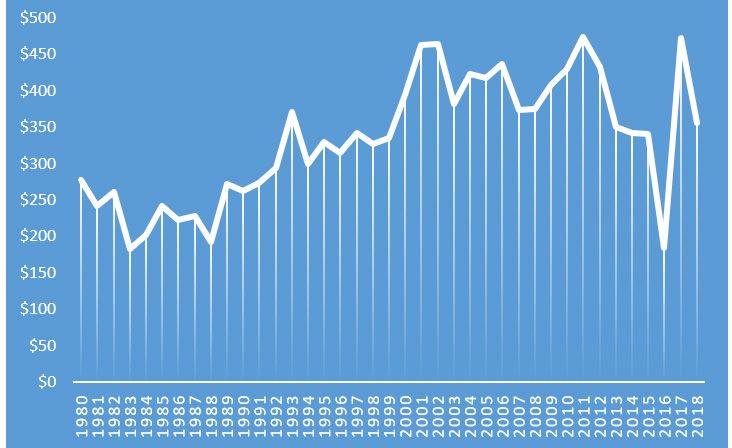
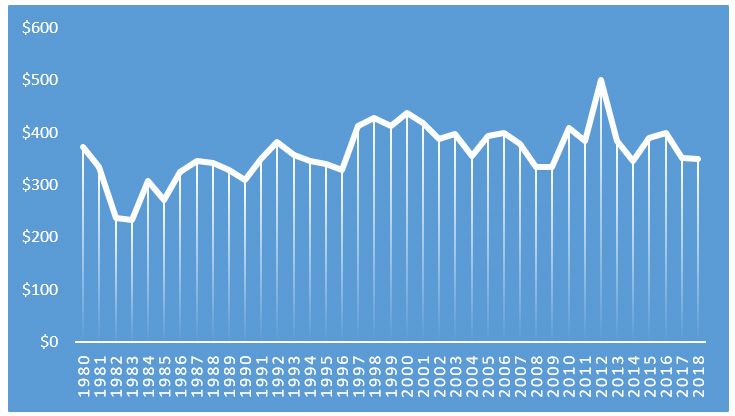
Illinois State Capital Outlays
The Illinois state capital outlays per capita show a clear spike in 2012, with an 83 percent
increase from 2011. During the Great Recession (December 2007–June 2009), Illinois state
capital outlays per capita dropped by 14.1 percent in 2008 and increased by 19 and 20.3
percent in 2009 and 2010, respectively. In the 2001 recession (March–November 2001),
Illinois state capital outlays per capita increased by 32.2 and 15.6 percent in 2001 and 2002,
respectively. During the early 1990s recession (July 1990–March 1991), Illinois state capital
outlays per capita dropped by 3.4 percent in 1990 and increased by 7.1 percent in 1991.
Figure 2: Illinois state direct general capital outlays per
capita
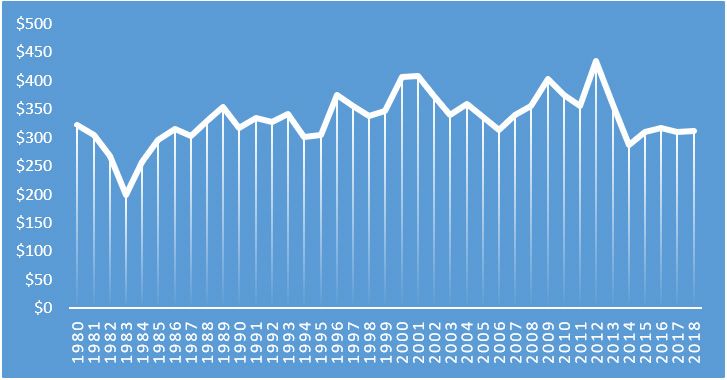
Indiana State Capital Outlays
The Indiana state capital outlays per capita show a clear spike in 2012, with a 22.5 percent
increase from 2011. During the Great Recession (December 2007–June 2009), Indiana state
capital outlays per capita increased by 4.8 and 13.3 percent in 2008 and 2009, respectively.
In the 2001 recession (March–November 2001), Indiana state capital outlays per capita
increased by 0.2 percent in 2001, and dropped by 8.6 percent in 2002. During the recession
of July 1990–March 1991, Indiana state capital outlays per capita dropped by 10.6 percent in
1990 and increased by 5.6 percent in 1991.
1 The data of state capital outlays are from U.S. Census Bureau’s Annual Survey of State and Local Government
Finances. The annual capital outlays are converted to real 2012 dollars using the Bureau of Economic Analysis
price index for state and local government consumption expenditure and gross investment divided by state
population.Government Finance Research Center 20
Figure 3: Indiana state direct general capital outlays per
capita
Michigan State Capital Outlays
The Michigan state capital outlays per capita show a clear spike in 2012, with a 36.4
percent increase from 2011. During the Great Recession (December 2007–June 2009),
Michigan state capital outlays per capita declined by 5.1 and 11 percent in 2008 and
2009, respectively. However, the per capita measure increased by 39.5 percent in 2010.
In the 2001 recession (March–November 2001), Michigan state capital outlays per capita
increased by 0.5 percent in 2001 and dropped by 6.6 percent in 2002. During the early
1990s recession (July 1990–March 1991), Michigan state capital outlays per capita dropped
by 20.6 and 12 percent in 1990 and 1991, respectively.
Figure 4: Michigan state direct general capital outlays per
capitaYou can also read