GOVERNMENT POLICY STATEMENT ON LAND TRANSPORT 2015/16-2024/25 - Publish date: 15 June 2014
←
→
Page content transcription
If your browser does not render page correctly, please read the page content below
ENGAGEMENT DRAFT
             GOVERNMENT POLICY STATEMENT
             ON LAND TRANSPORT
             2015/16-2024/25

Publish date: 15 June 2014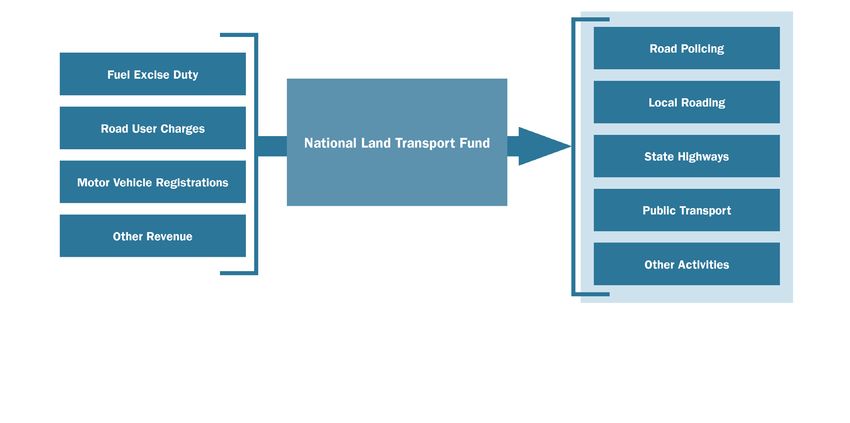
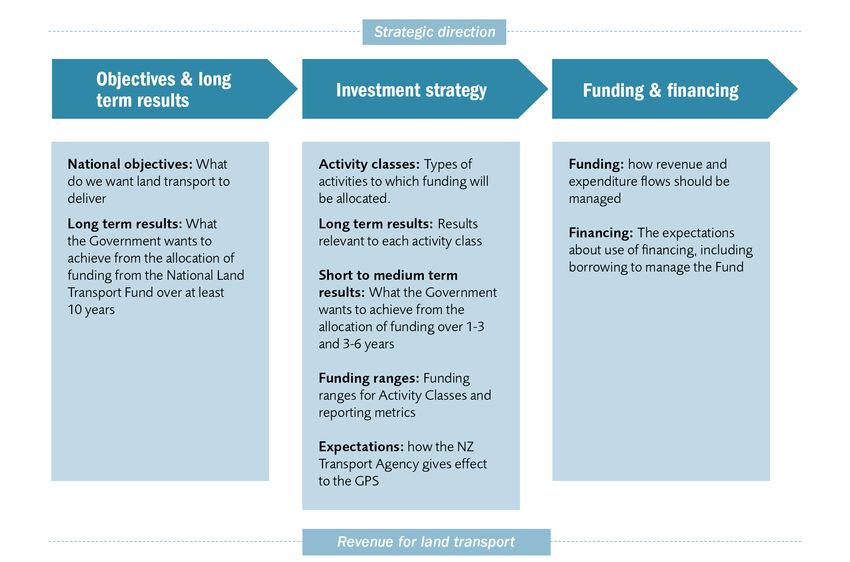
CONTENTS

INTRODUCTION                                                              2
SECTION 1: GPS 2015 (DRAFT) FRAMEWORK                                     4
        A. The purpose of the GPS and what it does                        4
        B. Framework for GPS 2015                                         5
        C. Scope of GPS 2015                                              5
SECTION 2: CONTEXT FOR GPS 2015 (DRAFT)                                   7
        A. Government infrastructure policy                               7
        B. Demand                                                         7
        C. Exporting                                                     10
        D. Congestion                                                    10
        E. Funding                                                       10
SECTION 3: STRATEGIC DIRECTION		                                         11
        A. Strategic Direction                                           11
SECTION 4: GPS OBJECTIVES AND RESULTS		                                  12
        A. Objectives                                                    12
        B. Results                                                       12
        C. Mapping of result and objectives                              12
SECTION 5: INVESTMENT IN LAND TRANSPORT                                  19
        A. Total funding for GPS 2015 (draft)                            19
        B. Activity class framework                                      20
        C. Statement of Ministerial expectations                         31
SECTION 6: FUNDING SOURCES AND MANAGEMENT OF EXPENDITURE                 35
        A. Primary approach to funding land transport                    35
        B. Principles guiding the use of alternative funding sources     35
        C. Principles guiding the management of expenditure to revenue   36
SECTION 7: APPENDICES		                                                  37

                                                   ENGAGEMENT DRAFT       1
INTRODUCTION
Transport is a critical part of daily life for all Continued funding under GPS 2015 (draft) for State
New Zealanders, enabling a range of activities highway improvements will bring benefits for national
economic growth and productivity, particularly given that
and making a significant contribution to New State highways carry most freight and link major ports,
Zealand’s economic growth and productivity. airports and urban areas.
Effective transport enables travel to and from work, access Significant steps are being taken to improve all of New
to services, and visits to family and friends, and allows Zealand’s critical land transport infrastructure.
businesses, regions and cities to be productive and well-
connected. Roads of National Significance (RoNS)
Recognising the importance of our land transport The RoNS have been the most visible evidence
network, over $3.0 billion of New Zealanders’ money of this investment, and represent the largest
is spent through the National Land Transport Fund (the improvement programme in our history, with a
Fund) each year. This investment is accompanied by a focus on lead investments that will reduce the costs
further $1.0 billion of local government investment. The of doing business.
Government Policy Statement on land transport (the GPS)
sets out the strategy for this investment and the results the Freight
Government wants to achieve from it over the next
Considerable investment has been made to
10 years.
improve the productivity of the entire land
GPS 2015 (draft) continues the approach begun in 2009 transport network. As at 2014, approximately
of putting the wealth generating capacity of our economy 4,500km of the network has been approved for 44
at the top of the agenda. It focuses on investments that to 62 tonne high productivity motor vehicle use.
will improve connectivity and reduce the costs of doing This has required considerable effort to strengthen
business. It maintains the impetus on improving the safety bridges and structures across New Zealand.
of travel, and puts a spotlight on continuing to deliver
measurable value from land transport investment. Congestion
GPS 2015 (draft) provides a solid land transport A key priority has been to address severe urban
foundation for a thriving New Zealand. congestion, with a particular focus on Auckland.
The overall proposal for the national strategic direction for An efficient and effective transport network
land transport is as follows: for Auckland is crucial to improving the city’s
contribution to national economic growth. A
To drive improved performance from the land key part of this involves transport investments
transport system by focusing on: which support areas of residential and business
• economic growth and productivity growth, improve travel times, reduce fuel use, and
• road safety improve safety. We need to do all of this without
• value for money placing an unreasonable funding burden on the
population. This will require the use of all available
transport tools, including increases in network
Supporting economic growth and capacity. High value investment in State highway
productivity capacity improvements will be brought forward
with support from central Government. Additional
Following more than a decade of increasing concern measures to improve the capacity of other choke
about under-investment in roading infrastructure, in points in Auckland’s network will proceed as a
2009 the Government began a significant improvement normal part of the Fund’s allocation process.
programme. With an intention to invest nearly $11 billion
Alongside investment from the Fund, the
in New Zealand’s State highways over the 10 years to
Government has made significant investments
2019, the Government focused on enabling economic
in metro rail improvements in Wellington and
growth rather than simply responding to it, providing high
Auckland, and supporting the KiwiRail Turnaround
quality connections between key areas of production,
Plan.
processing and export.
2 ENGAGEMENT DRAFTLocal roads Value for money
The Government recognises the important role
local roads have in connecting communities and As funding for transport infrastructure comes from
businesses. GPS 2015 (draft) continues the level of motorists, businesses and ratepayers, we have a
investment to allow existing levels of activity to be responsibility to ensure costs are kept under control, and
maintained. that any additional funding delivers the best possible
outcomes for New Zealand. To that end, the Government
through GPS 2015 (draft) has asked the NZ Transport
Public transport
Agency to continue the work it has started on improving
We see the need for public transport to help the productivity of investment.
unlock the potential of growing urban centres
To ensure we get the maximum impact from our efforts to
by providing a choice of ways to move around.
drive growth, GPS 2015 (draft) strengthens our focus on
The Government recognises that improving the
delivering measurable value from the investment in the
capacity of the network is as important as building
land transport sector. This applies irrespective of which
new infrastructure, and public transport will
agency is making the investment, and encompasses
continue to be funded to help increase network
State highways, local roads, public transport and policing
capacity. GPS 2015 (draft) provides for increased
services. It reflects expectations to ensure a strong
provision of public transport services, where
rationale for projects and activities by requiring a greater
justified by demand.
culture of continually seeking better and smarter ways
of operating.
Active modes
While the Government is confident that significant
The investment made in walking and cycling under
progress has been achieved during GPS 2012 we are
GPS 2015 will enable ongoing progress to be made
seeking more ambitious results in GPS 2015 (draft). We
on improving the urban cycling networks in our
expect all road controlling authorities to work together to
main centres.
continually improve asset management and procurement
approaches, and to share best practice with others.
Road safety
Maintenance
Road safety remains a key transport priority for Progress is being made on improving the returns
Government. Every year thousands of New Zealanders are from maintenance investment. GPS 2015 (draft)
killed or seriously injured in crashes. The Government has anticipates that progress will continue in this area.
taken a ‘safe system’ approach to this problem through the This includes the ongoing implementation of the
Safer Journeys road safety strategy. This means looking findings of the Road Maintenance Taskforce and
across the entire transport system - roads, vehicles and identification of further opportunities to improve
users - to deliver greater levels of safety. investment productivity.
GPS 2015 (draft) supports the delivery of the Safer
Journeys vision of a safe road system increasingly free of Improvements
death and serious injury. It does this through investment in Similarly, continuing to drive for the best
safer roads and roadsides and safer road use. Each of the possible measurable value from State highway
RoNS will be built to a high safety rating. Other road safety improvements is anticipated both from investments
investments will occur in local roads, road policing and in prioritised by the Government, such as RoNS, and
the road safety promotion activity classes. the wider State highway improvement programme.
GPS 2015 (draft) will make it clearer how much of our
investment in roading delivers safety benefits that will
save lives. Good information is needed to ensure safety
expenditure delivers the best possible results per dollar
spent.
ENGAGEMENT DRAFT 3SECTION 1: GPS 2015 (DRAFT) FRAMEWORK
1. This section sets out the framework for GPS 2015 6. The NZ Transport Agency, local government,
(draft). the New Zealand Police and other approved
organisations2 will use the framework in the Act
to deliver investment across New Zealand that is
A. Purpose of the GPS and what prioritised and coordinated.
it does 7. While the GPS provides a national picture for
investment, the detail of how funding is allocated
2. The Land Transport Management Act 2003 (the Act)
to regions and specific activities is the responsibility
requires the Minister of Transport to issue a GPS.
of the NZ Transport Agency. This is expressed
3. GPS 2015 (draft) sets out national land transport in the National Land Transport Programme (the
objectives for a period of at least 10 financial years, Programme).
and the results that the Government wishes to
8. A full description of what the GPS must include, and
achieve from allocation from the Fund.
how it links with national and regional land transport
4. The GPS presents the Government’s land transport planning, is provided in Appendix A.
strategy in a framework that will guide investment
9. Once finalised, GPS 2015 will be issued by the
over the next ten years, and provides guidance to
Minister of Transport, and will cover the financial
decision-makers about where Government will focus
period 2015/16 to 2024/25. It will have effect from
resources, consistent with the purpose of the Act.
1 July 2015. The land transport investment strategy,
It does this by allocating funding to different types
which is included in the GPS, must be reviewed
of activities, and identifying results which focus
every three years.
on particular elements of the Act’s purpose. The
purpose of the Act is:
“To contribute to an effective, efficient, and safe land
transport system in the public interest”1.
5. Without limiting the legal interpretation of these
terms, for the purpose of GPS 2015 (draft), a land
transport system is:
• effective where it moves people and freight
where they need to go in a timely manner
• efficient where it delivers the right
infrastructure and services to the right level at
the best cost
• safe where it reduces the harms from land
transport
• in the public interest where it supports
economic, social, cultural and environmental
wellbeing
1
Section 3 of the Land Transport Management Act 2003 2
Approved organizations: territorial authorities, regional councils,
Auckland Transport, the Department of Conservation and the Waitangi
National Trust Board
4 ENGAGEMENT DRAFTB. Framework for GPS 2015 Collectively these provisions cover all of the
requirements in the Act. Figure 1 sets out the order
10. A GPS has a significant number of statutory in which the various statutory elements of GPS 2015
components. These components have been are presented3.
grouped so they move from the high level policy,
through the more detailed investment strategy,
to the machinery provisions about funding flows.
Figure 1: GPS 2015 (draft) framework
C. Scope of GPS 2015 Crown contributions
13. For the period to 2024/25, a number of land
11. GPS 2015 (draft) allocates investment from the transport projects and activities will be funded
Fund between different types of activity. It sets out through annual Crown appropriations rather than
activity classes and associated funding ranges. The though the Fund. This includes funding for capital
NZ Transport Agency then allocates that funding to investment in Wellington and Auckland commuter
projects in accordance with the objectives, results rail, and the SuperGold Card free off-peak public
and expectations set out in the GPS. transport scheme.
12. GPS 2015 (draft) also covers Crown funding made 14. Some projects in the Programme will be brought
available to the NZ Transport Agency for specific forward by Crown loans, such as the Auckland
investments. The GPS sets out the purpose of that transport package. Any Crown contributions will be
funding, its timing and whether it is in the form of a recorded in the GPS.
grant or a loan repaid from future revenues to the
Fund.
3
This framework reflects changes made to the Land Transport
Management Act 2003 that came into effect in June 2013, and which
affect the form and function of the GPS.
ENGAGEMENT DRAFT 5Rail freight, coastal shipping and freight Future developments in networks and vehicles
transfer facilities 21. One of the challenges faced by Road Controlling
15. While the Minister of Transport has a role in guiding Authorities across New Zealand is responding to
coordination within the rail sector, and between the developments in technology and demand.
rail, road and sea transport sectors, investment in rail 22. We expect that over the coming decade, technology
freight services and infrastructure is not currently will play an increasing part in managing network
covered under the GPS. access and capacity. We have seen that relatively
16. Investment in rail freight services and infrastructure small initiatives, such as improved traffic light phasing,
is managed by public bodies under their own have led to measurable improvements in traffic flows
empowering legislation. Investment in urban in the Auckland network. Promising developments
passenger rail services is funded from land transport in the fields of collision avoidance technology,
revenues and local rates, is delivered by regional autonomous vehicles, and in-vehicle telematics
councils, and is covered under GPS 2015 (draft). will continue to shape our understanding of how
to manage vehicles and networks more efficiently.
17. Funding of coastal shipping services, ports and
For example, lane control technology and automatic
airports are only covered to the extent that land
breaking systems increasingly common in new cars
transport services link these facilities. These services
could potentially evolve into systems that enable
are delivered by private providers, and there is no
significantly reduced separation distances between
authority to use revenue from the Fund for these
vehicles and improved traffic flows. This could
services.
enable a dramatic increase in peak period motorways
18. Nevertheless, there is benefit in public agencies throughput using existing infrastructure.
involved in rail freight and land transport investment
23. Mechanisms with longer-term potential to improve
coordinating their activities where possible. GPS
the performance of the land transport system, such
2015 (draft) provides guidance about the priority to
as more sophisticated road pricing than is delivered
be given to improving efficiency where these various
by the current Road User Charges system, could
networks link.
be included in a future GPS. Decisions to further
investigate these issues lie outside of GPS 2015
Regulation (draft).
19. Transport regulation (eg speed limits and give way
rules) is outside the scope of the GPS. This type of
regulation is undertaken by a range of public bodies,
including the NZ Transport Agency and the New
Zealand Police, but under different legislation.
20. Future GPSs could cover transport regulation.
Decisions to further investigate these issues lie
outside of the GPS and may require legislative
change.
6 ENGAGEMENT DRAFTSECTION 2: CONTEXT FOR GPS 2015 (DRAFT)
24. This section describes the context within which B. Demand
GPS 2015 (draft) has been developed, including
Government infrastructure policies, the nature 27. New Zealand’s transport system operates in a
and scale of demands being placed on the system, dynamic environment. While transport infrastructure
progress under GPS 2012, and the level of funding often has an operational life spanning many decades,
available. the demands that New Zealand has of the land
transport system are changing. This affects both the
A. Government infrastructure policy revenue available for investment, and the type of
investment which needs to be made.
25. GPS 2015 (draft) has been informed by overall
28. New Zealand is still in the process of addressing
national policies signalled by the Government.
some critical constraints on the network particularly,
These are:
but not exclusively, in the upper North Island.
• building a more competitive and productive
29. Continued investment is needed to address these
economy
constraints through the RoNS programme, the
• rebuilding Christchurch Auckland package, improvements in Christchurch
• delivering better public services within tight and measures to make more of the network
financial constraints accessible to heavier freight vehicles.
• responsibly managing the Government’s
finances
26. Elements of these national policies are reflected in
five national documents relevant to New Zealand:
• the Business Growth Agenda, with its focus on
growing our export capacity
• the National Infrastructure Plan, with its focus on
making better use of the existing network before
extending the network, and better allocation of
new investment when the network is extended
• the New Zealand Energy Efficiency Conservation
Strategy, with its focus on reducing the energy
footprint of the land transport system
• Connecting New Zealand, with its focus on
improving the efficiency of our transport
networks
• Safer Journeys, with its focus on a land transport
system that is a safe system
Further information about these documents and links is set
out in Appendix C.
ENGAGEMENT DRAFT 7Existing demand localised congestion on particular routes and at
specific pressure points. Demand has held up more
30. GPS 2015 (draft) has been prepared following a in the north and south than in central New Zealand.
period of modest increases in freight demand and Some parts of the Auckland network continue to
flat demand in light vehicle travel, measured in be subject to severe congestion, and congestion
vehicle kilometres travelled (VKT). This is illustrated in western Christchurch has increased markedly
in Figure 2. following the earthquakes.
31. Demand grew strongly through the early 2000s, 33. New Zealand’s major urban centres are more
easing back through the middle of the decade. densely populated than most cities in Australia or
Following the global financial crisis in 2008, demand America. Comparative congestion data suggests
returned to close to 2005/6 levels and remained at our urban road networks are under more pressure
these levels through to the end of 2013. A similar than cities with more roading per person. Further
period of flat demand occurred in the aftermath intensification may compound congestion pressures,
of the fuel crisis in the early 1970s. In that case, and retrofitting capacity to existing network can be
demand remained soft for more than 10 years. costly.
32. This overall demand story masks a regional story,
and one where New Zealand continues to have
areas where there are bottlenecks and intense
Figure 2: Travel demand as indicated by VKT and fuel consumption, 1944 to 2012
45
5,500 Total VKT (RHS)
5,000 Petrol consumption, 40
Vehicle kilometres travelled (billion)
Statistics NZ yearbook
Fuel consumption (million litres)
4,500 (LHS)
35
Petrol and diesel
4,000 for transport,
Energy in New Zealand 30
3,500 (LHS)
25
3,000
2,500 20
2,000 15
1,500
10
1,000
5
500
0 0
1940 1950 1960 1970 1980 1990 2000 2010 2020
Year
Sources: Ministry of Transport’s total VKT data (TV001)
Ministry of Business, Innovation and Employment’s Energy in New Zealand data
8 ENGAGEMENT DRAFTTravel forecasts Freight transport forecasts
34. Forecasting undertaken for the GPS and the recently 38. There is currently a recovery occurring in freight
released National Freight Demand Study suggests demand, with more freight being moved, but
that the transport task will recover as the economy in fewer trucks. Effective and efficient freight
strengthens.4 movement is critical to the economic health of an
exporting nation. Gains that can be made in this area
35. This recovery in demand would be led by freight
flow into the rest of the economy.
traffic, as production and consumption increases.
Personal travel is expected to increase in line with 39. New Zealand’s freight task is forecast to grow by 58
demographic trends. However the best available percent by 20425 (from 236 million tonnes in 2012
information to date suggests that growth in personal to over 373 million tonnes). This rate of growth is
vehicle travel will remain more muted than in slower than forecast in 2008, but still represents
previous economic cycles. about 2 percent growth per annum. Road is
expected to continue to remain the main mode for
36. This pattern is not unique to New Zealand. It appears
freight, accounting for about 70 percent of tonne
to be mirrored in the experience of most mature
kilometres, up to 26.3 billion kilometres.
economies that New Zealand tends to compare
itself to. 40. The majority of growth in tonnage by 2041 is
expected to be in building materials (102 percent)
37. In summary, overall demand is forecast to grow over
and waste (70 percent), with Auckland and
the period of GPS 2015, albeit at a slower rate than
Canterbury accounting for the bulk of movements
the early 2000s, and to be concentrated in areas
and growth. Growth in transportation of general
experiencing economic and population growth. The
agricultural products (62 percent) and dairy products
timing and scale of this increase in demand within
(60 percent) is expected to lead freight growth in
the GPS 2015 period is uncertain as these variables
regional New Zealand.
depend on the speed and scale of the economic
recovery and social changes.
Figure 3: Changes in Freight Flows by Origin Regions 2012 and 2042 (million tonnes)
100 2012 2042
90
80
70
60
million tonnes
50
40
30
20
10
0
gh
st
y
y
e
nd
d
ry
ki
on
go
u
nd
to
nt
Ba
oa
rn
an
at
na
ou
u
ka
la
e
gt
ta
la
rb
bo
aw
tC
hl
Pl
’s
ra
ck
or
ai
lin
O
th
te
ut
is
ke
Ta
W
lb
an
of
Au
or
es
el
an
G
So
ar
aw
N
W
M
W
y
C
/M
Ba
H
an
s m
Ta
(Source: National Freight Demand Study 2014)
4
National Freight Demand Study 2014, Ministry of Transport 5
Demand Forecast, NZIER, December 2013
ENGAGEMENT DRAFT 9C. Exporting Canterbury
47. Canterbury traffic patterns have been significantly
41. Exporting primary produce remains central to affected by land use changes following the
New Zealand’s economic welfare. Reducing the earthquakes. There has been a substantial shift
internal transport costs experienced by producers, of traffic to the west of Christchurch city. This has
processors and exporters of primary produce is one produced pressures on the network that will be
way to improve our international competitiveness. mitigated by a combination of the Christchurch
42. The RoNS target key freight links in growing regions. RoNS and the re-opening of the Central Business
Upgrades of bridges on State highways and local District.
roads to cope with more productive freight vehicles 48. However, there is substantial uncertainty around
will continue to unlock significant existing capacity. the speed and scale of further changes to the
However freight pressure points remain across distribution of Christchurch traffic. The long term
the network. impacts of changed land use patterns and associated
travel demands will become clearer over the next
D. Congestion three years. Additional measures to address network
capacity in the western areas may well prove
Auckland necessary over time.
43. Achieving an efficient transport system for Auckland
is central to improving the contribution the city can E. Funding
make to the national economy.
49. As a proportion of GDP, land transport expenditure
44. Since 2009, the Government has undertaken a in New Zealand is at its highest levels since the
major programme of investment in Auckland’s 1960s. There are high user and societal expectations
transport infrastructure. By 2017, Auckland will have for increases in levels of service across the whole
a completed motorway network and an upgraded transport network. Users express this in terms of
and electrified metro rail network. This investment reduced levels of congestion, a safer system, greater
programme is delivering significant results, helping to resilience, and mitigation of environmental impacts.
hold congestion steady despite population growth.
50. Transport decision-makers need to take account
45. Looking over the next 20 years, Auckland’s of those expectations, and ensure transport makes
population is expected to increase by 480,000, a broad positive contribution to the economy and
an amount roughly equivalent to the current size society. The land transport sector has stewardship of
of Wellington. The additional demand for travel a significant proportion of our national wealth, and
from this growth will put increasing pressure on needs to ensure that expenditure of those funds
Auckland’s transport network. Careful land use delivers the right infrastructure and services to the
decisions along with greater emphasis on public right level at the best cost. Government expects the
transport and demand management will play a role, sector to achieve results which are clear, achievable
but private vehicle travel will continue to account and measurable.
for 80 percent of daily trips. The location and timing
of new roading investments will be critical to the
development and redevelopment of new areas of
housing and business.
46. To accommodate new demand, further increases
in the capacity of the roading network, particularly
those sections currently experiencing severe
congestion, will remain a priority.
10 ENGAGEMENT DRAFTSECTION 3: STRATEGIC DIRECTION
51. This section describes the proposed overall strategic Road safety
direction for GPS 2015 (draft).
56. The Government has taken a ‘Safe System’ approach
to road safety through the Safer Journeys road
A. Strategic Direction safety strategy. This means looking across the
entire transport system to aim for safer roads and
52. The proposed overall national strategic direction for roadsides, safer speeds, safer vehicles, and safer
land transport is to: road users.
To drive improved performance from the land
transport system by focusing on: Value for money
• economic growth and productivity 57. All the funds available to advance the results
• road safety identified in this GPS need to be used in a way that
• value for money delivers the best possible value to New Zealanders.
We need a land transport system that is effective in
53. GPS 2015 (draft) maintains the direction set in 2009
enabling the movement of people and freight in a
of putting the wealth generating capacity of our
timely manner, and efficient in delivering the right
economy at the top of the agenda. It will do this by:
infrastructure and services to the right level at the
• continuing the focus on lead investments that best cost.
will materially reduce the cost of doing business
58. All the public bodies involved in providing the land
• maintaining an impetus on improving the safety transport system need to work together to improve
of travel its performance. The NZ Transport Agency will, as
• putting a spotlight on the measurable results for the Government’s delivery agent, continue to take
road users from investment in existing and new a leading role in securing improved effectiveness
transport capacity and efficiency within the priorities for investment
54. Productivity and safety will be supported by a established by the Government.
substantial investment package. Expectations of
decision-makers make it clear that an increased
emphasis is needed on securing the best possible
value from the current network and new investment.
Supporting economic growth and productivity
55. While the seven RoNS have been the most visible
evidence of investment in our productive capacity,
this is complemented by significant funding to
improve all of New Zealand’s critical roading
infrastructure. This effort can be seen both through
targeted improvements to enable bridges to carry
heavier freight vehicles, and more general funding
for improvements to regional networks.
ENGAGEMENT DRAFT 11SECTION 4: OBJECTIVES AND RESULTS
59. This section sets out the proposed national land B. Results
transport objectives and results the Government
wishes to achieve from the allocation of funding 61. The GPS is required to include the long term and
from the Fund. short to medium term results the Government wants
to achieve from the allocation of investment from
A. Objectives the Fund.
62. In advancing the high-level national land transport
60. The proposed national land transport objectives for
objectives, the long term results sought from land
GPS 2015 (draft) are for a land transport system that: transport investment are listed in Table 1.
• addresses current and future demand
• provides appropriate transport choices C. Mapping of results and objectives
• is reliable and resilient
• is a safe system, increasingly free of death and 63. On the following pages, each of the proposed
serious injury national land transport objectives is described in
more detail. In addition, the main long term results
• appropriately mitigates the effects of land
relevant to each objective are also described.
transport on the environment
64. All long term and short to medium term results are
set out in Table 3.
Table 1: Results sought from land transport investment
GPS 2015 Priority Associated long term results
Economic growth and Support economic growth and productivity through provision of better access to markets,
productivity employment and business areas
Support economic growth of regional New Zealand through provision of better access to
markets
Enable access to social and economic opportunities, particularly for people with limited
access to a private vehicle
Improved network resilience and reliability at the most critical points
Road safety Reduction in deaths and serious injuries at reasonable cost
Increased safe cycling through extension of the cycle networks
Value for money Delivery of the right infrastructure and services to the right level at the best cost
Improved returns from road maintenance
Improved returns from public transport
On-road enforcement of the road user charges regime at reasonable cost
Understand the costs associated with environmental mitigation
12 ENGAGEMENT DRAFTObjective: A land transport system that addresses current and
future demand
Description to provide improved connectivity to increase the
range of economic and social opportunity that can
65. The land transport system has a critical role in
be reached in a given travel time if the benefits of
connecting where people live, work and play. These
urbanisation are to be realised.
connections are vital to New Zealand’s economic
and social wellbeing. The demands placed on the Auckland is expected to account for 60 percent of
system are dynamic and change as economic and New Zealand’s population growth over the next
social conditions change. 20 years. An Auckland transport network that is
working well is crucial to improving the contribution
66. A land transport system that is capable of adjusting
the city can make to national economic growth.
to changing demand reduces the costs imposed
This includes addressing associated needs such as
on other parts of the economy and enables
a responsive housing supply and improving energy
New Zealand to compete more effectively in the
efficiency. Increased demand for travel arising from
global economy.
population growth needs to be accommodated at
an acceptable price to road users and Aucklanders.
Government’s long term results under This will require the efficient and effective use of
this objective all currently available transport tools, including
Result: Support economic growth and productivity improved traffic management and increases in
through provision of better access to markets, network capacity. GPS 2015 (draft) will enable:
employment and business areas • continued significant investment in a range of
transport initiatives, including the Auckland
67. New Zealand’s existing network is reasonably well transport package, that address congestion and
developed and provides most of the connections improve travel times for freight and general
needed at a local, regional and national level. traffic by increasing capacity on key routes
However, even better access is needed to markets, which are under pressure.
employment and areas that contribute to economic
c. Ongoing investment in Canterbury recovery: The
growth and productivity.
Canterbury earthquake recovery is well underway,
68. GPS 2015 (draft) will support this through: with provision in place under GPS 2012 to enable
the recovery programme to proceed as quickly as
a. Ongoing investment in our State highway possible. GPS 2015 (draft) will enable:
network: The State highway network provides
critical economic links for New Zealand businesses. • completion of the recovery of the Canterbury
Although the State highway network is only 12 land transport system, including supporting the
percent of the total roading network, it accounts for delivery of the Central City Recovery Plan and
about half of the vehicle kilometres travelled each the Greater Christchurch Recovery Strategy.
year, and about two-thirds of the vehicle kilometres d. Increase investment in our local road network:
driven by heavy vehicles. Some of these State Local roads have a critical role linking areas of
highway routes link growing economic hubs, or have production and processing to the national network
existing infrastructure that cannot cope with heavier and in supporting new areas of residential and
vehicles, and need improvement. GPS 2015 (draft) business growth. They account for 88 percent of the
will enable: network by length and provide most of the access to
properties. GPS 2015 (draft) will enable:
• completion of the RoNS programme, which is
designed to address capacity on our key supply • increased funding ranges for local road
chain routes improvements that deliver high measurable
• ongoing investment in improvements to increase returns on the investment
the percentage of the State highway network • an explicit commitment to regional roading
open to high productivity motor vehicles infrastructure through the creation of a GPS
b. Accelerated investment in Auckland: Liveable, activity class to replace regional funding
well connected cities are critical to our economic
and social prosperity. Our population and associated
economic activity is increasingly concentrated in our
urban areas. As the density of activity in our cities
rises, so does congestion. Our growing cities need
ENGAGEMENT DRAFT 13Result: Improved returns from investment in road as a result of the 40 percent additional capacity
maintenance from the new electric trains, bus congestion in the
Auckland central business district is expected to
69. The nature of the network needs to adjust to emerge as patronage grows and additional services
accommodate changing patterns of demand. Service are provided. GPS 2015 (draft) will enable:
levels on some roads may be adjusted upward and
• the provision and development of public
some adjusted downward over time.
transport services at levels appropriate to their
70. GPS 2015 (draft) will support this result through: patronage and network function
a Ongoing investment in maintaining the roading • completion of improvements to metro-rail
network: Around $1.5 billion a year is invested in services, integrated ticketing and public
operation, maintenance and renewal of the existing transport network changes intended to increase
network. The Road Maintenance Taskforce (the patronage, including transfer and interchange
Taskforce) identified the potential for worthwhile facilities
improvements in road asset management, • provision for targeted infrastructure
including the need for a nationally consistent improvements that improve transfer facilities
road classification system. The potential benefits across the network and address emerging
identified by the Taskforce have yet to be fully bus capacity constraints in central Auckland,
realised. GPS 2015 (draft) will enable: Wellington and Christchurch
• maintenance of the existing road network at • gains in public transport productivity
appropriate levels of service
Result: Support economic growth of regional
• increased road maintenance productivity New Zealand through providing better access
over time to markets
Result: Improved returns on investment in 73. Local roads and state highways have a critical role,
public transport linking areas of production and processing to the
national network. However, there are some regional
71. Public transport contributes to economic growth routes with an especially significant role in the
and productivity by providing additional capacity movement of freight and tourists that warrant a
on corridors serving our main office centres at peak particular investment focus.
periods. It also has a role in providing transport
choices. 74. GPS 2015 (draft) will support this result through:
72. GPS 2015 (draft) will support this result through: a Creation of a regional improvements activity
class: Regional routes have a critical role in regional
a Continued investment in public transport to
and provincial New Zealand. They link points of
increase total system capacity: Well used and
production with key distribution points. They also
configured public transport can increase network
provide tourists with access to local attractions. GPS
capacity on key corridors at peak periods when
2015 (draft) will enable:
they are under the most pressure. Considerable
investment has been made in the public transport • progressive replacement of regionally allocated
network to build patronage. Much of this investment funding with new regional funding in non-urban
has been ahead of patronage demand, particularly areas, that targets investment in regional route
in metro-rail services. A period of consolidation improvements that provide links to key freight
is needed where the focus is on securing the or tourist routes.
patronage gains anticipated from measures such as
integrated ticketing, reconfigured bus networks, and
metro rail investments. There are nevertheless some
pressure points where additional capacity may be
needed. For example, while constraints on Auckland
rail capacity are not expected in the medium term,
14 ENGAGEMENT DRAFTObjective: A land transport system that provides appropriate
transport choices
Description Result: Increased safe cycling through improvement
of the cycle lane network
75. The land transport system needs to be able to
support a choice of modes appropriate to user needs 78. Cycling provides an alternative for short journeys
at reasonable cost, to enable transport users to and for single purpose trips like commuting to work
access employment, education, and or school. Dedicated investment in cycling under
social opportunities. GPS 2012 has delivered encouraging outcomes from
the Model Communities initiatives and improved
Government’s long term results under cycle links. While cycling plays a small role in the
this objective total transport task, there has been growth in some
Result: Enable access to social and economic areas and the existing dedicated cycling facilities
opportunities, particularly for people with limited are largely fragmented. There are, therefore, a
access to a private vehicle number of opportunities for cycling to take a greater
role in providing transport system capacity in our
76. While the primary role of public transport main centres.
investment is to increase capacity where the 79. While there are health benefits associated with
network is experiencing severe congestion, as cycling where it increases the total amount we
addressed under the previous objective, public exercise, safety continues to be a concern, and
transport has an additional role in providing an represents a critical barrier to cycling fulfilling its
alternative to cars in urban areas where there is a transport task potential.
sufficient concentration of users to support cost
effective scheduled services. On demand services 80. GPS 2015 (draft) will support this result through:
for the transport disadvantaged provide a degree a Increased investment in cycle networks:
of network access to people who cannot use either Additional investment is needed in safe cycle
scheduled public transport or private transport. networks in the main urban areas. GPS 2015 (draft)
will enable:
77. GPS 2015 (draft) will support this result through:
• extension of the dedicated cycle networks in the
a Continued investment in specialised services:
main urban areas where this can be achieved
Public transport investment can deliver specialised
at reasonable cost, including impact on general
services (e.g. the Total Mobility scheme) that
traffic capacity.
provide access to the transport system for those not
able to use a car or public transport. Public transport • improved suburban routes for cyclists where
networks in urban areas can also contribute to this can be achieved at reasonable cost.
increasing the transport choices available to people,
including those that would otherwise be unable to
participate as fully in the workforce or continuing
education. However, some areas do not have the
density of population required to support scheduled
public transport services. Achieving this result
requires a focus on better use of available resources.
GPS 2015 (draft) will enable:
• provision of appropriate alternatives for the
transport disadvantaged, at reasonable cost
ENGAGEMENT DRAFT 15Objective: A land transport system that is reliable and resilient
Description 85. GPS 2015 (draft) will support this result though:
81. Disruptions to New Zealand’s land transport system a Ongoing investment in improving network
have implications for all users. When disruptions resilience as part of road improvements:
occur, it is important to restore services based on the Improvements are needed at the most critical points
importance of the link within the network. to reduce the impacts of disruption.
82. The risks and hazards that can cause disruption b Ongoing investment in responding to incidents
to the land transport system range from high as part of road maintenance: Investment in the
probability/low impact events such as vehicle initial response to restore basic land transport access
breakdowns on key commuter routes, to low after significant disruption.
probability/high impact events, such as natural c Provisions enabling bespoke funding for
disasters, to more gradual changes in environmental extraordinary events: Financial management
or demographic patterns. As the value and provisions allowing a flexible response to a major
complexity of transport infrastructure continues to event with multi-year implications for management
increase, so too natural hazards and events are likely of the Fund.
to increase the cost of remediation.
Government’s long term results under
this objective
Result: Improved network resilience and reliability
at the most critical points
83. The land transport system needs to respond
effectively to man-made events of high frequency
that cumulatively have a substantial impact on
economic welfare and productivity, and natural
events generally of lower frequency but with
substantial social and economic consequences.
84. Priority needs to be given to preventing or
responding to disruptions that pose the highest
economic and social costs to users. As with
other investments, this will need to be targeted
to where the most gains can be secured for the
investment proposed.
16 ENGAGEMENT DRAFTObjective: A land transport system that is a safe system, increasingly free
of death and serious injury
Description 89. GPS 2015 (draft) will support this result though:
86. Road safety is an ongoing issue. Deaths and serious a. Maintaining investment and improving returns
injuries are reducing due to a combination of in road safety: Road safety outcomes are tracking
improvements in vehicle safety, driver behaviour and in the right direction, and there is a case to at least
road infrastructure. Nevertheless, the costs of road maintain existing resourcing for road safety policing,
trauma remain high. The Government’s road safety road safety promotion and safety-related roading
direction is set out in the Safer Journeys Strategy, infrastructure.
with its safe system approach.
b. Clear reporting on the investment in road
safety infrastructure: Clear reporting is needed
Government’s long term results under on what is spent on road safety infrastructure. In
this objective order to make the most effective investment in road
Result: Reduction in deaths and serious injuries at safety, it is important to continue to increase the
reasonable cost understanding of the factors contributing to road
safety, their effectiveness and their cost so that good
87. While the social costs and numbers of actual deaths choices can be made. GPS 2015 (draft) will enable:
and injuries arising from road crashes has been • a focus on improved reporting of the
falling, it is still a significant cost and New Zealand is effectiveness of safety related road investment
not achieving the level of performance achieved by with a view to improve future allocations
other countries.
88. To increase the benefits of road use to
New Zealanders, it is important to support the road
safety interventions that have the greatest effect
relative to cost. The GPS funds road safety policing,
road safety promotion and investment in safer
roading infrastructure.
ENGAGEMENT DRAFT 17Objective: A land transport system that appropriately mitigates the
effects of land transport on the environment
Description 92. However, improvements can have adverse impacts
on those living closest to the improvements.
90. Land transport can have significant local, national
These local impacts need to be addressed at
and global effects on the environment, including on
reasonable cost in the course of securing Resource
public health and climate change. Improvements
Management Act approvals if the wider benefits of
to the land transport system can reduce existing
increased network capacity and capability are to be
harmful effects as well as mitigate adverse effects of
realised.
increased traffic. The long lived nature of transport
infrastructure means that decisions today can have 93. We also need to get to a position where the total
long term implications for the environment and fuel investment in environmental mitigation is better
use. The effects can be direct or indirect and can understood.
accumulate over time. 94. This GPS 2015 (draft) will support this result
through:
Government’s long term results under
this objective a. Enabling the mitigation of environmental
effects: The scale of the land transport investment
Result: Understand the costs associated with programme will result in a continued substantial
environmental mitigation investment in local mitigation, concentrating on the
most adverse cases.
91. Land transport investment can have positive as well
as negative impacts on the environment. Investment b. Better understanding of the investment in
in motorways or expressways that removes traffic environmental mitigation: A better understanding
from suburban streets can significantly improve of the costs involved in environmental mitigation is
the living environment for many people within the needed to inform future policy work on the types of
transport catchment. Investment that reduces fuel mitigation and the most effective form of mitigation.
use by enabling shorter trips or smoother traffic flow
can reduce the national or global impacts of land
transport.
18 ENGAGEMENT DRAFTSECTION 5: INVESTMENT IN LAND TRANSPORT
95. This section sets out the allocation of funding to 98. The Government will determine the need for the
activity classes, the associated results and Ministerial annual inflation related increases on a case by case
expectations on how the NZ Transport Agency gives basis, annually.
effect to the investment strategy.
99. This revenue is supplemented by contributions
from local government to activities included in the
A. Total funding for GPS 2015 (draft) Programme. Crown funding may also be made
available for specific activities in addition to those
96. To support the achievement of the Government’s directed by this GPS.
results for land transport, funding available for 100. Table 2 below shows the total expenditure target
allocation from the Fund is projected to increase (the expected level of expenditure) along with the
from around $3.4 billion per annum in 2015/16 to maximum and minimum range for the Programme
$4.4 billion per annum by 2024/25. for the first three years of GPS 2015 (draft). The
97. This revenue will predominantly be sourced total level of funding represents a balance between
from fuel excise duties, road user charges, and achieving the Government’s expected results
motor vehicle registration and licensing fees. The (in Section II) and the level of revenue that the
Government expects that it will need to increase Government decides should be raised.
rates of fuel excise duty and road user charges
during the period covered by this GPS by the rate of
inflation. The Government has committed to a 3 cent
per litre increase in fuel excise duty and equivalent
increase in road user charges on 1 July 2015. This
would be followed by potential annual increases
in the order of 1.5 cents per litres, reflecting the
forecast rate of inflation, from 2016/17.
Table 2: National land transport programme funding ranges 2015/16 to 2024/25
15/16 16/17 17/18 18/19 19/20 20/21 21/22 22/23 23/24 24/25
$m $m $m $m $m $m $m $m $m $m
Expenditure 3400 3500 3600 3700 3800 3900 4000 4150 4250 4400
target
Maximum 3650 3750 3850 3950 4050 4200
expenditure
Minimum 2900 3000 3050 3150 3200 3300
expenditure
ENGAGEMENT DRAFT 19B. Activity class framework 104. Under this proposed structure:
• investment in operating the existing road
101. The GPS allocates funding to activity classes which network is consolidated into a single activity
provide a framework for investment from the class each for State highways and local roads. All
Programme. of this investment is directed at keeping roads
102. GPS 2015 (draft) proposes fewer activity classes operating at a standard appropriate to their
compared to GPS 2012. This is intended to provide use and function. Service level improvements
the NZ Transport Agency with additional flexibility previously incorporated in maintenance and
to allocate funds to deliver the best value from renewals are reported separately within new
investment. This will be balanced by additional road investment.
reporting lines for each activity class referred to as • investment in public transport is consolidated
‘focus areas’ (see table 3). into a single activity class, allowing investment
103. The following activity classes are proposed for GPS to be directed to service or infrastructure
2015 (draft): depending on where the best returns can be
secured.
Activity classes • cross cutting functions, like planning, research
and allocation, are consolidated into a new
• State highway improvements investment management activity class,
• State highway maintenance recognising their common role in securing best
• Local road improvements possible value across the entire programme.
• Local road maintenance
105. For each activity class, a funding range is given with
• Public transport
an upper and lower range for expenditure. The
• Walking and cycling improvements
NZ Transport Agency is responsible for allocating
• Regional improvements
funding within these ranges to specific activities.
• Road policing
• Road safety promotion 106. In addition to the activity classes proposed above,
• Investment management five multi-class focus areas have also been created
which relate to investment occurring across multiple
activity classes. This is intended to be a reporting
mechanism to cover expenditure that is embedded
in a range of activity classes. The proposed multi-
class focus areas are:
Multi class focus areas
• Auckland
• Road safety
• Resilience
• Environmental mitigation
• Fuel efficiency
20 ENGAGEMENT DRAFTActivity class table
107. Table 3 presents the proposed activity class structure
for GPS 2015 (draft). It sets out the proposed:
• activity classes
• focus areas for each activity class (for reporting
purposes)
• long term results that map to each activity class
• short to medium term results that map to each
activity class
• reporting metrics for each activity class
• funding ranges for each activity class for
2015/16 – 2017/18
108. The results and reporting metrics of primary
importance to the Strategic Direction proposed in
GPS 2015 (draft) are highlighted in blue italics.
109. Table 3 then sets out the proposed funding ranges
for each activity class for 2015/16 to 2017/18 and
forecast funding ranges for 2018/19 to 2024/25.
ENGAGEMENT DRAFT 21Table 3: ACTIVITY CLASS STRUCTURE: GPS 2015 (draft)
(Primary results and reporting in blue)
Activity Focus Associated short to Bands 2015/16 2016/17 2017/18
Definition Associated long term results Reporting ($m) ($m) ($m)
Class Area medium term results
State highway Existing Investment in existing State highways that improves • Support economic growth and productivity • Deliver major State highway • Change in the proportion of State highways available to high Lower 1,000 1,050 1,100
improvements capacity or service levels (e.g. improvements on an through provision of better access to projects on time and to productivity freight vehicles
Upper 1,400 1,450 1,500
existing road corridor) markets, employment and business areas budget • Change in travel times on key State highways serving our
New Investment in new State highways that improves • Improved network resilience and reliability at • Increased freight vehicle main urban and logistics centres
capacity or service levels (eg improvements on new road the most critical points. productivity across the • Change in the network productivity (speed-flow) of our
corridor) • Reduction in deaths and serious injuries at network growing urban centres, in accordance with Austroads and
reasonable cost • Reduced travel times in key methodology
• Understand the costs associated with corridors leading to our main • Multi class focus areas reporting on resilience, safety and
environmental mitigation urban and logistics centres environmental mitigation
• Increased capacity on main
routes within our growing
urban areas
• Reduce the risks of disruption
at the most critical points
and deal with disruption
efficiently
• Progress the Safer Journeys
Action Plan and improve the
transparency of road safety
related investment
• Improved transparency of
investment in mitigating
adverse environmental
effects, including climate
change
State highway Operate Investment in operation of existing State highway • Support economic growth and productivity • Maintain appropriate levels of • Change in State highway condition and lane kilometre Lower 445 450 455
maintenance capacity or services (eg paying for the power used in through provision of access to markets, service to support economic maintenance cost by road classification
Upper 585 605 620
traffic lights) employment and business areas growth and productivity • Change in State highway maintenance cost per lane
• Improved returns from investment in road • Achieve measureable kilometre expenditure by:
maintenance efficiencies in the cost »» metro regions
• Reduction in deaths and serious injuries at of maintaining the State »» provincial regions
reasonable cost highway network »» rural regions
• A reduction in variability in • Multi class focus area reporting on safety
the maintenance efficiency of
networks
Maintain Investment in the maintenance of existing State highway • Improved transparency
capacity or services, excluding asset upgrades (eg of road safety related
replacing blown bulbs in traffic lights) investment
Renew Investment in renewal of existing State highway capacity
or services, excluding asset upgrades (eg replacing
existing traffic lights)
22 ENGAGEMENT DRAFT ENGAGEMENT DRAFT 23You can also read