Bowes Primary Area Quieter Neighbourhood Scheme, Enfield - Air Quality Assessment
←
→
Page content transcription
If your browser does not render page correctly, please read the page content below
Air Quality Assessment:
Bowes Primary Area
Quieter Neighbourhood
Scheme, Enfield

June 2021
Bowes Primary Area Quieter Neighbourhood Scheme, Enfield Air Quality Assessment

          Document Control

 Client      Enfield Council                                   Principal Contact             Christina Gordon

 Job Number                           J4390

 Report Prepared By:                  Jamie Dennis and Pauline Jezequel

          Document Status and Review Schedule

    Report No.                             Date                               Status                         Reviewed by
 J4390A/1/F3            3 June 2021                                   Final                    Clare Beattie (Associate Director)

This report has been prepared by Air Quality Consultants Ltd on behalf of the Client, taking into account the agreed scope of works.
Unless otherwise agreed, this document and all other Intellectual Property Rights remain the property of Air Quality Consultants Ltd.

In preparing this report, Air Quality Consultants Ltd has exercised all reasonable skill and care, taking into account the objectives and
the agreed scope of works. Air Quality Consultants Ltd does not accept any liability in negligence for any matters arising outside of
the agreed scope of works. The Company operates a formal Quality Management System, which is certified to ISO 9001:2015, and
a formal Environmental Management System, certified to ISO 14001:2015.

When issued in electronic format, Air Quality Consultants Ltd does not accept any responsibility for any unauthorised changes made
by others.

When printed by Air Quality Consultants Ltd, this report will be on Evolve Office, 100% Recycled paper.

                                         Air Quality Consultants Ltd
                           23 Coldharbour Road, Bristol BS6 7JT Tel: 0117 974 1086
                          119 Marylebone Road, London NW1 5PU Tel: 020 3873 4780
                                          aqc@aqconsultants.co.uk

                                  Registered Office: 23 Coldharbour Road, Bristol BS6 7JT
                                        Companies House Registration No: 2814570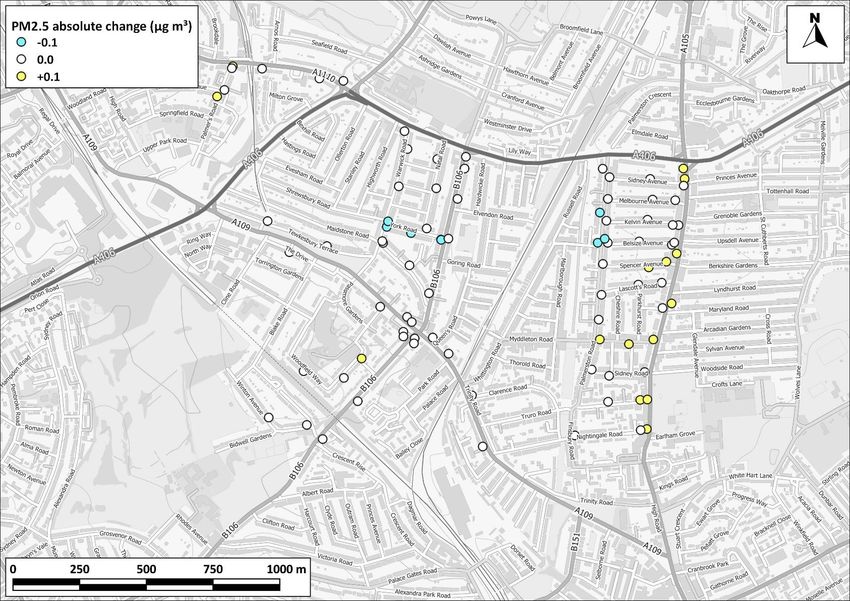
Bowes Primary Area Quieter Neighbourhood Scheme, Enfield Air Quality Assessment

         Contents
         1             Introduction ....................................................................................................... 3
         2             Policy Context and Assessment Criteria ............................................................ 4
         3             Assessment Approach .................................................................................... 12
         4             Baseline Conditions......................................................................................... 21
         5             Scheme Impact Assessment ........................................................................... 28
         6             Summary and Conclusions.............................................................................. 35
         7             References...................................................................................................... 36
         8             Glossary .......................................................................................................... 38
         9             Appendices ..................................................................................................... 40
         A1            London-Specific Policies and Measures .......................................................... 41
         A2            EPUK & IAQM Planning for Air Quality Guidance ............................................ 44
         A3            Professional Experience .................................................................................. 46
         A4            Modelling Methodology ................................................................................... 48
         A5            Modelling Results ............................................................................................ 59

         Tables
         Table 1: Air Quality Criteria for Nitrogen Dioxide, PM10 and PM2.5 ................................. 11
         Table 2: Summary of Annual Mean NO2 Monitoring (2014-2019) (µg/m3)a .................... 23
         Table 3: Number of Hours With NO2 Concentrations Above 200 µg/m3......................... 23
         Table 4: Summary of Annual Mean PM10 Monitoring (2014-2019) (µg/m3) .................... 25
         Table 5: Number of Days With PM10 Concentrations Above 50 µg/m3........................... 25
         Table 6: Estimated Annual Mean Background Pollutant Concentrations in 2019 and
                  2020 (µg/m3) a ................................................................................................. 25

         Table A2.1:         Air Quality Impact Descriptors for Individual Receptors for All Pollutants a 44
         Table A4.1: Summary of Model Inputs .......................................................................... 48
         Table A4.2: Summary of Missing Data in Traffic Counts ............................................... 53
         Table A4.3: Summary of Annualised Traffic Data used in the Assessment (AADT Flows)
                  a
                     54
         Table A5.1: Predicted Impacts on Annual Mean Nitrogen Dioxide Concentrations a ........ 59
         Table A5.2: Predicted Impacts on Annual Mean PM10 Concentrations ............................ 62
         Table A5.3: Predicted Impacts on Annual Mean PM2.5 Concentrations............................ 66

J4390                                                             1 of 72                                                              June 2021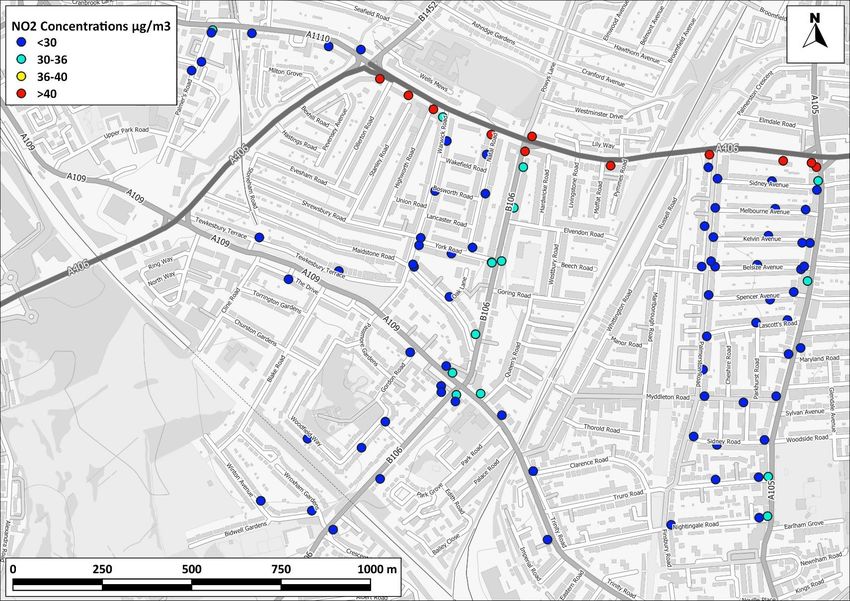
Bowes Primary Area Quieter Neighbourhood Scheme, Enfield Air Quality Assessment

         Figures
         Figure 1: Enfield Quieter Neighbourhood Study Area ..................................................... 12
         Figure 2: Monitored Roads and Extent of Study Area...................................................... 13
         Figure 3: Locations of Automatic Traffic Counts 34 and 39 ............................................. 14
         Figure 4: Receptor Locations ......................................................................................... 18
         Figure 5: Consultation Area, AQMA and Air Quality Focus Areas .................................. 22
         Figure 6: Monitoring Locations ....................................................................................... 24
         Figure 7: Predicted Annual Mean NO2 Concentrations in the Study Area in the 2019
                   Baseline Scenario (µg/m3) ............................................................................... 27
         Figure 8: Percentage Change in Annualised Total Traffic Flows Resulting from the
                   Scheme ........................................................................................................... 31
         Figure 9: Predicted Changes in Annual Mean NO2 Concentrations with Quieter
                   Neighbourhood Scheme in 2020 (µg/m3)......................................................... 32
         Figure 10: Predicted Changes in Annual Mean PM10 Concentrations with Quieter
                   Neighbourhood Scheme in 2020(µg/m3).......................................................... 33
         Figure 11: Predicted Changes in Annual Mean PM2.5 Concentrations with Quieter
                   Neighbourhood Scheme in 2020(µg/m3).......................................................... 34

         Figure A4.1: Average Time Varying Emission Factors for ATC1 (Palmer’s Road) and
                   ATC5 (Natal Road), with and without the Quieter Neighbourhood Scheme. .... 51
         Figure A4.2: Average Time Varying Emission Factors for ATC34 (North Circular), with
                   and without the Quieter Neighbourhood Scheme ............................................ 52
         Figure A4.3: Modelled Road Network & Average Speed............................................... 55
         Figure A4.4: Comparison of Measured Road NOx to Unadjusted Modelled Road NOx
                   Concentrations. The dashed lines show ± 25%. ............................................. 57
         Figure A4.5: Comparison of Measured Total NO2 to Final Adjusted Modelled Total NO2
                   Concentrations. The dashed lines show ± 25%. ............................................. 57
         Figure A5.1: Modelled Receptors with Labels - East..................................................... 70
         Figure A5.2: Modelled Receptors with Labels - West .................................................... 71
         Figure A5.3: Modelled Receptors with Labels – North Circular ..................................... 72

J4390                                                            2 of 72                                                           June 2021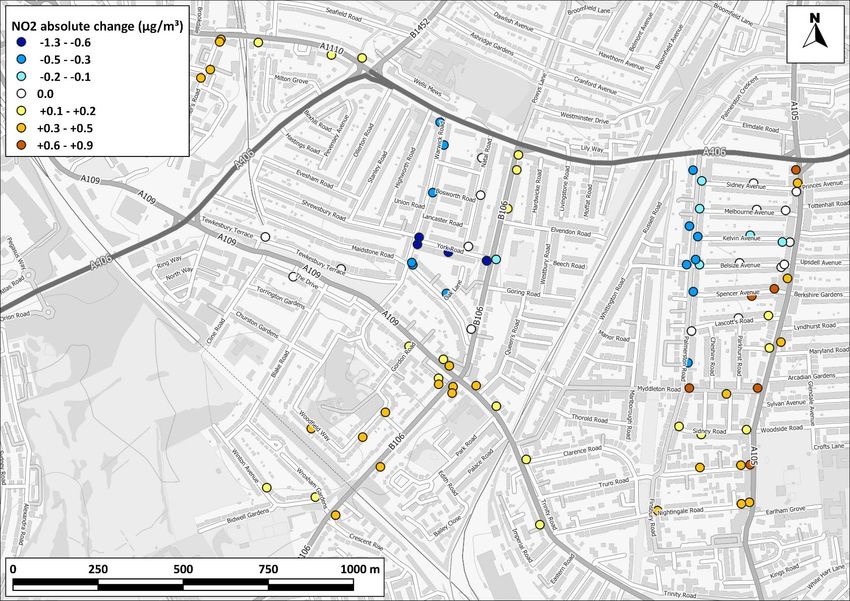
Bowes Primary Area Quieter Neighbourhood Scheme, Enfield Air Quality Assessment

1          Introduction
1.1        This report describes the potential air quality impacts associated with the Quieter Neighbourhood
           Scheme in Enfield. The assessment has been carried out by Air Quality Consultants Ltd on behalf
           of London Borough of Enfield (LB Enfield). This air quality assessment has been undertaken in
           conjunction with a noise assessment undertaken by AQC’s sister company Noise Consultants Ltd.

1.2        The scheme was introduced in 2020 and, in alignment with the Mayor’s Transport Strategy 2018
           (GLA, 2018a), aims to reduce neighbourhood motor traffic, where “through motor vehicle traffic is
           discouraged or removed”1.

1.3        The assessment has been conducted using traffic data provided by LB Enfield, consisting of raw
           measured traffic flows over two seven-day periods in July and November 2020 (pre- and post-
           scheme implementation). This has been used to calculate the changes in traffic attributable to the
           scheme, and to estimate associated impacts on local air quality. The traffic data were processed into
           the appropriate format for air quality modelling through adjustments to represent an annual mean.
           Uncertainties associated with this process, as well as with other parameters that would have
           influenced measured traffic data (i.e. school holidays, the COVID pandemic), have, to some extent,
           been taken into account within the assessment and conclusions, as further discussed in this report.

1.4        This report describes existing local air quality conditions (base year 2019), and the predicted
           changes in pollutant concentrations at sensitive receptors with the scheme in place (assessment
           year 2020). The assessment focuses on nitrogen dioxide, PM10 and PM2.5 as the main pollutants of
           concern.

1.5        The predicted annual mean pollutant concentrations at selected receptors, with and without the
           scheme in place in 2020, and associated impacts, are also described in full in Appendix A5.

1.6        This report has been prepared taking into account all relevant local and national guidance and
           regulations.

1     Further information about the Quieter Neighbourhoods scheme can be found at:
      https://new.enfield.gov.uk/services/improving-enfield/quieter-neighbourhoods/

J4390                                                      3 of 72                                          June 2021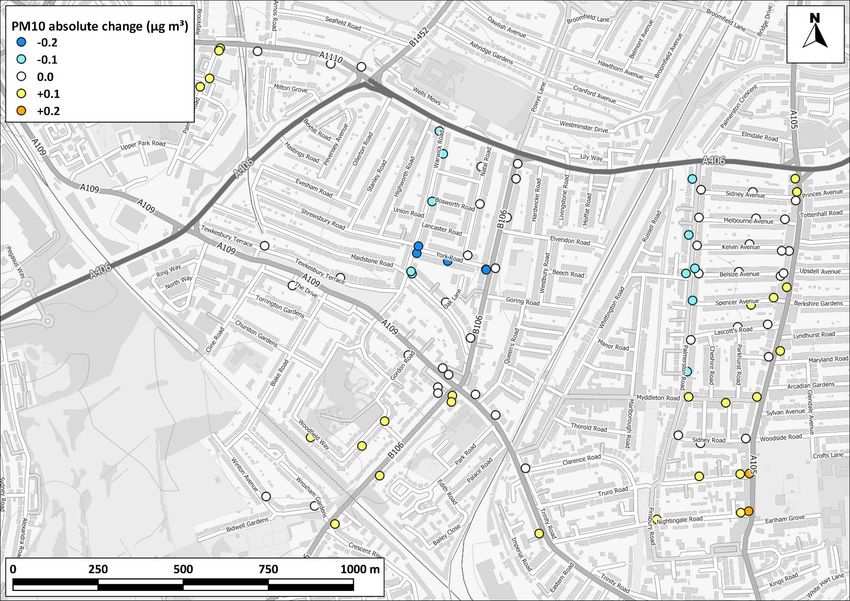
Bowes Primary Area Quieter Neighbourhood Scheme, Enfield Air Quality Assessment

2        Policy Context and Assessment Criteria
2.1      All European legislation referred to in this report is written into UK law and will remains in place,
         although there is uncertainty at this point in time as to who will enforce the requirements of some of
         this legislation.

         Air Quality Strategy

2.2      The Air Quality Strategy (Defra, 2007) published by the Department for Environment, Food, and
         Rural Affairs (Defra) and Devolved Administrations, provides the policy framework for air quality
         management and assessment in the UK. It provides air quality standards and objectives for key air
         pollutants, which are designed to protect human health and the environment. It also sets out how
         the different sectors: industry, transport and local government, can contribute to achieving the air
         quality objectives. Local authorities are seen to play a particularly important role. The strategy
         describes the Local Air Quality Management (LAQM) regime that has been established, whereby
         every authority has to carry out regular reviews and assessments of air quality in its area to identify
         whether the objectives have been, or will be, achieved at relevant locations, by the applicable date.
         If this is not the case, the authority must declare an Air Quality Management Area (AQMA), and
         prepare an action plan which identifies appropriate measures that will be introduced in pursuit of the
         objectives.

         Clean Air Strategy 2019

2.3      The Clean Air Strategy (Defra, 2019) sets out a wide range of actions by which the UK Government
         will seek to reduce pollutant emissions and improve air quality. Actions are targeted at four main
         sources of emissions: Transport, Domestic, Farming and Industry.           At this stage, there is no
         straightforward way to take account of the expected future benefits to air quality within this
         assessment.

         Reducing Emissions from Road Transport: Road to Zero Strategy

2.4      The Office for Low Emission Vehicles (OLEV) and Department for Transport (DfT) published a Policy
         Paper (DfT, 2018) in July 2018 outlining how the government will support the transition to zero
         tailpipe emission road transport and reduce tailpipe emissions from conventional vehicles during the
         transition. This paper affirms the Government’s pledge to end the sale of new conventional petrol
         and diesel cars and vans by 2040, and states that the Government expects the majority of new cars
         and vans sold to be 100% zero tailpipe emission and all new cars and vans to have significant zero
         tailpipe emission capability by this year, and that by 2050 almost every car and van should have
         zero tailpipe emissions. It states that the Government wants to see at least 50%, and as many as
         70%, of new car sales, and up to 40% of new van sales, being ultra-low emission by 2030.

J4390                                                      4 of 72                                          June 2021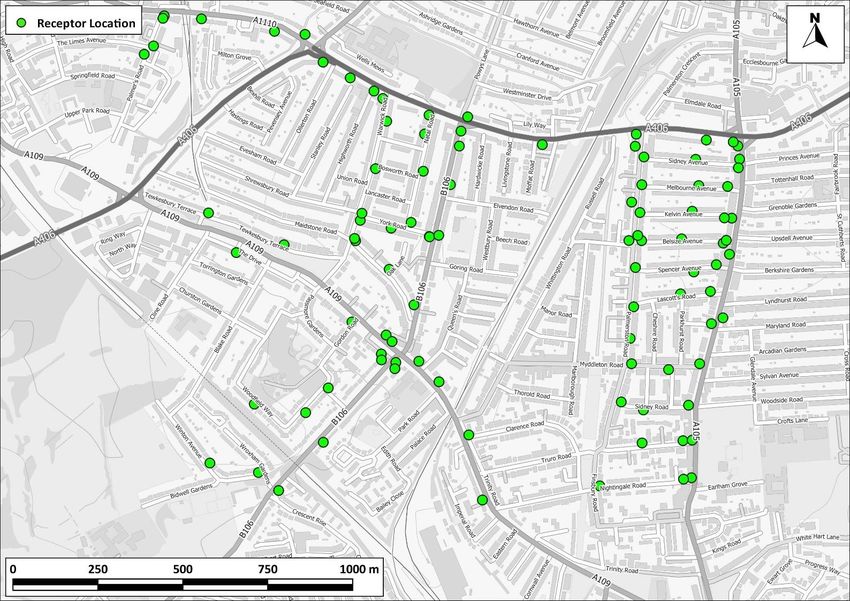
Bowes Primary Area Quieter Neighbourhood Scheme, Enfield Air Quality Assessment

2.5      The paper sets out a number of measures by which Government will support this transition, but is
         clear that Government expects this transition to be industry and consumer led. The Government
         has since announced that the phase-out date for the sale of new petrol and diesel cars and vans will
         be brought forward to 2030 and that all new cars and vans must be fully zero emission at the tailpipe
         from 2035. If these ambitions are realised then road traffic-related NOx emissions can be expected
         to reduce significantly over the coming decades, likely beyond the scale of reductions forecast in the
         tools utilised in carrying out this air quality assessment.

         Planning Policy

         National Policies

2.6      The National Planning Policy Framework (NPPF) (2019a) sets out planning policy for England. It
         states that the purpose of the planning system is to contribute to the achievement of sustainable
         development, and that the planning system has three overarching objectives, one of which
         (Paragraph 8c) is an environmental objective:

         “to contribute to protecting and enhancing our natural, built and historic environment; including
         making effective use of land, helping to improve biodiversity, using natural resources prudently,
         minimising waste and pollution, and mitigating and adapting to climate change, including moving to
         a low carbon economy”.

2.7      To prevent unacceptable risks from air pollution, Paragraph 170 of the NPPF states that:

         “Planning policies and decisions should contribute to and enhance the natural and local environment
         by…preventing new and existing development from contributing to, being put at unacceptable risk
         from, or being adversely affected by unacceptable levels of soil, air, water or noise pollution or land
         instability. Development should, wherever possible, help to improve local environmental conditions
         such as air quality”.

2.8      Paragraph 180 states:

         “Planning policies and decisions should also ensure that new development is appropriate for its
         location taking into account the likely effects (including cumulative effects) of pollution on health,
         living conditions and the natural environment, as well as the potential sensitivity of the site or the
         wider area to impacts that could arise from the development”.

2.9      More specifically on air quality, Paragraph 180 makes clear that:

         “Planning policies and decisions should sustain and contribute towards compliance with relevant limit
         values or national objectives for pollutants, taking into account the presence of Air Quality
         Management Areas and Clean Air Zones, and the cumulative impacts from individual sites in local
         areas. Opportunities to improve air quality or mitigate impacts should be identified, such as through
         traffic and travel management, and green infrastructure provision and enhancement. So far as

J4390                                                      5 of 72                                          June 2021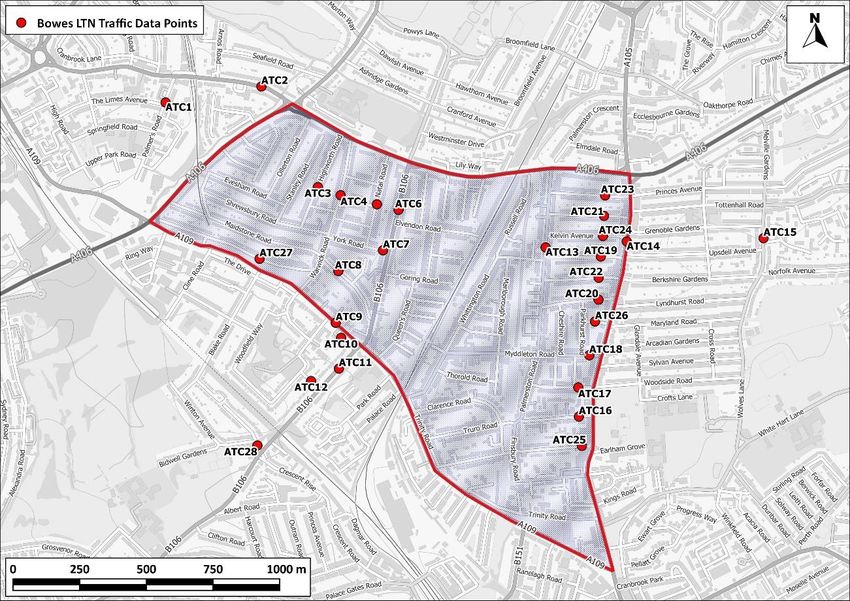
Bowes Primary Area Quieter Neighbourhood Scheme, Enfield Air Quality Assessment

         possible these opportunities should be considered at the plan-making stage, to ensure a strategic
         approach and limit the need for issues to be reconsidered when determining individual applications.
         Planning decisions should ensure that any new development in Air Quality Management Areas and
         Clean Air Zones is consistent with the local air quality action plan”.

2.10     The NPPF is supported by Planning Practice Guidance (PPG) (Ministry of Housing, Communities &
         Local Government, 2019b), which includes guiding principles on how planning can take account of
         the impacts of new development on air quality. The PPG states that:

         “Defra carries out an annual national assessment of air quality using modelling and monitoring to
         determine compliance with Limit Values. It is important that the potential impact of new development
         on air quality is taken into account where the national assessment indicates that relevant limits have
         been exceeded or are near the limit, or where the need for emissions reductions has been identified”.

2.11     Regarding plan-making, the PPG states:

         “It is important to take into account air quality management areas, Clean Air Zones and other areas
         including sensitive habitats or designated sites of importance for biodiversity where there could be
         specific requirements or limitations on new development because of air quality”.

2.12     The role of the local authorities through the LAQM regime is covered, with the PPG stating that a
         local authority Air Quality Action Plan “identifies measures that will be introduced in pursuit of the
         objectives and can have implications for planning”.

         London-Specific Policies

2.13     The key London-specific policies are summarised below, with more detail provided, where required,
         in Appendix A1.

         The London Plan

2.14     The London Plan (GLA, 2021) sets out an integrated economic, environmental, transport and social
         framework for the development of London over the next 20-25 years. The key policy relating to air
         quality is Policy SI1 on Improving air quality, Part B1 of which sets out key requirements for
         developments, including:

         An air quality positive approach is linked to other policies in the London Plan, such as Healthy
         Streets, energy masterplanning and green infrastructure.

2.15     Policy D8 Public Realm recognises that:

         The specific balance between the different functions of any one space, such as its place-based
         activities, its function to facilitate movement and its ability to accommodate different uses of the
         kerbside, should be at the heart of how the space is designed and managed. The Mayor’s Healthy

J4390                                                      6 of 72                                         June 2021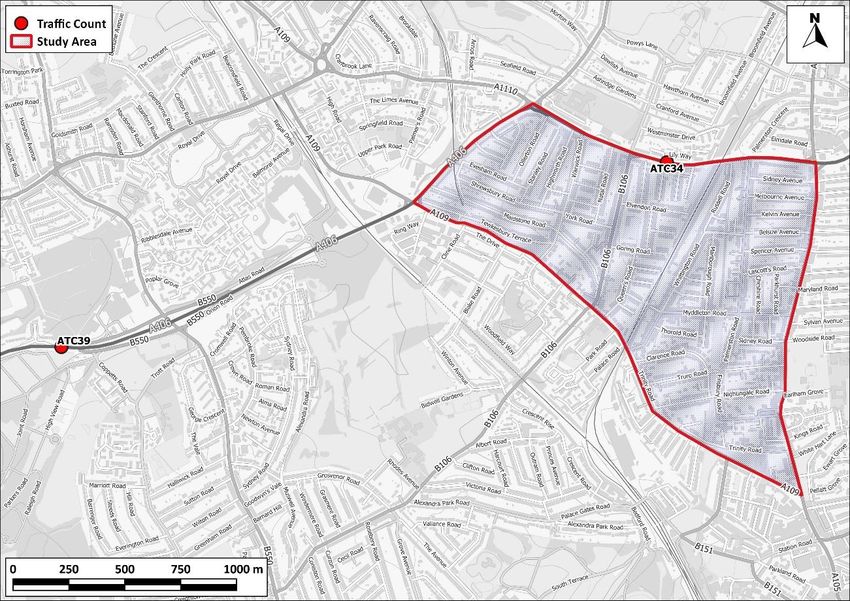
Bowes Primary Area Quieter Neighbourhood Scheme, Enfield Air Quality Assessment
Streets Approach explains how the design and management of streets can support a wide range of
activities in the public realm as well as encourage and facilitate a shift to active travel.
2.16 Healthy Streets also has its own policy, T2, which states that:
A Development proposals and Development Plans should deliver patterns of land use that facilitate
residents making shorter, regular trips by walking or cycling.
B Development Plans should: 1) promote and demonstrate the application of the Mayor’s Healthy
Streets Approach to: improve health and reduce health inequalities; reduce car dominance,
ownership and use, road danger, severance, vehicle emissions and noise; increase walking, cycling
and public transport use; improve street safety, comfort, convenience and amenity; and support
these outcomes through sensitively designed freight facilities. 2) identify opportunities to improve the
balance of space given to people to dwell, walk, cycle, and travel on public transport and in essential
vehicles, so space is used more efficiently and streets are greener and more pleasant.
London Environment Strategy
2.17 The London Environment Strategy was published in May 2018 (GLA, 2018b). The strategy
considers air quality in Chapter 4; the Mayor’s main objective is to create a “zero emission London
by 2050”. Policy 4.2.1 aims to “reduce emissions from London’s road transport network by phasing
out fossil fuelled vehicles, prioritising action on diesel, and enabling Londoners to switch to more
sustainable forms of transport”. An implementation plan for the strategy has also been published
which sets out what the Mayor will do between 2018 and 2023 to help achieve the ambitions in the
strategy.
Mayor’s Transport Strategy
2.18 The Mayor’s Transport Strategy (GLA, 2018a) sets out the Mayor’s policies and proposals to reshape
transport in London over the next two decades. The Strategy focuses on reducing car dependency
and increasing active sustainable travel, with the aim of improving air quality and creating healthier
streets. It notes that development proposals should “be designed so that walking and cycling are
the most appealing choices for getting around locally”.
Air Quality Focus Areas
2.19 The GLA has identified 183 air quality Focus Areas in London as part of the 2016 update to the
London Atmospheric Emissions Inventory (LAEI). These are locations that not only exceed the EU
annual mean limit value for nitrogen dioxide, but also have high levels of human exposure. They do
not represent an exhaustive list of London’s air quality hotspot locations, but locations where the
GLA believes the problem to be most acute. They are also areas where the GLA considers there to
be the most potential for air quality improvements and are, therefore, where the GLA and Transport
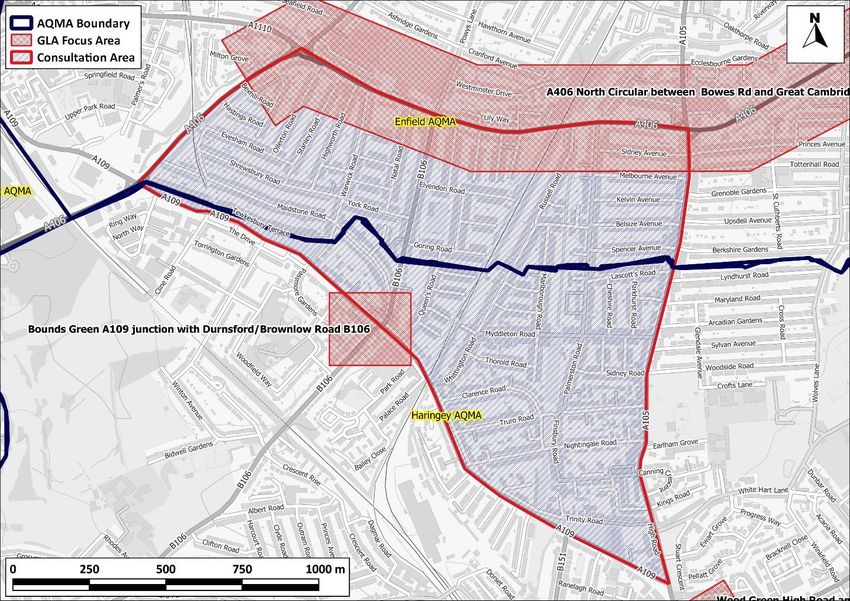
for London (TfL) will focus actions to improve air quality. The ‘A406 North Circular between Bowes
J4390 7 of 72 June 2021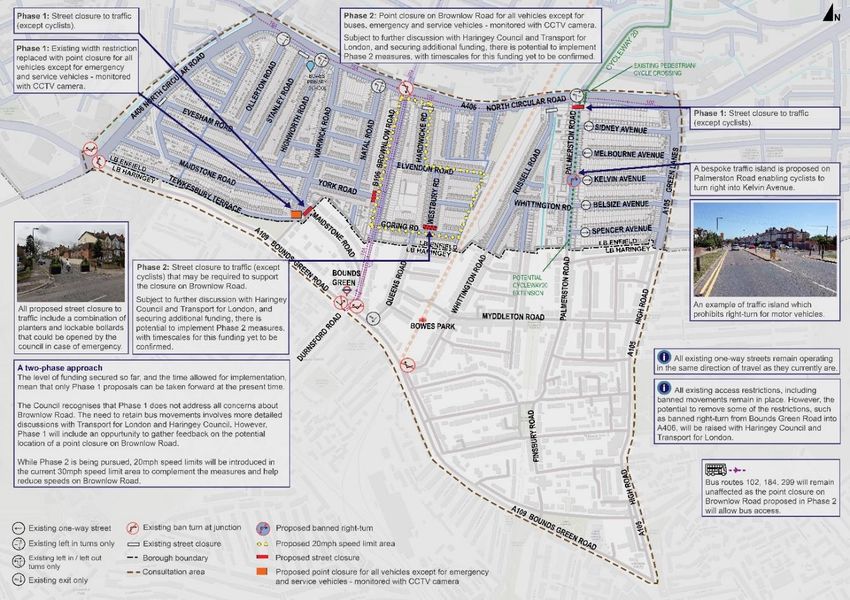
Bowes Primary Area Quieter Neighbourhood Scheme, Enfield Air Quality Assessment

         Road and Great Cambridge’ and ‘Bound Green A109 junction with Durnsford/Brownlow Road B106’
         Air Quality Focus Areas are situated within the study area, as shown on Figure 5.

         Local Transport Plan

2.20     LB Enfield has published their Transport Plan in 2019 (LB Enfield , 2019). It sets out how the Council
         will improve travel to, from and within the Borough, and forms the basis of the Council’s third Local
         Implementation Plan.       Objective O3 of the Plan is to “monitor air quality and develop and deliver
         interventions which address local issues”. Objective O7 is to “maintain and improve the transport
         network in Enfield including developing potential interventions.” with a view to “provide an enhanced
         transport network and significantly enhanced streetscape environments with associated
         environmental (air quality and emission) benefits as well as health benefits.”. A series of actions
         have been defined under each of these objectives, including:

         •   “Work with TfL to develop plans for appropriate emergency measures to be undertaken to
             reduce or restrict vehicle use when forecast or actual periods of very high air pollution occur,
             for example, to tackle non-essential vehicle use or engine idling;

         •   Reliable and resilient charging infrastructure to support uptake of electric vehicles with a focus
             on rapid and fast charging points in strategic locations;

         •   Reducing traffic volumes by encouraging mode shift from travelling by car to walking, cycling
             and public transport;

         •   Continue to make the pedestrian environment more accessible to people with buggies,
             pushchairs and those using wheelchairs; and

         •   Provide a low speed environment”.

         Local Policies

2.21     The Core Strategy (LB Enfield, 2010) was adopted in November 2010, and within this there is one
         policy which refer to air quality. Core policy 32 refers to pollution and states that LB Enfield:

         “…will work with its partners to minimise air, water, noise and light […]. In particular, new
         development will be required to improve air quality by reducing pollutant emissions and public
         exposure to pollution, particularly in areas identified as having poor air quality in the Air Quality Action
         Plan. Criteria for assessing applications will be set out in the Development Management Document.
         The area action plans, particularly the North Circular Area Action Plan, will consider how pollution
         can be reduced or successfully mitigated against at a local level…”

2.22     LB Enfield is currently working on their new Local Plan. A consultation document (LB Enfield, 2018)
         was published in December 2018. The draft policy approach SI2 on health and wellbeing states that
         “The Council will promote healthy lifestyles, reduce health inequalities and create healthier
         neighbourhoods. We will support efforts to promote healthy lifestyles and reduce health inequalities,

J4390                                                      8 of 72                                              June 2021
Bowes Primary Area Quieter Neighbourhood Scheme, Enfield Air Quality Assessment
by recognising the role of planning in doing so through the creation of healthy neighbourhoods and
places. We will expect development proposals to respond to the following contributors to health and
wellbeing: […]
• The need to improve Enfield’s air quality, reduce exposure to airborne pollutants, having
regard to national and international obligations[…]”
2.23 Draft policy T2 on ‘Reducing the impact of private vehicles on our street’ states that “The Council will
secure a more sustainable local travel network that maximises opportunities for walking, cycling and
using public transport, reduces congestion, improves public realm and improves health and well-
being. We will achieve this by using the Healthy Streets approach to improve poor air quality and
tackle climate change by reducing the reliance of private motor vehicles, easing levels of traffic and
congestion and providing infrastructure to support alternative sustainable modes of transport to
provide access to employment, schools and services[…]”
2.24 The “Healthy Street” approach is described as “an evidence-based approach to improve health and
reduce health inequalities, which will help Londoners use cars less, and walk, cycle and use public
transport more. It supports the delivery of the Mayor’s aim that by 2041 all Londoners will be able to
undertake at least the 20 minutes of active travel each day needed to stay healthy. It also requires
better management of freight so the impact of moving goods, carrying out servicing and supporting
construction on London’s streets is lessened. To apply the Healthy Streets Approach, changes are
required at strategic, network and street level.”
Air Quality Action Plans
National Air Quality Plan
2.25 Defra has produced an Air Quality Plan to tackle roadside nitrogen dioxide concentrations in the UK
(Defra, 2017); a supplement to the 2017 Plan (Defra, 2018a) was published in October 2018 and
sets out the steps Government is taking in relation to a further 33 local authorities where shorter-
term exceedances of the limit value were identified. Alongside a package of national measures, the
2017 Plan and the 2018 Supplement require those identified English Local Authorities (or the GLA
in the case of London Authorities) to produce local action plans and/or feasibility studies. These
plans and feasibility studies must have regard to measures to achieve the statutory limit values within
the shortest possible time, which may include the implementation of a CAZ. There is currently no
straightforward way to take account of the effects of the 2017 Plan or 2018 Supplement in the
modelling undertaken for this assessment; however, consideration has been given to whether there
is currently, or is likely to be in the future, a limit value exceedance in the study area. This
assessment has principally been carried out in relation to the air quality objectives, rather than the
EU limit values that are the focus of the Air Quality Plan.
J4390 9 of 72 June 2021Bowes Primary Area Quieter Neighbourhood Scheme, Enfield Air Quality Assessment
Local Air Quality Action Plan
2.26 The LB Enfield Air Quality Action Plan (LB Enfield, n/a) sets out a series of measures by which they
will seek to achieve the air quality objectives in their AQMA. A series of measures concern transport,
including Action 6 to “Work with TfL to improve strategic roads, particularly the A406 North Circular”
and Action 15 which targets the development of “a high-quality network of ‘Greenway’ cycle and
walking routes using parks, open spaces, quiet traffic routes, and 20mph zones.” The Air Quality
Action Plan is currently being reviewed and updated.
Assessment Criteria
2.27 The Government has established a set of air quality standards and objectives to protect human
health. The ‘standards’ are set as concentrations below which effects are unlikely even in sensitive
population groups, or below which risks to public health would be exceedingly small. They are based
purely upon the scientific and medical evidence of the effects of an individual pollutant. The
‘objectives’ set out the extent to which the Government expects the standards to be achieved by a
certain date. They take account of economic efficiency, practicability, technical feasibility and
timescale. The objectives for use by local authorities are prescribed within the Air Quality (England)
Regulations (2000) and the Air Quality (England) (Amendment) Regulations (2002).
2.28 The UK-wide objectives for nitrogen dioxide and PM10 were to have been achieved by 2005 and
2004 respectively, and continue to apply in all future years thereafter. The PM 2.5 objective was to
be achieved by 2020. Measurements across the UK have shown that the 1-hour nitrogen dioxide
objective is unlikely to be exceeded at roadside locations where the annual mean concentration is
below 60 µg/m3 (Defra, 2018b). Therefore, 1-hour nitrogen dioxide concentrations will only be
considered if the annual mean concentration is above this level.
2.29 The objectives apply at locations where members of the public are likely to be regularly present and
are likely to be exposed over the averaging period of the objective. Defra explains where these
objectives will apply in its Local Air Quality Management Technical Guidance (Defra, 2018b). The
annual mean objectives for nitrogen dioxide and PM10 are considered to apply at the façades of
residential properties, schools, hospitals etc.; they do not apply at hotels. The 24-hour mean
objective for PM10 is considered to apply at the same locations as the annual mean objective, as well
as in gardens of residential properties and at hotels. The 1-hour mean objective for nitrogen dioxide
applies wherever members of the public might regularly spend 1-hour or more, including outdoor
eating locations and pavements of busy shopping streets.
2.30 EU Directive 2008/50/EC (The European Parliament and the Council of the European Union, 2008)
sets limit values for nitrogen dioxide, PM10 and PM2.5, and is implemented in UK law through the Air
Quality Standards Regulations (2010). The limit values for nitrogen dioxide are the same numerical
concentrations as the UK objectives, but achievement of these values is a national obligation rather
than a local one. In the UK, only monitoring and modelling carried out by UK Central Government
J4390 10 of 72 June 2021Bowes Primary Area Quieter Neighbourhood Scheme, Enfield Air Quality Assessment
meets the specification required to assess compliance with the limit values. Central Government
does not normally recognise local authority monitoring or local modelling studies when determining
the likelihood of the limit values being exceeded, unless such studies have been audited and
approved by Defra and DfT’s Joint Air Quality Unit (JAQU).
2.31 The relevant air quality criteria for this assessment are provided in Table 1.
Table 1: Air Quality Criteria for Nitrogen Dioxide, PM10 and PM2.5
Pollutant Time Period Objective
1-hour Mean 200 µg/m3 not to be exceeded more than 18 times a year
Nitrogen Dioxide
Annual Mean 40 µg/m3
24-hour Mean 50 µg/m3 not to be exceeded more than 35 times a year
Fine Particles (PM10)
Annual Mean 40 µg/m3 a
Fine Particles (PM2.5) b Annual Mean 25 µg/m3
a A proxy value of 32 µg/m3 as an annual mean is used in this assessment to assess the likelihood of the
24-hour mean PM10 objective being exceeded. Measurements have shown that, above this
concentration, exceedances of the 24-hour mean PM10 objective are possible (Defra, 2018b).
b The PM2.5 objective, which was to be met by 2020, is not in Regulations and there is no requirement for
local authorities to meet it.
Descriptors for Air Quality Impacts and Assessment of Significance
2.32 There is no official guidance in the UK in relation to development control on how to describe air
quality impacts, nor how to assess their significance. The approach developed jointly by
Environmental Protection UK (EPUK) and the Institute of Air Quality Management (IAQM)2
(Moorcroft and Barrowcliffe et al, 2017) has therefore been used. This includes defining descriptors
of the impacts at individual receptors, which take account of the percentage change in concentrations
relative to the relevant air quality objective, rounded to the nearest whole number, and the absolute
concentration relative to the objective. The overall significance of the air quality impacts is
determined using professional judgement, taking account of the impact descriptors. Full details of
the EPUK/IAQM approach are provided in Appendix A2. The approach includes elements of
professional judgement, and the experience of the consultants preparing the report is set out in
Appendix A3.
2 The IAQM is the professional body for air quality practitioners in the UK.
J4390 11 of 72 June 2021Bowes Primary Area Quieter Neighbourhood Scheme, Enfield Air Quality Assessment
3 Assessment Approach
Proposed Scheme
3.1 Residents in the Bowes Primary & Surrounding Streets Quieter Neighbourhood Area have raised
concerns with Enfield Council over traffic issues in the area for many years. In 2019 the Council
engaged residents in the Bowes Primary & Surrounding Streets Quieter Neighbourhood Area
through a Perception Survey to better understand the issues that they were experiencing. In
response, LB Enfield has implemented a scheme which aims to moderate the speed and volume of
traffic and remove through traffic on primary roads within the project area. To that effect, a series of
measures have been proposed to divert through traffic from these minor roads onto ‘key distributor
roads’.
3.2 The scheme will be delivered in phases, as shown on Figure 1 below.
Figure 1: Enfield Quieter Neighbourhood Study Area
3.3 Phase 1 of the scheme started in 2020, with the road closures to motor vehicles at the following
locations:
• Maidstone Road at its junction with Warwick Road
• York Road at its junction with Brownlow Road
J4390 12 of 72 June 2021Bowes Primary Area Quieter Neighbourhood Scheme, Enfield Air Quality Assessment
• Palmerston Road northbound at its junction with the A406 North Circular Road
• Existing width restriction on Warwick Road, near its junction with Maidstone Road, replaced
with point closure for all vehicles except for emergency vehicles and service vehicles
3.4 In order to monitor the scheme’s impact on vehicle flows, traffic counts were commissioned by LB
Enfield for one week prior to the scheme being implemented (in July 2020), and one week after
implementation of the scheme (in November 2020). The monitored roads and consultation area are
shown in Figure 2 below. In addition, Automatic Traffic Counts (ATCs) 34 and 39 located on the
North Circular Road, and operated by Transport for London (TfL), were also used to supplement LB
Enfield data (ATC34) and in processing the traffic data measured by the ATCs commissioned by LB
Enfield (ATC39). The location of these two ATCs is displayed in Figure 3.
Figure 2: Monitored Roads and Extent of Study Area
Contains Ordnance Survey data © Crown copyright and database right 2021. Ordnance Survey licence
number 100046099. Additional data sourced from third parties, including public sector information licenced
under the Open Government Licence v1.0.
J4390 13 of 72 June 2021Bowes Primary Area Quieter Neighbourhood Scheme, Enfield Air Quality Assessment
Figure 3: Locations of Automatic Traffic Counts 34 and 39
Contains Ordnance Survey data © Crown copyright and database right 2021. Ordnance Survey licence
number 100046099. Additional data sourced from third parties, including public sector information licenced
under the Open Government Licence v1.0.
3.5 The re-distribution of traffic on local roads associated with the scheme may affect air pollutant
concentrations that local residents and users are exposed to. The impacts of the proposed schemes
on air quality have thus been assessed using detailed dispersion modelling and traffic data obtained
by the commissioned survey prior to and after the implementation of the scheme.
Assessment Scenarios
3.6 Nitrogen dioxide, PM10 and PM2.5 concentrations have been predicted for a base year (2019) and
with and without the scheme operating in 2020.
Modelling Methodology
3.7 Concentrations have been predicted using the ADMS-Roads dispersion model. Details of the model
inputs, assumptions and the verification are provided in Appendix A4. Where assumptions have
been made, a realistic worst-case approach has been adopted.
J4390 14 of 72 June 2021Bowes Primary Area Quieter Neighbourhood Scheme, Enfield Air Quality Assessment
Traffic Data and Emissions Calculation
3.8 Traffic data for the assessment have been informed by 26 traffic counts provided by LB Enfield3, and
supplemented by data collected by TfL at two traffic counts (ATC 34 and ATC39, both situated on
the North Circular Road). The dispersion model used to predict annual mean pollutant concentrations
throughout the study area uses traffic and meteorological data that are defined for a given calendar
year, in order that the outputs can be compared to the air quality objectives, which in the case of this
study are expressed as annual means. It has therefore been necessary to process the raw traffic
data collected over 7 days into Annual Average Daily Traffic (AADT) flows; the format required for
input into the dispersion model. The annualisation process addresses the seasonal variations in
traffic, and how this could have impacted the recorded number of vehicles over the two seven-days
traffic counts undertaken by LB Enfield. In this instance, the traffic flows in July would have been
affected by Covid restrictions and school holidays (schools were only open to certain year groups in
July and many would have already started school holidays), whilst the counts undertaken in
November would have been impacted by Covid restrictions (the second lockdown), thus both sets
of data have recorded lower levels of traffic compared to those normally experienced for these times
of the year. If the daily traffic flows had been calculated simply by dividing the traffic recorded over
seven days by seven, the numbers obtained would not have been representative of an average over
2020 and would have instead reflected the conditions during the seven days in July and November.
Annualising the 7-days of data for July and November to the year 2020 has ‘evened out’ the data
and thus addressed any seasonal variation or impact of lockdown between the two sets of data,
allowing for the comparison between the predicted ‘without scheme’ and ‘with scheme’ pollutant
concentrations.
3.9 AADT flows were calculated for each of the 26 traffic counts for the 2019 baseline, 2020 without
scheme and 2020 with scheme scenarios by annualising measured data to the year of interest 4. For
the 2019 baseline and 2020 without scheme scenarios, the raw data collected in July 2020 was
used, whilst data collected in November 2020 was used for the 2020 with scheme scenario. Three
annualisation factors were calculated using data from ATC 39 operated by TfL; one for each scenario
considered. ATC 39 was selected as it is not located within the study area and traffic flows measured
at that location are not affected by the scheme. It is therefore a ‘reference’ traffic count, suitable for
the annualisation process. To provide an example, in order to annualise the 7 days of data collected
at LB Enfield’s ATC1 in July 2020 to the year 2019 (to obtain the 2019 baseline AADT data), the
number of vehicles counted at ATC 39 over the same seven days in July were compared against
the total number of vehicles counted at ATC39 in 2019, to obtain an adjustment factor (traffic over 7
3Two additional traffic counts were deployed for the traffic monitoring survey, but were omitted from the
assessment due to low data capture (ATC 3 and ATC15).
4For 2020, flows were ‘annualised’ to the period 1st January 2020 to 24th November 2020, in the absence of traffic
data covering the period 25th November to 31st December 2020.
J4390 15 of 72 June 2021Bowes Primary Area Quieter Neighbourhood Scheme, Enfield Air Quality Assessment
days / traffic for the calendar year). This factor was then applied to the number of vehicles counted
at ATC1 over the seven days in July 2020 to obtain an estimated total number of vehicles for the
year 2019 on that road. The AADT is then obtained by dividing that number by 365 (i.e. the number
of days in a year). This process is referred to as ‘annualisation’ of the traffic data and allows
estimating an average daily number of vehicles over a calendar year, from a smaller set of data. This
process was repeated for each of the 26 ATCs forming part of the study, and for the three scenarios
considered (2019 baseline, 2020 without scheme and 2020 with scheme).
3.10 Because of the absence of any baseline traffic data representative of a ‘typical’ year for the minor
roads within the study area, the traffic data were annualised using ATC39, as described above,
which is situated on a road with higher traffic flows. For the 2019 baseline flows, this adjustment
used 2019 flows at ATC39, hence, as far as possible, providing baseline traffic data for a ‘typical’
year. When comparing the impacts of the scheme, which was undertaken using 2020 emissions, in
order not to overestimate the impacts of the scheme, a factor to adjust the ‘before’ and ‘after’ traffic
data was derived based on 2020 flows. However, as can be seen in Table A2.1 in Appendix A2, the
impact descriptors are determined based on the predicted change in pollutant concentration
(columns) in the context of the total pollutant concentration at that location (rows). For example, a
predicted change in concentration corresponding to 1% of the objective value would be described
as a ‘negligible’ impact if the total concentration was below 95% of the objective value, but would be
described as ‘slight’ or ‘moderate’ with a total concentration corresponding to 95% or more of the
objective value. In order to avoid underestimating the impacts associated with the scheme by using
a baseline which is unusually low, a sensitivity test was undertaken whereby the predicted changes
in concentrations as a result of the scheme were considered against 2019 total pollutant
concentrations. These two approaches, ie the annualisation of traffic data, and the sensitivity test,
have, as far as possible, addressed the impact of COVID restrictions within this study.
3.11 The ATCs provided data on totals at each hour of the week, with vehicle speeds and fleet
composition. The measured distribution of traffic throughout the day (‘profiles’) were used within the
dispersion model.
3.12 Vehicle emissions have been derived using Defra’s Emission Factor Toolkit (EFT) (v10.1) (Defra,
2021). Further details about model input, traffic data and how AADT flows have been derived are
presented in Appendix A4.
Sensitive Locations
3.13 Concentrations of nitrogen dioxide, PM10 and PM2.5 have been predicted at a number of receptors
(i.e. residential properties) within and in close proximity to the study area. Receptors have been
identified to represent a range of exposure, including the worst-case locations (these being at the
façades of the residential properties closest to affected road links). When selecting receptors,
particular attention has been paid to assessing impacts close to junctions, where traffic may become
J4390 16 of 72 June 2021Bowes Primary Area Quieter Neighbourhood Scheme, Enfield Air Quality Assessment
congested and where there is a combined effect of several road links, and alongside those roads
where changes in traffic volumes are most significant.
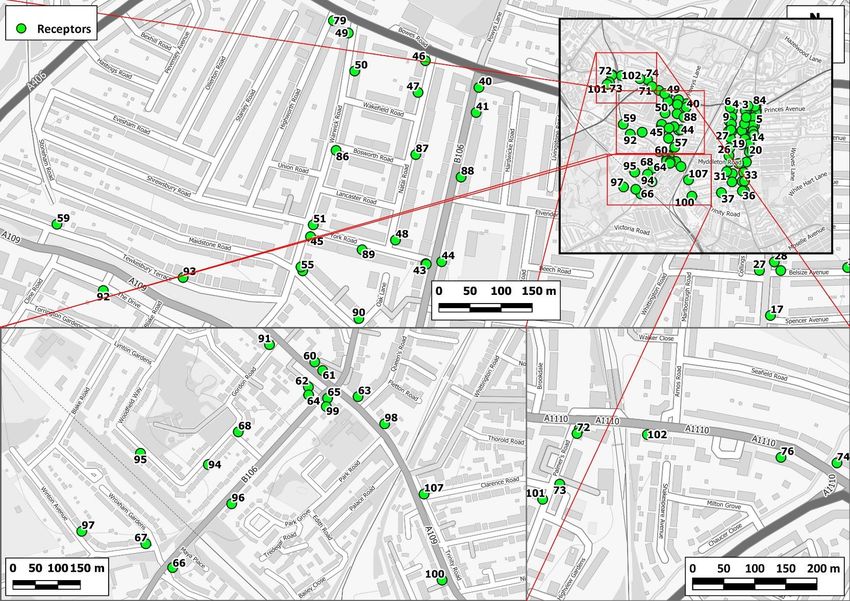
3.14 A number of existing residential properties have been identified as receptors for the assessment.
These locations are shown in Figure 4. In addition, concentrations have been modelled at the ENF5
automatic monitoring site in order to verify the model outputs (see Appendix A4 for verification
method).
3.15 It is important to note that receptors situated alongside the North Circular Road were selected to
provide information on the baseline conditions in the study area. However, there were no traffic
counts undertaken pre- and post-scheme alongside the various sections of this road, with the only
available data provided by TfL’s ATC 34. The scheme would have impacted each section of the
North Circular differently, thus using data from ATC 34 and applying it to the whole road would not
have been appropriate to assess the impacts of the scheme. It has therefore not been possible to
calculate accurate changes in traffic flows, and associated air quality impacts, alongside the North
Circular Road, other than for the section in which ATC34 is situated (i.e. between the B106 and
Palmerston Road). Even for receptors located alongside that section, and as discussed in further
details in paragraphs 5.6 and A4.9, the predicted impacts are a by-product of the use of emission
profiles calculated based on ATC data rather than associated with traffic changes attributable to the
scheme. Receptors situated alongside the North Circular have thus not been included in Figures 8
to 10 and were not considered in the assessment of the scheme’s impacts on air quality. Results for
receptors located on the same section of the North Circular Road as ATC34 are presented for
information in Appendix A5, although as discussed above, the presented impacts are likely to be
associated with the effect of profile change rather than traffic changes associated with the scheme.
J4390 17 of 72 June 2021Bowes Primary Area Quieter Neighbourhood Scheme, Enfield Air Quality Assessment
Figure 4: Receptor Locations
Contains Ordnance Survey data © Crown copyright and database right 2021. Ordnance Survey licence number 100046099. Additional data sourced from third
parties, including public sector information licenced under the Open Government Licence v1.0.
J4390 18 of 72 June 2021Bowes Primary Area Quieter Neighbourhood Scheme, Enfield Air Quality Assessment
Uncertainty in Road Traffic Modelling Predictions
3.16 There are many components that contribute to the uncertainty of modelling predictions. The road
traffic emissions dispersion model used in this assessment is dependent upon the traffic data that
have been input, which will have inherent uncertainties associated with them, as discussed in
paragraphs 3.8 to 3.10. The annualisation process to 2019 is based on traffic flows recorded prior
to the COVID pandemic, and 2019 AADT flows can be expected to be representative of ‘typical’
flows on modelled roads. It is however recognised that the calculated 2020 AADT flows, both pre-
scheme and post-scheme, are lower than that of a typical year, which is reflected by the reduction
in traffic that has been observed in London due to the COVID pandemic (TfL, 2020). In addition, the
annualisation process for the 2020 traffic data was not based on a full calendar year, with available
data covering the period between the 1st January and the 24th November.
3.17 The assessment has however mainly focused on the predicted changes in pollutant concentrations
associated with the scheme, which will not be significantly affected by total AADT. In addition, a
sensitivity test has been undertaken combining the modelled impacts with 2019 concentrations (see
paragraphs 3.10 and 5.5). The discussion on air quality conditions in the study area has also been
based on the 2019 modelled concentrations, which are representative of a ‘typical’ year, rather than
the 2020 concentrations. This approach has therefore addressed, as far as possible, the
uncertainties relating to the irregular traffic flows associated with the COVID pandemic.
3.18 There are then additional uncertainties, as models, by their nature simulate real-world conditions
through a series of algorithms.
3.19 An important stage in the process is model verification, which involves comparing the model output
with measured concentrations. The level of confidence in the verification process is necessarily
enhanced when data from an automatic analyser have been used, as has been the case for this
assessment (see Appendix A4). Because the model has been verified and adjusted, there can be
reasonable confidence in the prediction of base year (2019) concentrations.
3.20 Predicting pollutant concentrations in a future year5 will always be subject to greater uncertainty. For
obvious reasons, the model cannot be verified in the future, and it is necessary to rely on a series of
projections provided by DfT and Defra as to what will happen to traffic volumes, background pollutant
concentrations and vehicle emissions. Historic versions of Defra’s EFT tended to over-state
emissions reductions into the future. However, analyses of the most recent versions of Defra’s EFT
carried out by AQC (2020a) (2020b) suggest that, on balance, these versions are unlikely to over-
state the rate at which NOx emissions decline in the future at an ‘average’ site in the UK. In practice,
5For the purposes of this assessment, the phrase ‘future year’ is used to describe a scenario in which air quality
monitoring data is not yet available. There were no 2020 monitoring data at the time of publication, hence, 2020 is
described as a ‘future year’.
J4390 19 of 72 June 2021Bowes Primary Area Quieter Neighbourhood Scheme, Enfield Air Quality Assessment
the balance of evidence suggests that NOx concentrations are most likely to decline more quickly in
the future, on average, than predicted by the current EFT, especially against a base year of 2016 or
later. Using EFT v10.1 for future-year forecasts in this report thus provides a robust assessment,
given that the model has been verified against measurements made in 2019.
3.21 There are inherent uncertainties within the modelling, including the traffic data as primary input, and
as such the results should not be considered exact, but represent the best possible estimates, using
the best available data available at the time this report was undertaken.
J4390 20 of 72 June 2021Bowes Primary Area Quieter Neighbourhood Scheme, Enfield Air Quality Assessment
4 Baseline Conditions
Existing Conditions
4.1 Information on existing air quality has been obtained by collating the results of air quality monitoring
carried out by the local authority within the study area. Background concentrations have been
defined using the national pollution maps published by Defra (Defra, 2021). These cover the whole
country on a 1x1 km grid.
Air Quality Management Area and Focus Areas
4.2 LB Enfield declared a borough-wide Air Quality Management Area (AQMA) in 2001 for exceedances
of the annual mean nitrogen dioxide and 24-hour PM10 objectives. Half of the Bowes Quieter
Neighbourhood Scheme lies within this AQMA. LB Haringey also declared a borough wide AQMA in
2001 for exceedances of the annual mean nitrogen dioxide and 24-hour PM10 objectives. The
remaining portion of the scheme is within this AQMA.
4.3 There are also two air quality Focus Areas situated within the study area (‘A406 North Circular
between Bowes Road and Great Cambridge’ and ‘Bound Green A109 junction with
Durnsford/Brownlow Road B106’). As explained in Paragraph 2.19, these were last defined in 2016,
and correspond to areas where the EU annual mean limit value for nitrogen dioxide is exceeded,
and where there are high levels of human exposure.
4.4 All receptors selected for the assessment are located within either the Enfield or Haringey AQMAs,
whilst 35 receptors were selected within the two air quality Focus Areas.
J4390 21 of 72 June 2021Bowes Primary Area Quieter Neighbourhood Scheme, Enfield Air Quality Assessment
Figure 5: Consultation Area, AQMA and Air Quality Focus Areas
Contains Ordnance Survey data © Crown copyright and database right 2021. Ordnance Survey licence
number 100046099. Additional data sourced from third parties, including public sector information licenced
under the Open Government Licence v1.0.
Local Air Quality Monitoring
4.5 LB Enfield operates one roadside automatic monitoring station within the study area, situated
adjacent to the North Circular on the north side of the consultation area. The council also operates
two diffusion tubes within the consultation area; one situated on Warwick Road and one situated on
Brownlow Road, which commenced monitoring in 2018. The Council’s diffusion tubes are prepared
and analysed by Socotec (using the 50% TEA in acetone method). LB Haringey also operates one
nearby diffusion tube, which measures background pollutant concentrations at Bounds Green
Primary School, 30 m from the Bounds Green Road kerbside, at the south of the consultation area.
4.6 Annual mean results for the years 2014 to 2019 are summarised in Table 2, while results relating to
the 1-hour mean objective are summarised in Table 3. Exceedances of the objectives are shown in
bold. The monitoring locations are shown in Figure 6. The monitoring data have been taken from
J4390 22 of 72 June 2021Bowes Primary Area Quieter Neighbourhood Scheme, Enfield Air Quality Assessment
the respective LB Enfield and LB Haringey Annual Status Reports (ASRs) (LB Enfield, 2020) (LB
Haringey, 2020).
Table 2: Summary of Annual Mean NO2 Monitoring (2014-2019) (µg/m3)a
Site No. Site Type Location 2014 2015 2016 2017 2018 2019
ENF5 Automatic, Roadside Bowes Road 42 46 47 41 41 39
Diffusion Tube, Urban
Enfield 9 Warwick Road 55 43 39 51 27 24
Background
Enfield Diffusion Tube, Urban 134 Brownlow
- - - - 37 37
10 Background Road
Diffusion Tube, Urban Bounds Green
HR28 30 35 33 34 - 31
Background Primary School
Objective 40
a Exceedances of the objectives are shown in bold.
b Site types as listed within the monitoring sites’ respective ASRs.
Table 3: Number of Hours With NO2 Concentrations Above 200 µg/m3
Site
Site Type Location 2014 2015 2016 2017 2018 2019
No.
ENF5 Automatic, Roadside Bowes Road 0 1 6 3 0 0
Objective 18
J4390 23 of 72 June 2021Bowes Primary Area Quieter Neighbourhood Scheme, Enfield Air Quality Assessment
Figure 6: Monitoring Locations
Contains Ordnance Survey data © Crown copyright and database right 2021. Ordnance Survey licence
number 100046099. Additional data sourced from third parties, including public sector information licenced
under the Open Government Licence v1.0.
4.7 Monitoring indicates that annual mean NO2 concentrations were below the objectives at all four
monitors in 2019. Site ENF5 had been above the annual mean objective from 2014 to 2018, and
Enfield 9 had exceeded the objective in 2014, 2015 and 2017. Both of the above are situated
adjacent to roads, with the former 3 m from the North Circular kerbside, a road with high traffic
volume and congestion. Enfield 10 commenced monitoring in 2018 and was below the objective in
both 2018 and 2019. There is no clear trend in annual mean background or roadside concentrations
over time, other than a decrease in annual mean concentrations in 2019, which was consistent
between the three long term monitors. Hourly-mean concentrations of nitrogen dioxide monitored at
ENF5 have remained below the objective since 2014.
4.8 Monitoring site ENF5 also measures PM10 concentrations. Annual mean results for the years 2014
to 2019 are presented in Table 4, while 24-hour mean concentrations are summarised in Table 5.
PM2.5 concentrations are not monitored within the study area.
J4390 24 of 72 June 2021Bowes Primary Area Quieter Neighbourhood Scheme, Enfield Air Quality Assessment
4.9 Monitoring indicates that PM10 concentrations have been well below the annual mean and daily mean
objectives since 2014. There is no clear trend in concentrations over time.
Table 4: Summary of Annual Mean PM10 Monitoring (2014-2019) (µg/m3)
Site
Site Type Location 2014 2015 2016 2017 2018 2019
No.
Automatic,
ENF5 Bowes Road 21 19 22 24 18 19
Roadside
Objective 40
Table 5: Number of Days With PM10 Concentrations Above 50 µg/m3
Site
Site Type Location 2014 2015 2016 2017 2018 2019
No.
Automatic, No
ENF5 Bowes Road 11 1 10 9 2
Roadside data a
Objective 35
a Data unavailable in 2019 due to an error in the 2020 ASR.
Background Concentrations
4.10 Estimated background concentrations in the study area have been determined for 2019 and 2020
using Defra’s background maps (Defra, 2021). The background concentrations are set out in Table 6
and have been derived as described in Appendix A4. The background concentrations are all well
below the objectives.
Table 6: Estimated Annual Mean Background Pollutant Concentrations in 2019 and
2020 (µg/m3) a
Year NO2 PM10 PM2.5
2019 22.9 - 21.9 18.5 - 17.8 12.2 - 11.9
2020 21.5 - 20.6 18.1 - 17.4 12.0 - 11.6
Objectives 40 40 25b
a
The range of values is for the different 1x1 km grid squares covering the study area.
b The PM2.5 objective, which was to be met by 2020, is not in Regulations and there is no requirement for
local authorities to meet it.
Baseline Dispersion Model Results
4.11 Baseline concentrations of nitrogen dioxide have been modelled at each of the selected receptor
locations (see Figure 4 for receptor locations). The nitrogen dioxide results cover existing (2019)
baseline conditions and are illustrated in Figure 7. The modelled road components of nitrogen oxides
J4390 25 of 72 June 2021You can also read