Morbidity and mortality from road injuries: results from the Global Burden of Disease Study 2017
←
→
Page content transcription
If your browser does not render page correctly, please read the page content below
Original article
Inj Prev: first published as 10.1136/injuryprev-2019-043302 on 8 January 2020. Downloaded from http://injuryprevention.bmj.com/ on February 14, 2020 by guest. Protected by copyright.
Morbidity and mortality from road injuries: results
from the Global Burden of Disease Study 2017
Spencer L James ,1 Lydia R Lucchesi,1 Catherine Bisignano,1 Chris D Castle,1
Zachary V Dingels,1 Jack T Fox,1 Erin B Hamilton,1 Zichen Liu,1 Darrah McCracken,1
Molly R Nixon,1 Dillon O Sylte,1 Nicholas L S Roberts,1 Oladimeji M Adebayo,2
Teamur Aghamolaei,3 Suliman A Alghnam,4 Syed Mohamed Aljunid,5,6
Amir Almasi-Hashiani,7 Alaa Badawi,8,9 Masoud Behzadifar,10 Meysam Behzadifar,11
Eyasu Tamru Bekru,12 Derrick A Bennett,13 Jens Robert Chapman,14 Kebede Deribe,15,16
Bereket Duko Adema,17 Yousef Fatahi,18 Belayneh K Gelaw,19
Eskezyiaw Agedew Getahun,20 Delia Hendrie,21 Andualem Henok,22 Hagos de Hidru,23
Mehdi Hosseinzadeh,24,25 Guoqing Hu,26 Mohammad Ali Jahani,27
Mihajlo Jakovljevic,28 Farzad Jalilian,29 Nitin Joseph,30 Manoochehr Karami,31
Abraham Getachew Kelbore,32 Md Nuruzzaman Khan,33,34 Yun Jin Kim,35
Parvaiz A Koul,36 Carlo La Vecchia,37 Shai Linn,38 Reza Majdzadeh,39,40
Man Mohan Mehndiratta,41,42 Peter T N Memiah,43 Melkamu Merid Mengesha,44
Hayimro Edemealem Merie,45 Ted R Miller,21,46 Mehdi Mirzaei-Alavijeh,29
Aso Mohammad Darwesh,47 Naser Mohammad Gholi Mezerji,48
Roghayeh Mohammadibakhsh,49 Yoshan Moodley,50 Maziar Moradi-Lakeh,51
Kamarul Imran Musa,52 Bruno Ramos Nascimento,53 Rajan Nikbakhsh,54
Peter S Nyasulu,55 Ahmed Omar Bali,56 Obinna E Onwujekwe,57 Sanghamitra Pati,58
Reza Pourmirza Kalhori,59 Farkhonde Salehi,60 Saeed Shahabi,61
Seifadin Ahmed Shallo,62 Morteza Shamsizadeh,63 Zeinab Sharafi,64
Sharvari Rahul Shukla,65 Mohammad Reza Sobhiyeh,66,67 Joan B Soriano,68,69
Bryan L Sykes,70 Rafael Tabarés-Seisdedos,71,72 Degena Bahray Bahrey Tadesse,73,74
Yonatal Mesfin Tefera,75,76 Arash Tehrani-Banihashemi,51,77 Boikhutso Tlou,78
►►Additional material is Roman Topor-Madry,79,80 Taweewat Wiangkham,81 Mehdi Yaseri,82,83 Sanni Yaya,84
published online only. To view
please visit the journal online Muluken Azage Yenesew,85 Mustafa Z Younis,86,87 Arash Ziapour,88 Sanjay Zodpey,89
(http://dx.doi.o rg/10.1136/
injuryprev-2019-043302). David M Pigott,1,90 Robert C Reiner Jr,1,90 Simon I Hay,1,90 Alan D Lopez,1,91
For numbered affiliations see Ali H Mokdad1,90
end of article.
Correspondence to
Spencer L James, Institute for Abstract cases of road injuries. Age-standardised incidence rates
Health Metrics and Evaluation, Background The global burden of road injuries is known of road injuries increased between 1990 and 2017, while
University of Washington, to follow complex geographical, temporal and demographic mortality rates decreased. Regionally, age-standardised
Seattle, WA 98121, USA; mortality rates decreased in all but two regions, South
patterns. While health loss from road injuries is a major
spencj@uw.edu
topic of global importance, there has been no recent Asia and Southern Latin America, where rates did not
Received 10 May 2019 comprehensive assessment that includes estimates for every change significantly. Nine of 21 GBD regions experienced
Revised 29 July 2019 age group, sex and country over recent years. significant increases in age-standardised incidence rates,
Accepted 30 July 2019 while 10 experienced significant decreases and two
Methods We used results from the Global Burden
of Disease (GBD) 2017 study to report incidence, experienced no significant change.
prevalence, years lived with disability, deaths, years of Conclusions While road injury mortality has improved
© Author(s) (or their life lost and disability-adjusted life years for all locations in recent decades, there are worsening rates of incidence
employer(s)) 2020. Re-use in the GBD 2017 hierarchy from 1990 to 2017 for road and significant geographical heterogeneity. These
permitted under CC BY. findings indicate that more research is needed to better
Published by BMJ. injuries. Second, we measured mortality-to-incidence
understand how road injuries can be prevented.
ratios by location. Third, we assessed the distribution
To cite: James SL, of the natures of injury (eg, traumatic brain injury) that
Lucchesi LR, Bisignano C,
et al. Inj Prev Epub ahead of result from each road injury.
print: [please include Day Results Globally, 1 243 068 (95% uncertainty interval Introduction
Month Year]. doi:10.1136/ 1 191 889 to 1 276 940) people died from road injuries in In the original 1971 formulation of the epidemi-
injuryprev-2019-043302 2017 out of 54 192 330 (47 381 583 to 61 645 891) new ological transition, Abdel Omran suggested that a
James SL, et al. Inj Prev 2020;0:1–11. doi:10.1136/injuryprev-2019-043302 1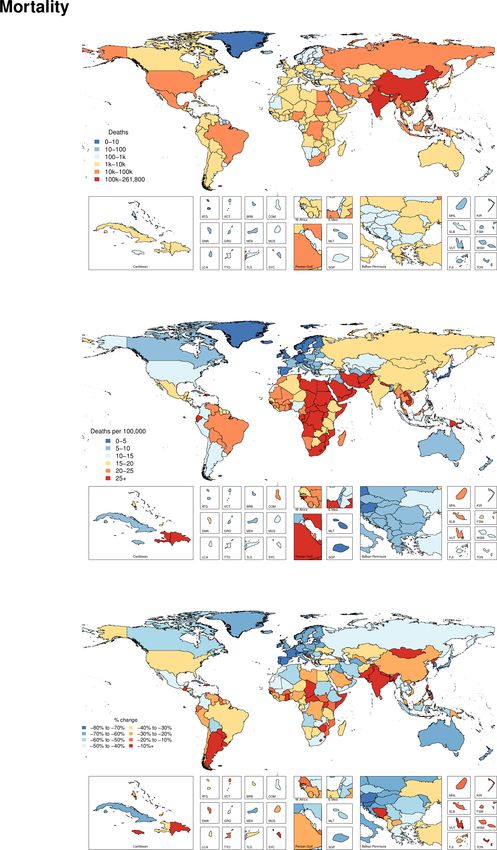
Original article
Inj Prev: first published as 10.1136/injuryprev-2019-043302 on 8 January 2020. Downloaded from http://injuryprevention.bmj.com/ on February 14, 2020 by guest. Protected by copyright.
country could be expected to pass through three phases of health considerable lag between burden measurement, policy implemen-
loss patterns as its economy improved.1 A country would experi- tation and burden improvement, road injury burden can change
ence, first, an ‘age of pestilence and famine’ and, second, an ‘age rapidly if measures such as seatbelt laws, intoxicated driving laws
of receding pandemics’. The third phase would include increased and infrastructure improvements are implemented.17–20 Hence, it
burden from ‘degenerative and man-made diseases’, a phase that is important to continue regular updates of health assessments that
in their 2002 review Salomon and Murray summarised as health measure morbidity and mortality from road injuries, as preventing
loss from ‘cancers, cardiovascular diseases, and accidents’.2 This and treating road injuries is of critical importance for sustain-
work on the epidemiological transition provides a starting point able improvements in population health outcomes and warrants
for reviewing the current global burden of road injuries and for detailed analysis to understand sociodemographic patterns as well
investigating the relationship between road injuries and economic as geographical trends over time.
development. The burden of road injuries has become an area of The Global Burden of Diseases, Injuries, and Risk Factors Study
particular focus across global forums in recent years. In March (GBD) is a comprehensive assessment of health loss to measure
2010, the United Nations (UN) General Assembly proclaimed morbidity and mortality from a wide array of diseases, injuries and
2011–2020 as the Decade of Action for Road Safety.3 In 2015, the risk factors.11 12 21–24 The study involves a global network of over
UN General Assembly established Sustainable Development Goal 3500 collaborators who provide broad expertise on diseases, inju-
3.6 as the target of reducing road traffic deaths and injuries by 50% ries, risk factors and locations. The study is published on an annual
by 2020.4 More recently, the WHO published the Global Status basis, so estimates are frequently updated with new input data and
Report on Road Safety 2018 and established focus on road safety methodological improvements. GBD 2017 was published in 2018
goals with performance targets in the WHO’s General Programme and included road injuries as one of 30 mutually exclusive, collec-
of Work 2019–2023.5 Efforts such as Vision Zero have developed tively exhaustive injury-related causes of death and disability. In
cross-setting efforts ranging from countries in Europe to states in the GBD, road injuries encompass injuries involving motor vehi-
India to cities in the USA to develop a road safety paradigm focused cles, pedestrians, motorcyclists and cyclists. GBD 2017 included
on reducing road injury burden to zero.6 The European Transport estimates of road injury morbidity and mortality in terms of inci-
Safety Council has developed evidence-based guidance on trans- dence, prevalence, years lived with disability (YLDs), cause-specific
port safety improvements in Europe, while the Insurance Institute mortality, years of life lost (YLLs) and disability-adjusted life years
for Highway Safety in the USA has conducted research on the (DALYs) for 195 countries and territories, all age groups and both
science of highway safety and on safety profiles of different vehi- sexes, for years between 1990 and 2017.
cles. Globally, the International Transport Forum has developed The objective of this paper is to use the GBD 2017 results
important resources to guide transport safety improvements on a and framework to provide an updated assessment of the global
global basis across multiple modes of transport. The complexity of burden of road injuries and to identify trends and patterns that
road safety science has advanced such that entire textbooks now may be useful by policymakers, organisations and the private
focus on the elements of road safety ranging from behavioural sector for preventing future road injury burden.
science to economic relationships.7 Across these efforts, it is
evident that it is now more critical than ever for legislative poli-
Methods
cymakers, ministries of health, transportation sectors, academic
GBD 2017
research groups and other agencies to work collaboratively with
GBD 2017 methods and results are described in extensive detail in
a Safe System paradigm on improving road safety.8 Measurement
GBD literature, including descriptions of the analytical estimation
of road injury burden is a critical component of advancing these
framework used to measure deaths, YLLs, incidence, prevalence,
initiatives.
YLDs and DALYs for every cause in GBD including injuries.11 12 21–24
Many other studies have measured road injury burden using
A review of key GBD methods is summarised in online supplemen-
different methods and data sources including updates to the Global
tary appendix 1. The methodological components specific to inju-
Burden of Disease (GBD) Study, road safety reports by the WHO
ries and road injuries estimation within the GBD framework are as
and reports or studies published by other groups.9–12 While past
follows. All key analytical steps are conducted across 1000 draws,
research has been instrumental in advancing road safety initia-
and the ordered 25th and 975th values of the final estimates are used
tives, it is also important to produce regular updates of road injury
to determine the 95% uncertainty interval (UI).
burden estimates. Updates that include recent years are critical
to ensuring that the effects of economic development, new poli-
cies and new safety technologies can be observed and discussed GBD injury classification
with minimal latency. Timeliness of updating road injury burden Our case definition for a road injury is ‘interaction, as a pedestrian
estimates helps ensure that policymakers and health resources on the road, with an automobile, motorcycle, pedal cycle, or other
researchers appropriately focus their efforts, and historically vehicles resulting in bodily damage or death’. The GBD cause hier-
evidence- informed policies regarding road injuries have been archy includes road injuries as an external cause of injury, similar to
impactful. For example, research on road injury burden in Iran falls or poisoning. These external cause-of-injury codes or ‘E codes’
in the early 2000s led to new policies being enacted to address are designated as mutually exclusive and collectively exhaustive in
the growing burden, while elsewhere in countries such as the USA the cause hierarchy, meaning that they include every possible cause
and Australia, legislation focused on intoxicated driving, seat- of death or disability either as specific injuries or as residual (‘other’)
belt requirements, speed controls and vehicle safety have likely injuries. These external cause-of-injury codes cause nature-of-injury
contributed to decreasing mortality rates from road injuries in codes, which specify the bodily injury that is caused by an external
select areas.13–16 In cases where road safety legislation has been cause of injury. In terms of the nature-of-injury codes (eg, the trau-
passed, successful implementation of such policies is also crit- matic brain injury (TBI) that might be due to a road injury), injuries
ical, and it is also not clear the extent to which successful policy were categorised into 47 mutually exclusive and collectively exhaus-
in one location can be equally successful elsewhere. Road injuries tive nature-of-injury categories using chapters S and T in the Inter-
are a unique cause of morbidity and mortality on the global land- national Classification of Diseases (ICD), 10th revision, and codes
scape because unlike diseases and injuries for which there may be 800–999 in ICD-9. Since it is possible that an external cause of injury
2 James SL, et al. Inj Prev 2020;0:1–11. doi:10.1136/injuryprev-2019-043302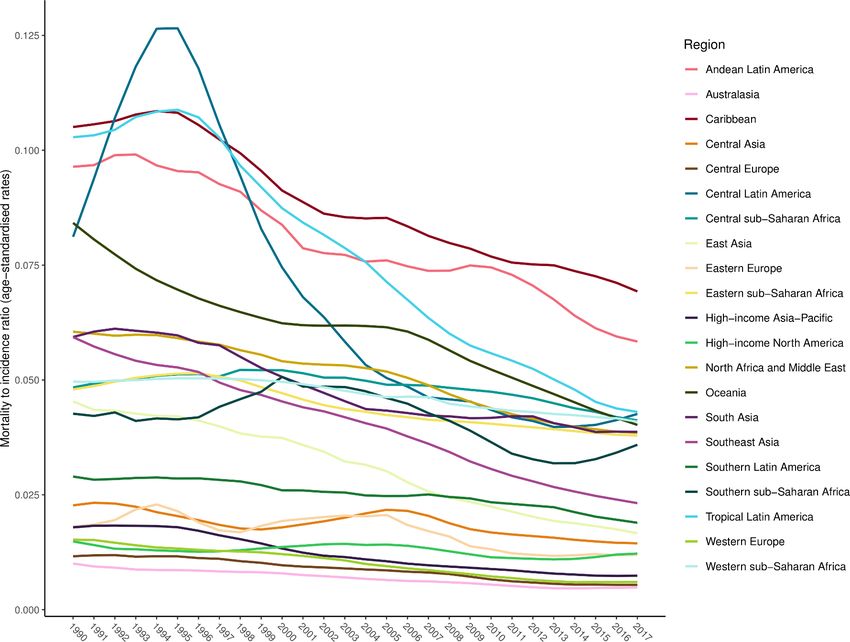
Original article
Inj Prev: first published as 10.1136/injuryprev-2019-043302 on 8 January 2020. Downloaded from http://injuryprevention.bmj.com/ on February 14, 2020 by guest. Protected by copyright.
including a road injury may not actually lead to bodily harm, we only remission. Our assumption that case fatality rates are higher in lower
include injuries in our morbidity analysis that warranted some form income setting is implemented by adding lag-distributed income per
of healthcare, which is typically indicated in survey data for road capita as a covariate on excess mortality, which causes a negative
injuries and can be inferred from our use of hospital records. For relationship between income and mortality. This assumption is based
example, a low-speed collision (‘fender bender’) that did not lead to on the observation that more sophisticated forms of treatment such
any bodily injury to drivers, passengers or bystanders would not be as intensive care units (ICU), ventilator support and surgery may be
considered an injury in GBD. required for higher acuity injuries resulting from road injuries.
After incidence cause models were conducted for each type of
road injury, we split the cause incidence into inpatient and outpa-
Mortality and YLLs from road injuries
tient incidence based on a coefficient derived in DisMod- MR
GBD methods for cause of death estimation is provided in GBD
2.1 in locations that had both types of data. Both of these series
literature.11 12 21–25 A brief overview of this process is as follows.
then went through the following steps. We developed a severity
First, all available data sources were accessed and mapped
hierarchy of nature-of-injury types by using pooled datasets of
into the GBD cause list and cause hierarchy. Road injuries
follow-up studies from China, the Netherlands and the USA where
data sources included vital registration, verbal autopsy studies,
health status 1 year after injury could be mapped to existing GBD
mortality surveillance, censuses, surveys, hospital records
disability weights.28–34 This severity hierarchy was used to identify
and mortuary data. For road injuries, we used ICD-9 codes
the injury that would cause the most disability in the event that
E800.3, E801.3, E802.3, E803.3, E804.3, E805.3, E806.3,
a road injury lead to multiple types of injuries (eg, a spinal cord
E807.3, E810.0-E810.6, E811.0-E811.7, E812.0-E812.7,
transection and a wrist fracture).
E813.0-E813.7, E814.0-E814.7, E815.0-E815.7,
Next, recognising that injury disability is determined by nature of
E816.0-E816.7, E817.0-E817.7, E818.0-E818.7,
injury rather than cause of injury, we estimated the proportion of
E819.0-E819.7, E820.0-E820.6, E821.0-E821.6,
road injuries that would lead to each nature-of-injury type being the
E822.0-E822.7, E823.0-E823.7, E824.0-E824.7,
most severe. We computed these proportions using Dirichlet regres-
E825.0-E825.7, E826.0-E826.1, E826.3-E826.4, E827.0,
sion methods in dual-coded hospital and emergency department data
E827.3-E827.4, E828.0, E828.4 and E829.0-E829.4, and ICD-10
where both cause and nature could be identified. This process and the
codes V01-V04.99, V06-V80.929, V82-V82.9 and V87.2-V87.3.
data sources used are described in more detail in other GBD studies.35
Second, we redistributed ill-defined causes of death to specific
Each cause–nature matrix was specific to hospital admission versus
underlying causes, including road injuries, via a process known as
injury warranting other healthcare, high/low income countries and
garbage code redistribution.12 26 Third, ensemble models for road
territories, male/female and age category. Deriving these matrices
injuries and each subtype were conducted using the GBD Cause
separately in this manner allows variation by these variables. We
of Death Ensemble modelling (CODEm) software. CODEm
then applied these proportions to our cause-of-injury incidence from
employs five principles to build a cause of death model based on
DisMod-MR 2.1 in order to estimate cause–nature incidence. We
testing a variety of possible models that have been run through
several modelling classes using an array of covariates.27 Next, converted these estimates to prevalence using the average duration
an ensemble of best-performing models is constructed based on for each nature of nature of injury and for inpatient and outpatient
out-of-sample validity testing. The covariates used in the models injuries from the Dutch Injury Surveillance System with supplemen-
included lag-distributed income per capita (a smoothed series of tation from expert-driven estimates of short-term duration for nature
GDP per capita), education per capita in years, alcohol use in of injury categories that had insufficient numbers in the Dutch dataset
litres per capita, an indicator for opium cultivation, population and for untreated injuries.31 We measured the probability of long-term
density over 1000 per square kilometre, a summary exposure (permanent) disability to account for the permanence of conditions
value for violent injuries, Socio-demographic Index (SDI) and such as spinal cord injury as opposed to the shorter term recovery
Healthcare Access and Quality Index. Deaths for each cause are for conditions such as a fibular fracture. The probability of long-term
then rescaled such that the sum of deaths across causes equals disability was based on analysis of long-term follow-up studies.28–34
the total deaths, which enforces internal consistency across GBD Long-term prevalence was then calculated based on the ordinary
estimates. As a final step, YLLs due to road injuries and each differential equation solver used in DisMod-MR 2.1 to incorporate
subtype are calculated by multiplying deaths by the residual the parameters of incidence and long-term mortality risk for nature-
life expectancy at the age of death from GBD 2017 standard of-injury conditions with increased mortality risk (eg, traumatic brain
model life table. YLLs measure the number of years of life are injury) such that prevalence is correctly estimated after accounting for
lost when a death occurs at an age less than the life expectancy; excess mortality risk. Finally, we calculated YLDs by multiplying the
for example, if the residual life expectancy at age 25 years is 60, prevalence of a health state, as defined in this process as the nature
then 60 years of life were lost when a person dies at age 25 years. of injury, and a disability weight, which has been mapped to these
injuries in previous GBD research.36 Finally, across all causes in GBD,
a comorbidity correction is applied to account for comorbidity distri-
Incidence, prevalence and YLDs due to road injuries butions in the population.11
Estimation of non- fatal injury outcomes (incidence, prevalence
and YLDs) in GBD is described in detail in related publications.11
A summary is as follows. We used DisMod-MR 2.1 (a descriptive Socio-demographic Index
epidemiological meta-regression tool) to model incidence data for SDI is an indicator based on the human development index that
road injuries from emergency department and hospital records and includes income per capita, average educational attainment and
survey data to estimate incidence by location, year, age and sex. These total fertility rate under 25. Low SDI values correspond to low
models were conducted for each subtype of road injuries. We used income per capita, low educational attainment and high fertility
cause-specific mortality rates and incidence data to compute excess under 25 years, while high values correspond to higher income
mortality rates following an injury since DisMod-MR 2.1 functions per capita, greater educational attainment and lower fertility under
in a compartmental framework such that all incident cases of injury 25 years. We tabulate some results in this study by SDI quintile in
must be explained by dying, remaining prevalent or going into order to identify socioeconomic patterns in road injury burden.
James SL, et al. Inj Prev 2020;0:1–11. doi:10.1136/injuryprev-2019-043302 3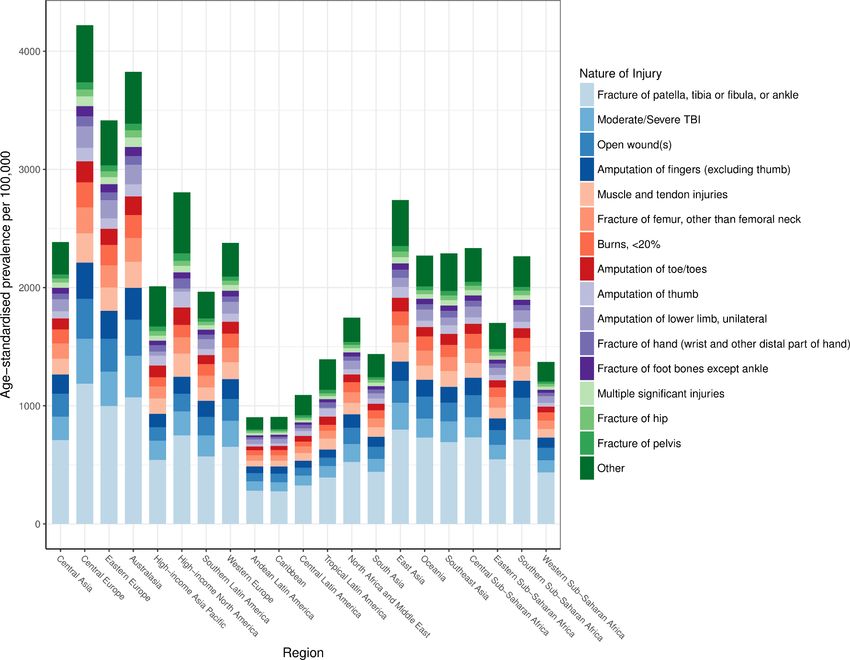
Original article
Inj Prev: first published as 10.1136/injuryprev-2019-043302 on 8 January 2020. Downloaded from http://injuryprevention.bmj.com/ on February 14, 2020 by guest. Protected by copyright.
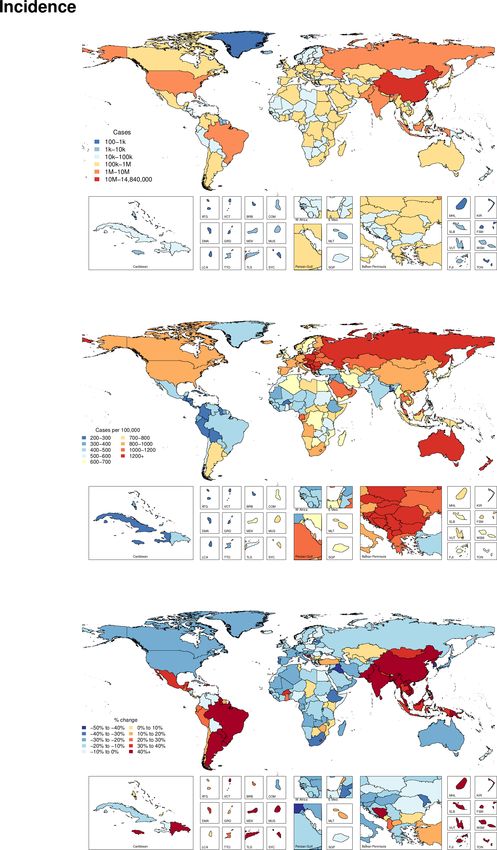
Guidelines for Accurate and Transparent Health Estimates from 1990 to 2017. Geographically, figure 3 shows the deaths
Reporting (GATHER) compliance and age-standardised mortality rate from road injuries in 2017
This study complies with the GATHER recommendations (see and the per cent change between 1990 and 2017. This figure
online supplementary appendix 2). Analyses were completed reveals the general pattern that mortality rates from road injuries
using Python version 2.7, Stata V.13.1 or R version 3.3. Statis- is highest in select countries in North Africa, the Middle East and
tical code used for GBD estimation is publicly available online Southern sub-Saharan Africa in 2017. The countries with the
at h
ealthdata.org. highest age-standardised mortality rates were Central African
Republic (85.5 (50.7 to 111.2) deaths per 100 000), Somalia
Results (51.1 (27.8 to 72.0)) and United Arab Emirates (49.9 (39.5 to
Summary results are as follows. Additional results by age, sex, 61.1)). China had the highest number of total deaths, with 261
year, location and injury cause and nature are available online 802 (247 924 to 273 651) deaths estimated in 2017.
at h
ealthdata.
org. Online resources also allow for measuring
changes between different years, for example, between 2007 and YLDs, YLLs and DALYs
2017 as opposed to 1990 and 2017 as well as reviewing sources Online supplementary appendix table 3 shows the counts, age-
of data used in GBD 2017. standardised rates and per cent change from 1990 to 2017 of
YLDs, YLLs and DALYs for road injuries. Globally, in 2017, road
Incidence injuries resulted in 57 638 366 (55 500 786 to 59 369 191) YLLs,
Online supplementary appendix table 1 shows all ages incidence 10 159 667 (7 272 042 to 13 618 818) YLDs and 67 798 033
counts and age-standardised incidence rates for 2017 as well as the (64 337 599 to 71 454 968) DALYs, reflecting age-standardised
percentage change in age-standardised rates from 1990 to 2017 for rates of 745 (718 to 767) per 100 000, 126 (90 to 169) and 871
overall road injuries. Countries in the middle SDI quintile experi- (828 to 917), respectively. Age-standardised YLLs and DALYs
enced the highest increase of incidence rates from 1990 to 2017, decreased by 34.4% (30.4 to 38.5) and 30.8% (26.9 to 35.0),
with a 53.3% (95% UI 47.1 to 59.4) increase. High SDI was the respectively, between 1990 and 2017, while age-standardised
only quintile that had decreased incidence rates during that time YLDs increased 2.2% (0.3 to 4.0). The region with the highest
period, with a decrease of 16.5% (11.9 to 21.0). Figure 1 shows age-standardised DALY rate was Central sub-Saharan Africa with
the new cases and age-standardised incidence rates of road injuries 1720 (1448 to 1999) DALYs per 100 000, which represented
for 2017 and the per cent change between 1990 and 2017 for 1564 (1302 to 1834) YLLs and 156 (114 to 204) YLDs.
age-standardised incidence rates by country and territory. Glob-
ally, the age-standardised incidence rate was 692 (605 to 786) per Mortality-to-incidence ratios (MIRs)
100 000 in 2017, representing an increase of 11.3% (6.4 to 15.8) Figure 4 shows the ratios of age-standardised mortality rates to
from 1990 to 2017 and corresponding to 54 192 330 (47 381 age-standardised incidence rates by region in 1990 and 2017,
583 to 61 645 891) new cases in 2017. Age-standardised incidence which approximates the risk of death given a road injury. This
rates decreased from 1990 to 2017 in 109 out of 195 countries figure shows how the MIRs vary by both time and location. The
and territories, with the largest declines in South Korea, Iraq and Caribbean had the highest MIR in 2017, while Australasia had
Portugal, which decreased by 40.6% (33.3 to 46.6), 40.4% (34.5 the lowest, following the pattern of percentage DALYs caused
to 45.2) and 38.8% (31.9 to 45.5), respectively. by YLDs described above. While MIR varied substantially across
The regions with the highest age-standardised incidence rates regions, it also declined in every region from 1990 to 2017.
in 2017 were Central Europe (1467 (1297 to 1687)), Austral-
asia (1304 (1157 to 1480)) and Eastern Europe (1193 (1022 to
1405)). Among the 21 GBD regions, 10 experienced significant Nature of injuries caused by road injuries
decreases in age-standardised incidence rates, 9 regions expe- The average global disability weight used in computing YLDs
rienced significant increases in age-standardised incidence rates after comorbidity adjustment was 5.8%. Figure 5 shows the
(with the greatest increases found in East Asia and Oceania) and distribution of natures of injury in terms of age-standardised
the remaining two regions experienced no significant change in prevalence by region. This figure shows that the category of
age-standardised incidence rates (Central Europe and Central injury that includes fractures of patella, tibia or fibula or ankle is
Asia). Age-standardised incidence rates decreased the most from the leading cause of disability for victims of road injuries. TBI is
1990 to 2017 in High-income Asia Pacific, decreasing by 28.3% also an important contributor to health loss from road injuries in
(23.5 to 33.2) and had the greatest increase in East Asia, where all regions of the world.
it increased by 111.2% (101.4 to 120.8). In terms of an age
pattern, figure 2 shows global age-specific incidence rates for Discussion
each age group by sex in 2017. This figure emphasises how road The Global Status Report on Road Safety in 2018 published by
injury incidence is heavily concentrated in young to middle age the WHO cites important progress in road safety initiatives that
groups and that males experience higher incidence rates than have made at the country level, such as new legislation oriented to
females, particularly in young adulthood. road safety, updated vehicle standards and technology and access
to trauma care.5 For example, 123 out of 175 countries included in
Cause-specific mortality the report were noted to have best-practice road safety laws imple-
Online supplementary appendix table 2 shows all ages deaths mented for at least one of the key risk factors for road injuries,
and age-standardised mortality rates for 2017 as well as the and the report notes progress such as additional countries passing
percentage change in age-standardised rates from 1990 to 2017. legislation and policy related to drink driving, motorcycle helmet
Globally, the age-standardised mortality rate was 15.8 (15.2 to use and child restraint systems. In this study, we found that despite
16.3) per 100 000 in 2017, which corresponded to 1 243 068 global increases in road injuries incidence between 1990 and 2017,
(1 191 889 to 1 276 940) deaths in 2017 and represented a cause-specific mortality has decreased over the same time period,
29.0% (25.0 to 33.6) decrease in age-standardised mortality rate which likely reflects many of these underlying country- level
4 James SL, et al. Inj Prev 2020;0:1–11. doi:10.1136/injuryprev-2019-043302Original article
Inj Prev: first published as 10.1136/injuryprev-2019-043302 on 8 January 2020. Downloaded from http://injuryprevention.bmj.com/ on February 14, 2020 by guest. Protected by copyright.
Figure 1 Incident cases, age-standardised incidence rates, and per cent change between 1990 and 2017 by country for road injuries.
James SL, et al. Inj Prev 2020;0:1–11. doi:10.1136/injuryprev-2019-043302 5Original article
Inj Prev: first published as 10.1136/injuryprev-2019-043302 on 8 January 2020. Downloaded from http://injuryprevention.bmj.com/ on February 14, 2020 by guest. Protected by copyright.
Figure 2 Age-specific and sex-specific incidence of road injuries globally in 2017.
improvements as described by the WHO. From this summary systems.39 Advances in trauma care over the past three decades
finding, several important themes emerge. have led to improved imaging and diagnostic technologies
First, the observation of incidence increasing and mortality being more readily available to global populations, and research
decreasing on the global level implies that while road injuries are in trauma resuscitation has led to better understanding of the
becoming more frequent, individuals experiencing road injuries pathology that can occur in a road injury, though postincident
are less likely to die. It is likely that at least part of the increases care in road injuries remains an ongoing area of research.40 41
in incidence can be explained by broadly increasing access to and It is likely that the implied improvements in case fatality have
utilisation of motorised transport in all locations of the world also been affected by improved quality and access to medical
over the time period of this study, including shifts in types of care on a global scale. Among SDI quintiles, one exception to
motorised transit (eg, from bicycles to motorbikes) being used. this trend occurred in the highest SDI quintile, which experi-
This observation may also imply general improvements in case enced decreases both in incidence and mortality, suggesting that
fatality rates. Improvements in case fatality rates may be affected concomitant improvements may be possible as socioeconomic
by two general processes. First, it is possible that improvements development continues globally.
in infrastructure, driving laws such as seatbelt laws and vehicle Second, while we found global improvements in mortality
safety improvements have led to the types of disability sustained despite increases in incidence, we also observed considerable
in road injuries decreasing in severity over time. For example, a heterogeneity by country and region. Despite global improve-
driver who was in a road incident in 1990 may have been less ments in mortality, multiple countries experienced increases
likely to be wearing a seatbelt than a driver in 2017, which could in age-standardised cause-specific mortality from road injuries
have increased the probability of more severe injuries and death during this study period. For example, Paraguay, Chad, Lesotho,
in 1990 relative to 2017, all else being equal. Similarly, infra- Pakistan, Mongolia and North Korea experienced increases in
structure improvements such as improved roads, guard rails and road injuries mortality, emphasising that despite global improve-
streetlights, particularly in developing economies, may have led ments, it is important for health policy research to be conducted
to less morbidity and mortality in each road injury case, even in areas where fatal burden from road injuries is still increasing.
if the total number of cases is increasing due to factors such as For example, patients with moderate- to-
severe injury that
increased rates of driving.37 38 The second possible factor that received treatment at a level 1 trauma centre in the USA were
could lead to improvements in case fatality is improvements shown to be at a 25% decreased risk of death when compared
in access to medical care following a road injury. For example, with those who accessed a non-trauma centre, raising the ques-
adding ambulance services, building trauma centres and ensuring tion of whether medical infrastructure development could
access to emergency medical care in all populations is likely to produce similar improvements in lower income settings .40 It is
be beneficial in terms of improving survival for road injury possible that portions of road injury burden may be mitigated
cases, which has been shown in locations that advance trauma by legislation (eg, seatbelt laws), infrastructure and engineering
6 James SL, et al. Inj Prev 2020;0:1–11. doi:10.1136/injuryprev-2019-043302Original article
Inj Prev: first published as 10.1136/injuryprev-2019-043302 on 8 January 2020. Downloaded from http://injuryprevention.bmj.com/ on February 14, 2020 by guest. Protected by copyright.
Figure 3 Deaths, age-standardised mortality rates and per cent change between 1990 and 2017 by country for road injuries.
James SL, et al. Inj Prev 2020;0:1–11. doi:10.1136/injuryprev-2019-043302 7Original article
Inj Prev: first published as 10.1136/injuryprev-2019-043302 on 8 January 2020. Downloaded from http://injuryprevention.bmj.com/ on February 14, 2020 by guest. Protected by copyright.
Figure 4 Changes in mortality-to-incidence ratios by GBD region from 1990 to 2017. GBD, Global Burden of Disease.
(eg, road construction) and behavioural modifications (eg, intox- for developing countries to prioritise road safety initiatives and
icated driving). Yet it is also likely that there are still unidentified injury prevention.43
factors that lead to road injury incidence and mortality, particu- Fourth, for the first time in GBD research, we were able to
larly as these trends are likely governed by a wide array of factors estimate the burden of road injuries in terms of the types of
ranging from trauma pathophysiology to vehicle engineering to disability that road injuries caused. Specifically, we found that
social behaviours. Future road injury research may benefit from the most common nature of injury sustained in a road injury
more comprehensive syntheses of how various causes and modi- in all regions was fracture of patella, tibia/fibula or ankle and
fiers affect these outcomes, similar to how our understanding of that in most regions, moderate/severe TBIs were the next leading
cancer, infectious disease and cardiovascular disease has bene- cause of disability in road injuries. These are important findings
fited from laboratory-based, translational-based and population- for two reasons. Lower extremity fractures can require surgical
based research studies. management in order to avoid longer term disability, which
Third, we found that changes in incidence and mortality emphasises the importance of modern medical services including
varied by development. Specifically, countries and territories surgical services being available in all areas of the world. In addi-
in the middle SDI quintile experienced the greatest increases in tion, these findings show how disability from road injuries can
age-standardised incidence between 1990 and 2017, while low lead to lifelong health loss in the form of conditions like TBI
SDI quintile locations increased less, and high SDI quintile loca- that can have irreversible health consequences, emphasising the
tions actually decreased in terms of incidence. These findings importance of preventative strategies in reducing future burden
are reminiscent of the transition phases described in literature from road injuries.
on the epidemiological transition, where a country’s burden of There were several limitations to this study. First, similar to
disease and injury is modulated by where the country is on the other analyses in GBD research, the uncertainty of road injury
development spectrum. For example, Papua New Guinea and morbidity and mortality rates is affected by data availability. In
Myanmar, low and low-middle SDI countries, respectively, have countries and territories with absent or sparse data, the model-
experienced significant economic growth in the past decade.42 ling framework relies more on covariates and other locations
Both countries have also experienced increased incidence of that do have data, which leads to greater uncertainty around the
road injuries over the past 10 years, while the burden of commu- point estimates. Greater UIs mean that readers and policymakers
nicable diseases decreased. These country experiences support should use more caution when acting on these results. To address
the idea that while countries transition to more stable econo- this limitation, health systems in the future should prioritise good
mies, road injuries predictively become more burdensome. Inter- data collection strategies in order to help improve the accuracy
estingly, there is evidence that reductions in road traffic injuries of future research in road injury burden. Current data limita-
have positive effects on GDP per capita, so there is incentive tions, modelling differences and garbage code redistribution,
8 James SL, et al. Inj Prev 2020;0:1–11. doi:10.1136/injuryprev-2019-043302Original article
Inj Prev: first published as 10.1136/injuryprev-2019-043302 on 8 January 2020. Downloaded from http://injuryprevention.bmj.com/ on February 14, 2020 by guest. Protected by copyright.
Figure 5 Distribution of most severe nature of injury sustained in road injuries by region in 2017. TBI, traumatic brain injury.
particularly for data-
sparse or data- absent locations likely estimation, the current process for assigning disability to a road
account for much of the difference between global mortality injury case requires predicting the most disabling injury that
estimates from the WHO, which estimated 1.35 million deaths results from a road injury, without taking into consideration the
in 2016, and GBD 2017, which estimated 1.25 million deaths possibility that multiple natures of injury can result from a road
in 2016. Second, as described in other GBD literature on injury injury. In future GBD research, developing methods to capture
all forms of disability that result from road injuries could help
measure the total health loss burden from these conditions.
What is already known on the subject Finally, a general limitation of non- fatal injury estimation in
GBD 2017 was that long-term follow-up studies used for injury
severity hierarchies and probabilities of long-term disability are
►► Road injuries are known to be a major cause of health loss only available in select countries. Future GBD updates should
globally, both in terms of morbidity and mortality. focus on adding more data to inform this analytical process.
►► While progress on mitigating health loss from road injuries
has been made in some locations, there is still considerable Conclusion
morbidity and mortality in all areas of the world, including in This study further substantiates the key messages highlighted in
low-income and middle-income regions. the Global Status Report on Road Safety 2018 by the WHO.
In particular, despite improvements in mortality, road injuries
remain critically important cause of morbidity and mortality
What this study adds globally, and more research is needed to better measure and
understand how road injuries can be prevented, particularly in
developing economies. Investing in preventative measures as
►► Road injury incidence has increased globally from 1990 to
well as ensuring that victims of road injuries have access to first
2017, while mortality has decreased.
response trauma and medical care could help drive improve-
►► Trends in mortality-to-incidence ratios for road injuries have
ments in road injury burden in the future.
varied depending on region of the world between 1990 and
2017.
Author affiliations
►► The specific type of bodily injury occurring in road injuries 1
Institute for Health Metrics and Evaluation, University of Washington, Seattle,
is now estimated, with the most common nature of injury Washington, USA
2
sustained in road injuries being a fracture of the patella, tibia 3
College of Medicine, University College Hospital, Ibadan, Nigeria
or fibula, or ankle. Department of Health Education and Health Promotion, Hormozgan University of
Medical Sciences, Bandar Abbas, Iran
James SL, et al. Inj Prev 2020;0:1–11. doi:10.1136/injuryprev-2019-043302 9Original article
Inj Prev: first published as 10.1136/injuryprev-2019-043302 on 8 January 2020. Downloaded from http://injuryprevention.bmj.com/ on February 14, 2020 by guest. Protected by copyright.
4 54
Department of Population Health Research, King Abdullah International Medical Obesity Research Center, Research Institute for Endocrine Science, Shahid Beheshti
Research Center, Riyadh, Saudi Arabia University of Medical Sciences, Tehran, Iran
5 55
Department of Health Policy and Management, Kuwait University, Safat, Kuwait Faculty of Medicine & Health Sciences, Stellenbosch University, Cape Town, South
6
International Centre for Casemix and Clinical Coding, National University of Africa
56
Malaysia, Bandar Tun Razak, Malaysia Department of Diplomacy and Public Relations, University of Human Development,
7
Department of Epidemiology, Arak University of Medical Sciences, Arak, Iran Sulaimaniyah, Iraq
8 57
Public Health Risk Sciences Division, Public Health Agency of Canada, Toronto, Department of Pharmacology and Therapeutics, University of Nigeria Nsukka,
Ontario, Canada Enugu, Nigeria
9 58
Department of Nutritional Sciences, University of Toronto, Toronto, Ontario, Canada Regional Medical Research Centre, Indian Council of Medical Research,
10
Social Determinants of Health Research Center, Lorestan University of Medical Bhubaneswar, India
59
Sciences, Khorramabad, Iran Paramedic Department, Kermanshah University of Medical Sciences, Kermanshah,
11
Hepatitis Research Center, Lorestan University of Medical Sciences, Khorramabad, Iran
60
Iran Taleghani Hospital, Kermanshah University of Medical Sciences, Kermanshah, Iran
12 61
College of Health Science and Medicine, Wolaita Sodo University, Sodo, Ethiopia Health Policy Research Center, Institute of Health, Shiraz University of Medical
13
Nuffield Department of Population Health, University of Oxford, Oxford, UK Sciences, Shiraz, Iran
14 62
Swedish Neuroscience Institute, Swedish Brain and Spine Specialists, Seattle, Department of Public Health, Ambo University, Ambo, Ethiopia
63
Washington, USA Chronic Diseases (Home Care) Research Center, Hamadan University of Medical
15
Department of Global Health and Infection, Brighton and Sussex Medical School, Sciences, Hamadan, Iran
64
Brighton, UK Razi Herbal Medicines Research Center, Lorestan University of Medical Sciences,
16
School of Public Health, Addis Ababa University, Addis Ababa, Ethiopia Khorramabad, Iran
17 65
Department of Public Health, Hawassa University, Hawassa, Ethiopia Symbiosis Institute of Health Sciences, Symbiosis International University, Pune,
18
Department of Pharmaceutical Nanotechnology, Tehran University of Medical India
66
Sciences, Tehran, Iran Departments of Vascular & Endovascular Surgery, General Surgery, Kermanshah
19
School of Pharmacy, Debre Tabor University, Ambo, Ethiopia University of Medical Sciences, Kermanshah, Iran
20 67
Department of Public Health, Arba Minch University, Arba Minch City, Ethiopia Peripheral Vascular Intervention Department, Kermanshah University of Medical
21
School of Public Health, Curtin University, Perth, Western Australia, Australia Sciences, Kermanshah, Iran
22 68
Department of Public Health, Mizan-Tepi University, Teppi, Ethiopia Hospital Universitario de la Princesa, Autonomous University of Madrid, Madrid,
23
Department of Biostatistics and Epidemiology, Adigrat University, Adigrat, Ethiopia Spain
24 69
Health Management and Economics Research Center, Iran University of Medical Respiratory Diseases Networking Biomedical Research Centre (CIBERES), Institute
Sciences, Tehran, Iran of Health Carlos III, Madrid, Spain
25 70
Computer Science Department, University of Human Development, Sulaimaniyah, Department of Criminology, Law and Society, University of California Irvine, Irvine,
Iraq California, USA
26 71
Department of Epidemiology and Health Statistics, Central South University, Department of Medicine, University of Valencia, Valencia, Spain
72
Changsha, China Carlos III Health Institute, Biomedical Research Networking Center for Mental
27
Faculty of Medicine, Babol University of Medical Sciences, Babol, Iran Health Network (CiberSAM), Madrid, Spain
28 73
Department of Global Health, Economics and Policy, University of Kragujevac, Nursing Department, Institute of Tropical Medicine, Aksum, Ethiopia
74
Kragujevac, Serbia Axum College of Health Science, Mekelle, Ethiopia
29 75
Social Development & Health Promotion Research Center, Kermanshah University School of Public Health, University of Adelaide, Adelaide, South Australia, Australia
76
of Medical Sciences, Kermanshah, Iran Department of Environmental Health, Wollo University, Dessie, Ethiopia
30 77
Department of Community Medicine, Kasturba Medical College, Manipal University, Department of Community Medicine, Iran University of Medical Sciences, Tehran,
Mangalore, India Iran
31 78
Department of Epidemiology, Hamadan University of Medical Sciences, Hamadan, Department of Public Health, University of KwaZulu-Natal, Durban, South Africa
79
Iran Faculty of Health Sciences, Jagiellonian University Medical College, Krakow, Poland
32 80
Department of Dermatology, Wolaita Sodo University, Wolaita Sodo, Ethiopia The Agency for Health Technology Assessment and Tariff System, Warsaw, Poland
33 81
Department of Population Sciences, Jatiya Kabi Kazi Nazrul Islam University, Department of Physical Therapy, Faculty of Allied Health Sciences, Naresuan
Mymensingh, Bangladesh University, Meung District, Thailand
34 82
Department of Public Health, University of Newcastle, Newcastle, New South Department of Epidemiology and Biostatistics, Tehran University of Medical
Wales, Australia Sciences, Tehran, Iran
35 83
School of Medicine, Xiamen University Malaysia, Sepang, Malaysia Ophthalmic Research Center, Shahid Beheshti University of Medical Sciences,
36
Department of Internal and Pulmonary Medicine, Sheri Kashmir Institute of Medical Tehran, Iran
84
Sciences, Srinagar, India School of International Development and Global Studies, University of Ottawa,
37
Department of Clinical Medicine and Community Health, University of Milan, Ottawa, Ontario, Canada
85
Milano, Italy School of Public Health, Bahir Dar University, Bahir Dar, Ethiopia
38 86
School of Public Health, University of Haifa, Haifa, Israel Health Economics & Finance, Jackson State University, Jackson, Mississippi, USA
39 87
Community-Based Participatory-Research (CBPR) Center, Tehran University of Research Center for Public Health, Tsinghua University, Peking, China
88
Medical Sciences, Tehran, Iran Health Promotion Research Center, Iran University of Medical Sciences, Tehran, Iran
40 89
Knowledge Utilization Research Center (KURC), Tehran University of Medical Indian Institute of Public Health, Public Health Foundation of India, Gurugram,
Sciences, Tehran, Iran India
41 90
Neurology Department, Janakpuri Super Specialty Hospital Society, New Delhi, Department of Health Metrics Sciences, School of Medicine, University of
India Washington, Seattle, Washington, USA
42 91
Department of Neurology, New Delhi, India School of Population and Global Health, University of Melbourne, Melbourne,
43
Department of Public Health, University of West Florida, Pensacola, Florida, USA Queensland, Australia
44
Department of Epidemiology and Biostatistics, Haramaya University, Harar, Ethiopia
45
Department of Statistics, Debre Markos University, Debre Markos, Ethiopia Acknowledgements A Badawi acknowledges support by the Public Health
46
Pacific Institute for Research and Evaluation, Calverton, Maryland, United States Agency of Canada. K Deribe acknowledges support by a grant from the Wellcome
47
Information Technology Department, University of Human Development,
Trust [grant number 201900] as part of his International Intermediate Fellowship.
Sulaimaniyah, Iraq
48
Department of Biostatistics, Hamadan University of Medical Sciences, Hamadan, M Jakovljevic acknowledges the Serbian part of this contribution was funded by
Iran the Ministry of Education Science and Technological Development of the Republic
49 of Serbia through Grant OI 175. R Tabarés-Seisdedos acknowledges support
Hamadan University of Medical Sciences, Hamadan, Iran
50
Department of Public Health Medicine, University of KwaZulu-Natal, Durban, South in part by grant number PROMETEOII/2015/021 from Generalitat Valenciana
Africa and the national grant PI17/00719 from ISCIII-FEDER. S Aljunid acknowledges
51
Preventive Medicine and Public Health Research Center, Iran University of Medical support from the International Centre for Casemix and Clinical Coding, Faculty
Sciences, Tehran, Iran of Medicine, National University of Malaysia and Department of Health. Y J
52
School of Medical Sciences, Science University of Malaysia, Kubang Kerian, Kim acknowledges support from the Office of Research & Innovation, Xiamen
Malaysia
53 University Malaysia.
Hospital of the Federal University of Minas Gerais, Federal University of Minas
Gerais, Belo Horizonte, Brazil Funding This study was funded by the Bill & Melinda Gates Foundation.
10 James SL, et al. Inj Prev 2020;0:1–11. doi:10.1136/injuryprev-2019-043302Original article
Inj Prev: first published as 10.1136/injuryprev-2019-043302 on 8 January 2020. Downloaded from http://injuryprevention.bmj.com/ on February 14, 2020 by guest. Protected by copyright.
Map disclaimer The depiction of boundaries on the map(s) in this article do not 19 Suriyawongpaisal P, Kanchanasut S. Road traffic injuries in Thailand: trends,
imply the expression of any opinion whatsoever on the part of BMJ (or any member selected underlying determinants and status of intervention. Inj Control Saf Promot
of its group) concerning the legal status of any country, territory, jurisdiction or area 2003;10:95–104.
or of its authorities. The map(s) are provided without any warranty of any kind, either 20 Global status report on road safety | Injury prevention. Available: https://
express or implied. injuryprevention.bmj.com/c ontent/15/4/286.s hort [Accessed 5 Feb 2019].
21 Dicker D, Nguyen G, Abate D, et al. Global, regional, and national age-sex-specific
Competing interests SLJ reports grants from Sanofi Pasteur outside the
mortality and life expectancy, 1950–2017: a systematic analysis for the global burden
submitted work. TRM reports a contract to evaluate AB InBev Foundation’s efforts to,
of disease study 2017. Lancet 2018;392:1684–735.
among other things, reduce impaired driving in 6 cities using GBD road safety data
22 Kyu HH, Abate D, Abate KH, et al. Global, regional, and national disability-adjusted
in calculating baseline harm.
life-years (DALYs) for 359 diseases and injuries and healthy life expectancy (HALE) for
Patient consent for publication Not required. 195 countries and territories, 1990–2017: a systematic analysis for the global burden
Provenance and peer review Not commissioned; externally peer reviewed. of disease study 2017. Lancet 2018;392:1859–922.
23 Murray CJL, Callender CSKH, Kulikoff XR, et al. Population and fertility by age and
Data availability statement Data are available in a public, open access sex for 195 countries and territories, 1950–2017: a systematic analysis for the global
repository. Data are available on reasonable request. Data may be obtained from a burden of disease study 2017. Lancet 2018;392:1995–2051.
third party and are not publicly available. 24 Stanaway JD, Afshin A, Gakidou E, et al. Global, regional, and national comparative
Open access This is an open access article distributed in accordance with the risk assessment of 84 behavioural, environmental and occupational, and metabolic
Creative Commons Attribution 4.0 Unported (CC BY 4.0) license, which permits risks or clusters of risks for 195 countries and territories, 1990–2017: a systematic
others to copy, redistribute, remix, transform and build upon this work for any analysis for the global burden of disease study 2017. Lancet 2018;392:1923–94.
purpose, provided the original work is properly cited, a link to the licence is given, 25 Haagsma JA, Graetz N, Bolliger I, et al. The global burden of injury: incidence,
and indication of whether changes were made. See: https://creativecommons.org/ mortality, disability-adjusted life years and time trends from the global burden of
licenses/by/4.0/. disease study 2013. Inj Prev 2016;22:3–18.
26 Foreman KJ, Naghavi M, Ezzati M. Improving the usefulness of US mortality data:
ORCID iD new methods for reclassification of underlying cause of death. Popul Health Metr
Spencer L James http://orcid.org/0000-0003-4653-2507 2016;14:14.
27 Foreman KJ, Lozano R, Lopez AD, et al. Modeling causes of death: an integrated
approach using CODEm. Popul Health Metr 2012;10:1.
28 Mackenzie EJ, Rivara FP, Jurkovich GJ, et al. The national study on costs and outcomes
References of trauma. J Trauma 2007;63(6 Suppl):S54–67.
1 Omran AR. The epidemiologic transition. A theory of the epidemiology of population 29 Traumatic Brain Injury. Follow-Up registry and surveillance of TBI in the emergency
change. Milbank Mem Fund Q 1971;49:509–38. department (ED); notice of availability of funds. federal register, 2002. Available:
2 Salomon JA, Murray CJL. The epidemiologic transition revisited: compositional models https://www.federalregister.gov/d ocuments/2002/05/08/02-11359/traumatic-brain-
for causes of death by age and sex. Popul Dev Rev 2002;28:205–28. injurytbi-follow-up-registry-and-surveillance-of-t bi-in-the-emergency-d epartment-ed
3 WHO. Decade of action for road safety 2011-2020. WHO. Available: http://www.who. [Accessed 14 May 2018].
int/roadsafety/decade_of_action/en/ [Accessed 27 Jul 2019]. 30 China Zhuhai Study 2006-2007 - China CDC | GHDx. Available: http://ghdx.
4 Sustainable Development Goals. Sustainable development knowledge platform. healthdata.org/record/c hina-zhuhai-study-2006-2 007-china-cdc [Accessed 15 May
Available: https://sustainabledevelopment.un.org/?menu=1300 [Accessed 27 Jul 2018].
2019]. 31 Functional outcome at 2.5, 5, 9, and 24 months after injury in the Netherlands |
5 WHO. Global status report on road safety 2018. WHO. Available: http://www.who.int/ GHDx. Available: http://g hdx.healthdata.org/record/functional-outcome-25-5-9-and-
violence_injury_prevention/road_safety_status/2018/en/ [Accessed 26 Jul 2019]. 24-months-after-i njury-netherlands [Accessed 15 May 2018].
6 Kim E, Muennig P, Rosen Z. Vision zero: a toolkit for road safety in the modern era. Inj 32 Health-Related quality of life after burns: a prospective multicentre cohort study with
Epidemiol 2017;4. 18 months follow-u p | GHDx. Available: http://ghdx.healthdata.org/r ecord/health-
7 Shinar D. Traffic safety and human behavior. 2nd edn. Emerald Group Publishing, related-quality-life-after-burns-prospective-multicentre-c ohort-study-18-months-
2017. follow [Accessed 15 May 2018].
8 The Safe System - Towards Zero Foundation. Available: http://www.towardszerofound 33 Netherlands injury surveillance system 2007 | GHDx. Available: http://ghdx.
ation.org/thesafesystem/ [Accessed 27 Jul 2019]. healthdata.org/record/n etherlands-injury-surveillance-system-2 007 [Accessed 15 May
9 WHO. Road traffic injuries publications and resources. WHO. Available: http://www. 2018].
who.i nt/violence_injury_prevention/p ublications/road_traffic/en/ [Accessed 27 Jul 34 Netherlands injury surveillance system 2010 | GHDx. Available: http://ghdx.
2019]. healthdata.org/record/n etherlands-injury-surveillance-system-2 010 [Accessed 14 May
10 Peden M, Scurfield R. World report on road traffic injury prevention. Geneva: World 2018].
Health Organization, 2004. 35 GBD 2016 Traumatic Brain Injury and Spinal Cord Injury Collaborators. Global,
11 James SL, Abate D, Abate KH, et al. Global, regional, and national incidence, regional, and national burden of traumatic brain injury and spinal cord injury, 1990-
prevalence, and years lived with disability for 354 diseases and injuries for 195 2016: a systematic analysis for the global burden of disease study 2016. Lancet
countries and territories, 1990–2017: a systematic analysis for the global burden of Neurol 2019;18:56–87.
disease study 2017. Lancet 2018;392:1789–858. 36 Salomon JA, Haagsma JA, Davis A, et al. Disability weights for the global burden of
12 Roth GA, Abate D, Abate KH, et al. Global, regional, and national age-sex-specific disease 2013 study. Lancet Glob Health 2015;3:e712–23.
mortality for 282 causes of death in 195 countries and territories, 1980–2017: 37 Odero W, Garner P, Zwi A. Road traffic injuries in developing countries:
a systematic analysis for the global burden of disease study 2017. Lancet a comprehensive review of epidemiological studies. Trop Med Int Health
2018;392:1736–88. 1997;2:445–60.
13 The burden of disease and injury in Iran 2003 | Population health metrics | Full text. 38 Goniewicz K, Goniewicz M, Pawłowski W, et al. Road accident rates: strategies
Available: https://pophealthmetrics.biomedcentral.com/articles/10.1186/1478-7 954- and programmes for improving road traffic safety. Eur J Trauma Emerg Surg
7-9 [Accessed 5 Feb 2019]. 2016;42:433–8.
14 Trends of fatal road traffic injuries in Iran (2004–2011). Available: https://www.ncbi. 39 Gabbe BJ, Lyons RA, Fitzgerald MC, et al. Reduced population burden of road
nlm.nih.gov/p mc/articles/P MC3665536/ [Accessed 5 Feb 2019]. transport-related major trauma after introduction of an inclusive trauma system. Ann
15 Achievements in public health, 1900-1999 motor-vehicle safety: a 20th century public Surg 2015;261:565–72.
health achievement. Available: https://www.cdc.gov/mmwr/preview/mmwrhtml/ 40 MacKenzie EJ, Rivara FP, Jurkovich GJ, et al. A national evaluation of the effect of
mm4818a1.htm [Accessed 10 May 2019]. trauma-center care on mortality. N Engl J Med 2006;354:366–78.
16 McDermott FT, Hough DE. Reduction in road fatalities and injuries after legislation for 41 Clement ND, Tennant C, Muwanga C. Polytrauma in the elderly: predictors of the
compulsory wearing of seat belts: experience in Victoria and the rest of Australia. Br J cause and time of death. Scand J Trauma Resusc Emerg Med 2010;18:26.
Surg 1979;66:518–21. 42 World Bank. GDP per capita (current US$). Available: https://data.worldbank.org/
17 Ameratunga S, Hijar M, Norton R. Road-Traffic injuries: confronting disparities to indicator/NY.GDP.P CAP.CD?locations=US-M M&name_desc=false [Accessed 18 Mar
address a global-health problem. Lancet 2006;367:1533–40. 2019].
18 Petridou E, Moustaki M. Human factors in the causation of road traffic crashes. Eur J 43 World Bank. The high toll of traffic injuries: unacceptable and preventable. World
Epidemiol 2000;16:819–26. Bank, 2017.
James SL, et al. Inj Prev 2020;0:1–11. doi:10.1136/injuryprev-2019-043302 11You can also read